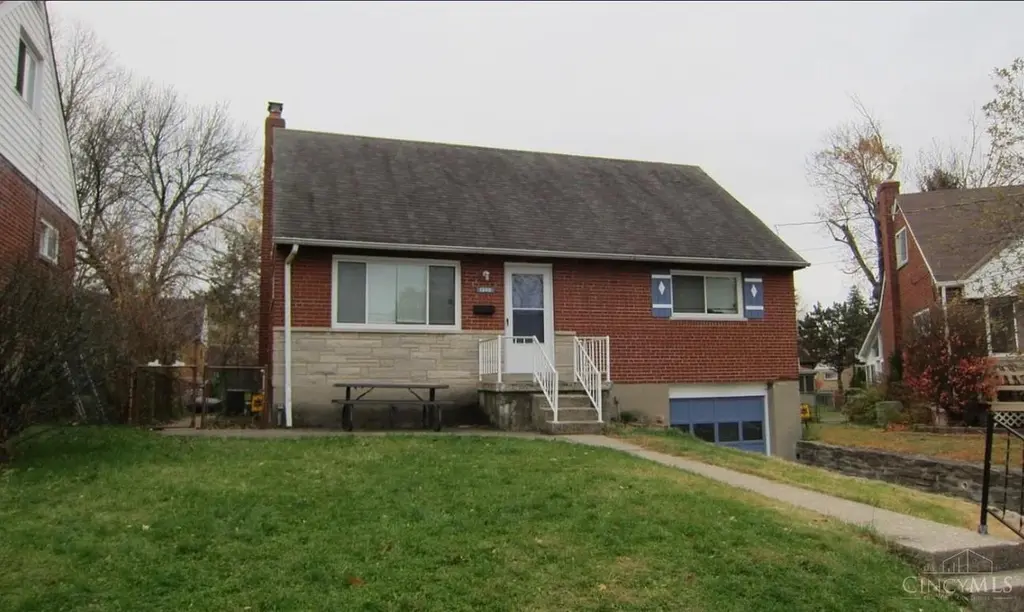
1509 Balfour Ln · North College Hill, OH
Flood risk 3/10 · Minor
- FEMA flood zone
- X (unshaded)
- Chance of flooding over 30 yrs
- 0.1%
- Est. flood insurance / yr
- $507 – $1,088
Fire risk 1/10 · Minimal
- Est. fire insurance / yr
- $713 – $1,323
Heat risk 4/10 · Minor
- Hot days now (above 103°F)
- 7 days/yr
- Hot days in 30 yrs
- 19 days/yr
Wind risk 2/10 · Minimal
- Chance of severe wind over 30 yrs
- 1.0%
Air-quality risk 3/10 · Minor
- Unhealthy air days now
- 2 days/yr
- Unhealthy air days in 30 yrs
- 3 days/yr
Risk factors via First Street. Map © Google.
Why this score? — see what drove the D+ grade
The composite is a weighted blend of 9 inputs, each scored 0–100. Each bar is that input's sub-score; the figure is the points it added to the 100-point composite (weight × sub-score).
- Cash flow +15.9/30.0
- ARV discount +12.0/15.0
- DSCR +4.9/10.0
- Rent growth +4.2/5.0
- 1% rule +4.1/10.0
- Livability +3.7/5.0
- Condition / age +2.5/5.0
- Schools +1.5/10.0
- Appreciation +0.0/10.0
$210,000
🖨 Deal sheet (PDF) 📄 Offer letter ✓ Due diligence
Listing remarks MLS
Nice Brick Cape Cod Located On A Quiet Cul-de-sac Street. Updated Kitchen and Bathrooms. Refinished Hardwood Floors. New HVAC, windows, and doors. Fenced in back yard. Very convenient location close access to Cross County Highway. Move right in!
Key facts
- Quiet cul-de-sac
- Tenant-occupied
- 5,401 sq ft lot
Tags
Property features AI
Finance
- HOA & community: No HOA
Exterior
- Parking: Built-in garage with 1 garage space; Driveway parking
- Utilities: Public water; Public sewer; Natural gas
- Home design: Cape Cod style; Single-family home; One and one-half stories; Poured foundation
- Construction: Brick construction; Built with poured foundation
- Exterior features: Double-hung, insulated windows; Shingle roof
Interior
- Kitchen: Tile and wood flooring; Walkout; Wood cabinets; Includes dishwasher, microwave, oven/range, refrigerator
- Bedrooms: 4 bedrooms total; Primary bedroom approx. 12 x 10 (on level 1); Bedroom 2 approx. 10 x 10 (on level 1); Bedroom 3 approx. 17 x 12 (on level 2); Bedroom 4 approx. 10 x 12 (on level 2)
- Flooring: Wood floors in living and dining areas; Tile in kitchen
- Bathrooms: Four full bathrooms — two on level 1 and two on level 2
- Heating & cooling: Forced air gas heating; Central air conditioning
- Interior features: Total of 7 rooms; Partial, unfinished basement
- Laundry & utility: Electric water heater
Neighborhood map
What this means for you Summary
Snapshot
- This is a 4-bed/2.0-bath single-family listed at $210k.
Deal economics
- At list price, monthly cash flow is $99 ($1k/yr) — positive.
- The deal already cash-flows at list — no discount required.
- To meet the 1% rule (rent ≥ 1% of price), the offer needs to be $192k (8.6% below list).
- Recommended offer: $191k (9.0% below list) — sets the bar for market timing.
Location & tenants
- Location reads 74/100 on livability (#288 in OH, #4,745 nationally) — a middle-class / working-renter tenant base. Strengths: commute A+, cost of living A+, housing A+; Watch: employment C-, schools D+, amenities D.
- North College Hill City (suburban): math 13% / reading 22% proficiency, ranked #637 of 656 in OH (top 97%) — low school quality limits family demand, transient renter base, plan for 1-2y turnover; 75% free/reduced lunch — lower-income household profile, screen leases tightly.
- Market conditions: Rents rising fast (+6.9%/yr); 84 active listings in the ZIP; 9 comparable units currently listed for rent nearby; rentals at typical pace (median 22d on market — plan ~3-4 weeks tenant-placement turnaround); 801 units permitted in Hamilton County in 2024 (190 in 5+ unit buildings).
- This rent runs 32% of the median local income ($71k/yr) — at the standard rent-burdened threshold; future hikes will face affordability resistance.
Forward outlook
- Local home prices are declining (-3.0%/yr); year-one equity from $1k of loan paydown is wiped out by about $6k of value loss. Plan a longer hold.
Negotiation context
- It's been on market 93 days — a 9% lower offer ($191k) is reasonable based on typical stale-listing flexibility.
- 6 sale attempts since 25y ago with the ask held roughly flat each time — persistent listings suggest the price (not the market) is what's stuck; bring a comps-based counter.
- Current owner paid $95k; list at $210k implies a 120% gain — meaningful room to come down on a strong offer.
Risks & watch-outs
- Watch-outs: built in 1958 — expect roof / HVAC / electrical / plumbing capex.
Questions for the listing agent
- It's been on market 93 days. Have you received any prior offers? Is the seller open to a 9% concession, seller financing, or rate buy-down credit?
- Built in 1958 — when were the roof, HVAC, electrical panel, plumbing, and water heater last replaced?
- Why hasn't it sold? Are there any deal-killer items the seller is aware of (foundation, flood, title, zoning, code violations)?
- Is there a deadline driving the sale (1031 exchange, divorce, estate, relocation)? That informs how much negotiation room exists.
- Schools are D-rated, which usually means shorter tenancies and higher turnover. Who's the typical renter profile here, and what's been the actual vacancy rate?
- Crime grade is F in this area — have there been break-ins, vandalism, or insurance claims at this property in the last 3 years? What carrier currently insures it and at what premium?
- The area grade is low — what's the realistic commute time and amenity access for the typical tenant pool here? Any planned neighborhood developments (good or bad) we should know about?
- What's the average days-on-market for RENTAL listings here right now (not sales)? A rising rental-DOM trend means longer vacancies and softer asking-rent achievability than the comps imply.
- What's the recent tenant-quality profile in this submarket — average credit score on applications, eviction rate, late-payment / NSF rate, and stable-employment percentage? A property-management company in the area should have these aggregated.
- How much new for-sale + rental construction is in the pipeline within 1–3 miles? Heavy new supply typically softens prices + rents 12–24 months out; constrained supply supports both.
Investment metrics
- 1% rule
- 0.91% ✗
- Cap rate
- 6.86%
- Cash-on-cash
- 2.01%
- DSCR
- 1.09
- GRM
- 9.1
CMA / ARV
- ARV (on-the-fly)
- $233,553
- Comps found
- 12
Show comp detail 12 sales within ~0.75 mi
| Address | Dist | Beds/Ba | Sqft | Sold | Price | $/sf | Match |
|---|---|---|---|---|---|---|---|
| 1523 Gardenwood Ct | 0.10mi | 4/2.0 | 1,621 (-12%) | 5mo | $255,000 | $157 | 71 |
| 1476 Foxwood Dr | 0.19mi | 4/2.5 | 1,661 (-10%) | 3mo | $259,900 | $156 | 71 |
| 6832 Tarawa Dr | 0.45mi | 4/3.0 | 1,840 (+0%) | 6mo | $265,000 | $144 | 70 |
| 6531 Hamilton Ave | 0.70mi | 3/2.5 (-1) | 1,848 (+0%) | 2mo | $145,000 | $78 | 58 |
| 7404 Joseph St | 0.52mi | 3/1.5 (-1) | 1,720 (-6%) | 2mo | $197,600 | $115 | 56 |
| 7617 Elizabeth St | 0.73mi | 4/2.5 | 1,812 (-2%) | 7mo | $230,600 | $127 | 56 |
| 6820 Tarawa Dr | 0.48mi | 3/2.0 (-1) | 1,986 (+8%) | 8mo | $210,000 | $106 | 53 |
| 6543 Hamilton Ave | 0.66mi | 3/3.0 (-1) | 1,804 (-2%) | 6mo | $225,000 | $125 | 52 |
| 1914 Madison Ave | 0.67mi | 3/2.0 (-1) | 1,666 (-9%) | 0mo | $270,000 | $162 | 48 |
| 1500 Madison Ave | 0.44mi | 5/3.5 (+1) | 2,070 (+13%) | 3mo | $320,787 | $155 | 45 |
| 1722 Stevens Ave | 0.63mi | 3/1.0 (-1) | 1,641 (-11%) | 4mo | $103,000 | $63 | 40 |
| 8881 Ebro Ct | 0.74mi | 3/1.0 (-1) | 1,620 (-12%) | 2mo | $204,000 | $126 | 36 |
Match score weights: distance 35% · size 25% · config 20% · recency 20%. Top-matched comps best support the ARV.
Projected returns pro-forma
-3.0% appreciation · 6.92% rent growth · sell at horizon
- IRR
- -8.9%
- Equity multiple
- 0.66×
- Total profit
- $-19,873
- Equity at exit
- $31,312
- IRR
- 5.1%
- Equity multiple
- 1.44×
- Total profit
- $25,830
- Equity at exit
- $18,157
Cash invested: $58,800 (down + closing). Projections, not guarantees.
Landlord ↔ Tenant lean methodology
- Overall (STATE)
- 73 Landlord-Friendly
- State Ohio
- 73 Landlord-Friendly · R+6
- County
- — inherits STATE
- City
- — inherits STATE
ZIP-level market 45231
- Rents YoY
- 6.9%
- Active inventory
- 84
- Price-to-rent
- 9.1×
Monthly cashflow live
- Estimated rent
- $1,920 high interval (Pro) →
- Mortgage (P&I)
- −$1,101
- Tax from tax record
- −$229 /mo · $2,753/yr
- Insurance
- −$88
- HOA
- −$0
- Vacancy / Maint / Mgmt
- −$403
- Net cashflow
- $99
Break-even live
Sensitivity live
| Price | -10% $217 | -5% $158 | +0% $99 | +5% $39 | +10% $-20 |
|---|---|---|---|---|---|
| Rent | -10% $-53 | -5% $23 | +0% $99 | +5% $174 | +10% $250 |
| Rate | -1.0pp $204 | -0.5pp $152 | base $99 | +0.5pp $44 | +1.0pp $-11 |
UW: 25.0% down · 7.5% · 30yr · 1.5% tax · 5.0% vac · 8.0% maint · 8.0% mgmt
Financing live
Cash to close
- Down payment
- $52,500
- Closing costs
- $6,300
- Reserves months
- —
- Total cash needed
- —
Loan-product check · same deal, 3 products live
Conventional
25% down · 7.5% · 30yr
- Down + closing
- —
- Monthly P&I
- —
- Monthly cashflow
- —
- DSCR
- —
- Eligible?
- —
Personal DTI + credit; lowest rate.
DSCR
20% down · 8.5% · 30yr
- Down + closing
- —
- Monthly P&I
- —
- Monthly cashflow
- —
- DSCR
- —
- Eligible?
- —
No personal income docs; deal must DSCR.
Hard money
10% down · 12.0% · 12mo
- Down + closing
- —
- Monthly P&I
- —
- Monthly cashflow
- —
- DSCR
- —
- Eligible?
- —
Short-term bridge; refi at stabilization.
Rent comps 9 comps
| Address | Beds | Baths | Sqft | Rent | $/sqft | DOM | Units | Dist |
|---|---|---|---|---|---|---|---|---|
| 1740 Bising Ave North College Hill, OH | 3.0 | 2.0 | 1235 | $1,697 | $1.37 | 2d | 6 | 0.34mi |
| 1522 Kinney Ave Cincinnati, OH | 3.0 | 1.0 | 1282 | $1,695 | $1.32 | 17d | 1 | 0.65mi |
| 1522 Kinney Ave Cincinnati, OH | 3.0 | 1.0 | 1282 | $1,095 | $0.85 | 24d | 1 | 0.65mi |
| 6834 Betts Ave Cincinnati, OH | 4.0 | 1.5 | 1426 | $1,695 | $1.19 | 24d | 1 | 0.70mi |
| 1805 Emerson Ave Cincinnati, OH | 3.0 | 1.0 | 1912 | $1,550 | $0.81 | 24d | 1 | 0.90mi |
| 9029 Daly Rd Unit 8963 Cincinnati, OH | 3.0 | 2.5 | 1315 | $1,771 | $1.35 | 21d | 1 | 1.01mi |
| 1104 Archland Dr Cincinnati, OH | 3.0 | 2.0 | 1533 | $2,036 | $1.33 | 8d | 1 | 1.14mi |
| 1015 Thunderbird Ave Cincinnati, OH | 3.0 | 1.5 | 1494 | $2,146 | $1.44 | 44d | 1 | 1.20mi |
| 9642 Arvin Ave Cincinnati, OH | 4.0 | 3.0 | 1860 | $2,200 | $1.18 | 15d | 1 | 1.47mi |
Listing history 32 events
-
2026-06-18days on market $210,000 Active 93 DOM
-
2026-06-17days on market $210,000 Active 92 DOM
-
2026-06-16days on market $210,000 Active 91 DOM
-
2026-06-15days on market $210,000 Active 90 DOM
-
2026-06-13days on market $210,000 Active 88 DOM
-
2026-06-09days on market $210,000 Active 84 DOM
-
2026-06-08days on market $210,000 Active 83 DOM
-
2026-06-07days on market $210,000 Active 82 DOM
-
2026-06-03days on market $210,000 Active 78 DOM
-
2026-06-02days on market $210,000 Active 77 DOM
-
2026-06-01days on market $210,000 Active 76 DOM
-
2026-05-31days on market $210,000 Active 75 DOM
-
2026-03-14$210,000 Active
-
2023-06-09price $79,900
-
2018-08-17soldstatus $95,350
-
2018-08-14soldstatus $95,350 Sold 245-char remark
Show marketing remark (245 chars)
Nice Brick Cape Cod Located On A Quiet Cul-de-sac Street. Updated Kitchen and Bathrooms. Refinished Hardwood Floors. New HVAC, windows, and doors. Fenced in back yard. Very convenient location close access to Cross County Highway. Move right in!
-
2018-06-26historical Accept Backup Offers 245-char remark
Show marketing remark (245 chars)
Nice Brick Cape Cod Located On A Quiet Cul-de-sac Street. Updated Kitchen and Bathrooms. Refinished Hardwood Floors. New HVAC, windows, and doors. Fenced in back yard. Very convenient location close access to Cross County Highway. Move right in!
-
2018-06-18price $99,900 245-char remark
Show marketing remark (245 chars)
Nice Brick Cape Cod Located On A Quiet Cul-de-sac Street. Updated Kitchen and Bathrooms. Refinished Hardwood Floors. New HVAC, windows, and doors. Fenced in back yard. Very convenient location close access to Cross County Highway. Move right in!
-
2018-04-21price $105,900 245-char remark
Show marketing remark (245 chars)
Nice Brick Cape Cod Located On A Quiet Cul-de-sac Street. Updated Kitchen and Bathrooms. Refinished Hardwood Floors. New HVAC, windows, and doors. Fenced in back yard. Very convenient location close access to Cross County Highway. Move right in!
-
2018-03-05price $109,900 245-char remark
Show marketing remark (245 chars)
Nice Brick Cape Cod Located On A Quiet Cul-de-sac Street. Updated Kitchen and Bathrooms. Refinished Hardwood Floors. New HVAC, windows, and doors. Fenced in back yard. Very convenient location close access to Cross County Highway. Move right in!
-
2018-02-03$114,900 Active 245-char remark
Show marketing remark (245 chars)
Nice Brick Cape Cod Located On A Quiet Cul-de-sac Street. Updated Kitchen and Bathrooms. Refinished Hardwood Floors. New HVAC, windows, and doors. Fenced in back yard. Very convenient location close access to Cross County Highway. Move right in!
-
2016-04-17price $378,000
-
2016-04-17historical
-
2016-03-12$79,900 Active
-
2016-03-04historical
-
2015-12-28$79,900 Active
-
2015-04-03historical
-
2014-11-12$85,000 Active
-
2001-12-27soldstatus $99,000
-
2001-11-28soldstatus $99,000
-
2001-07-04$98,700
-
1993-11-08soldstatus $74,000
ⓘ Source: listings_history table (triggers on properties + properties_extension) + one-shot
backfill from property_details.listing_events for pre-trigger history.
Tax reassessment forecast OH · Partial reset (capped growth)
- Current annual tax
- $2,753 · $229/mo
- Projected year-2 tax
- $3,015 · $251/mo
- Expected delta
- +$261/yr (+$22/mo · 9.5%)
ⓘ Screening estimate from a state-policy table — verify with the county assessor before closing.
Climate risk First Street
- Flood 3/10 Moderate FEMA zone X (unshaded) · 10% chance over 30 yrs
- Wildfire 1/10 Low
- Heat 4/10 Moderate 7 d/yr ≥103°F today · 19 d/yr by 30 yrs out
- Wind 2/10 Low 100% chance of damaging wind over 30 yrs
- Air quality 3/10 Moderate 2 unhealthy d/yr today · 3 by 30 yrs out
Nearby sold comps map
Loading sold comps map…
Walkable amenities ~0.75 mi
Loading nearby amenities…
Taxation est. · year 1
- Rental income
- $23,039
- − Mortgage interest
- −$11,763
- − Property taxes
- −$2,753
- − Insurance
- −$1,050
- − Repairs & maintenance
- −$1,843
- − Management
- −$1,843
- − Depreciation
- −$6,109
- Taxable loss
- −$2,323
- Est. tax savings @ 24.0%
- +$557
- After-tax cash flow
- $1,740/yr
For passive investors: Depreciation is non-cash, so a rental often shows a tax loss while cash-flowing — sheltering income. Rental losses are passive: they offset passive income freely, and up to $25,000/yr can offset ordinary (W-2) income if you actively participate and your MAGI is under $100k (phasing out to $0 by $150k); unused losses carry forward. On sale, claimed depreciation is recaptured at up to 25%, and gains may owe capital-gains tax (a 1031 exchange can defer both). Figures are a year-1 estimate at your 24.0% rate — not tax advice; consult a CPA.
Schools (NCES district)
- District
- North College Hill City
- NCES district ID
- 3904451
- Math proficiency
- 13% ▼ -14.00%
- Reading proficiency
- 22% ▼ -11.00%
- Median HH income
- $40,355
- Composite
- 14.89/100
- National rank
- #9375
- State rank
- #637 of 656 in OH
Livability — North College Hill
- Score
- 74/100
- State rank
- #288
- US rank
- #4745
Category grades
Schools grade is shown separately in the Schools card above.
Census & demographics
- Census place
- North College Hill, OH
- County
- Hamilton County · 701,295 people
- Metro
- Cincinnati, OH-KY-IN
- Population (ZIP)
- 40,463
- Household income
- $71,353
- Rent vs Own
- Severe rent burden
- 846.0
Population outlook (Hamilton County) Hauer SSP2
- Today (2025)
- 826,054 people
- By 2030
- 830,947 · +0.6%
- By 2040
- 832,319 · +0.8%
- By 2050
- 822,428 · -0.4%
- By 2075
- 788,688 · -4.5%
- By 2100
- 710,674 · -14.0%
Race, ethnicity, and origin ACS 2023
- Neighborhood character
- Diverse neighborhood (Simpson 0.61)
- Race & ethnicity
- White 47% Black 40% Two or more races 8% Hispanic / Latino 3% Asian 2%
- Common ancestry
- Lithuanian 1% Slovak 1% Iranian 1%
- Foreign-born
- 5% · Canada, India
- Languages at home
- 94% English-only · Spanish 2% Other Indo-European 1% French/Haitian/Cajun 1%
Political lean MEDSL · Hamilton
- 2024 margin
- D (+14.9) · D 57.0% · R 42.1%
- 2008→2024 swing
- +7.9pp toward D · 2008: 7.0pp · 2024: 14.9pp
- All cycles
- 2024: D+14.9 2020: D+15.9 2016: D+9.5 2012: D+4.9 2008: D+7.0
Not yet ingested
- Civics
- —
Market trends
- HPI YoY
- ▼ -181.25%
- Current HPI
- 228.2912
- Rent YoY
- ▲ 6.92%
- Metro
- Cincinnati, OH-KY-IN
- State GDP YoY
- ▲ 1.98%
- F500 in state
- 48
Industry mix (Fortune 500 HQ in OH)
| Industry | F500 HQs | Revenue |
|---|---|---|
| Insurance | 3 | $145B |
|
||
| Industrial Machinery | 3 | $49B |
|
||
| Financial Services | 3 | $24B |
|
||
| Consumer Goods | 2 | $93B |
|
||
| Aerospace / Defense | 2 | $47B |
|
||
| Utilities | 2 | $33B |
|
||
Price history
+183.8% since first listed20 events — show timeline
- 2026-03-14 Listed $210,000 Cincy MLS
- 2023-06-09 Price Changed $79,900 Cincy MLS
- 2018-08-17 Sold (Public Records) $95,350 Public Records
- 2018-08-14 Sold (MLS) $95,350 Cincy MLS
- 2018-06-26 Contingent — Cincy MLS
- 2018-06-18 Price Changed $99,900 Cincy MLS
- 2018-04-21 Price Changed $105,900 Cincy MLS
- 2018-03-05 Price Changed $109,900 Cincy MLS
- 2018-02-03 Listed $114,900 Cincy MLS
- 2016-04-17 Listing Removed — Cincy MLS
- 2016-04-17 Price Changed $378,000 Cincy MLS
- 2016-03-12 Listed $79,900 Cincy MLS
- 2016-03-04 Listing Removed — Cincy MLS
- 2015-12-28 Listed $79,900 Cincy MLS
- 2015-04-03 Listing Removed — Cincy MLS
- 2014-11-12 Listed $85,000 Cincy MLS
- 2001-12-27 Sold (Public Records) $99,000 Public Records
- 2001-11-28 Sold (MLS) $99,000 Cincy MLS
- 2001-07-04 Listed $98,700 Cincy MLS
- 1993-11-08 Sold (Public Records) $74,000 Public Records
Property tax history
+3.0%/yrLatest (2025): $2,753 · +2.6% YoY. Source: county tax records.
Cash-flow waterfall
monthlySold comps — $/sqft
last 12 mo · ≤1 miLoading sold comps…