5637 Mesa Loop · Canyon Creek, TX
Flood risk 1/10 · Minimal
- FEMA flood zone
- X (unshaded)
- Chance of flooding over 30 yrs
- 0.0%
- Est. flood insurance / yr
- $507 – $1,088
Fire risk 6/10 · Moderate
- Est. fire insurance / yr
- $1,222 – $2,270
Heat risk 7/10 · Major
- Hot days now (above 108°F)
- 7 days/yr
- Hot days in 30 yrs
- 23 days/yr
Wind risk 6/10 · Moderate
- Chance of severe wind over 30 yrs
- 27.0%
Air-quality risk 2/10 · Minimal
- Unhealthy air days now
- 1 days/yr
- Unhealthy air days in 30 yrs
- 2 days/yr
Risk factors via First Street. Map © Google.
Why this score? — see what drove the D grade
The composite is a weighted blend of 9 inputs, each scored 0–100. Each bar is that input's sub-score; the figure is the points it added to the 100-point composite (weight × sub-score).
- Cash flow +15.2/30.0
- ARV discount +7.5/15.0
- DSCR +4.7/10.0
- 1% rule +4.3/10.0
- Schools +4.0/10.0
- Livability +3.0/5.0
- Rent growth +2.8/5.0
- Condition / age +2.5/5.0
- Appreciation +0.0/10.0
$225,000
🖨 Deal sheet (PDF) 📄 Offer letter ✓ Due diligence
Listing remarks
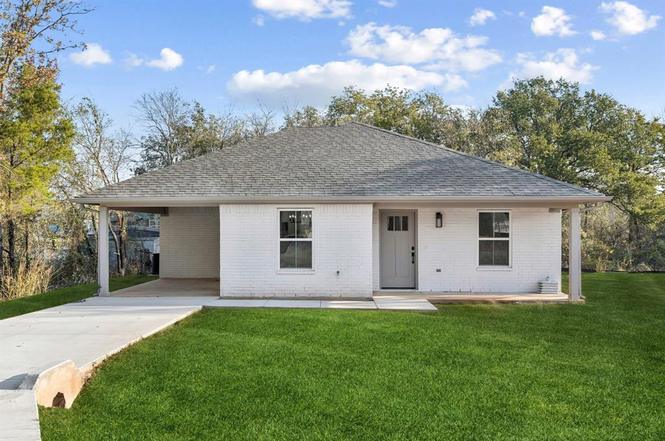
Located in the gated Canyon Creek community near Lake Granbury, this beautifully designed new construction single-story home offers 3 bedrooms, 2 full baths, and a spacious open-concept layout ideal for everyday living and entertaining. The kitchen flows seamlessly into the living and dining areas, creating a bright, welcoming space filled with natural light. The private primary suite features an en-suite bath and generous closet space, while two additional bedrooms provide flexibility for guests, a home office, or hobbies. Enjoy the ease of single-level living along with access to Canyon Creek amenities, including gated security, community pool, clubhouse, park, and boat ramp to Lake Granb
Key facts
- New construction
- En-suite bath
- Open-concept layout
Tags
Neighborhood map
What this means for you Summary
Snapshot
- This is a 3-bed/2.0-bath land listed at $225k.
Deal economics
- At list price, monthly cash flow is $78 ($939/yr) — positive.
- The deal already cash-flows at list — no discount required.
- To meet the 1% rule (rent ≥ 1% of price), the offer needs to be $210k (6.7% below list).
- Recommended offer: $198k (12.0% below list) — sets the bar for market timing.
- Cap rate 6.7% vs local median 4.7% in Canyon Creek — top-decile yield for the area; either an underpriced asset or a hidden risk that comps aren't pricing in. Stress-test before assuming the spread holds.
Location & tenants
- Location reads 60/100 on livability (#1,102 in TX) — a middle-class / working-renter tenant base. Strengths: cost of living A+, housing A+; Watch: health & safety D+, crime F, amenities F.
- Granbury ISD (town): math 46% / reading 46% proficiency, ranked #237 of 826 in TX (top 29%) — families likely to look elsewhere, expect single-tenant / working-renter base with shorter leases.
- Zoned schools: Mambrino School (math 53% / reading 48%, grade D+, #833 of 4,322 statewide, top 20%, 886 students, 53% FRL); Granbury Middle (math 35% / reading 40%, grade F, #736 of 1,662 statewide, top 45%, 846 students, 68% FRL); Granbury H S (math 38% / reading 51%, grade F, #652 of 1,632 statewide, top 43%, 2,202 students, 46% FRL).
- Market conditions: Rents rising (+1.1%/yr); 930 active listings in the ZIP; 15 comparable units currently listed for rent nearby; rentals at typical pace (median 21d on market — plan ~3-4 weeks tenant-placement turnaround); 125 units permitted in Hood County in 2024 (0 in 5+ unit buildings).
- This rent runs 36% of the median local income ($70k/yr) — at the standard rent-burdened threshold; future hikes will face affordability resistance.
Forward outlook
- Local home prices are declining (-3.0%/yr); year-one equity from $2k of loan paydown is wiped out by about $7k of value loss. Plan a longer hold.
- Hood County population projected at +29% by 2050 — long-run rental-demand tailwind backs the buy-and-hold thesis.
Negotiation context
- It's been on market 132 days — a 12% lower offer ($198k) is reasonable based on typical stale-listing flexibility.
- 2 sale attempts; this cycle's ask has dropped $15k (6%) from the opening price — seller is motivated, your offer sets the floor, not the list.
Risks & watch-outs
- Climate carrying-cost: major wind risk, 27% chance of damaging wind over 30y; major wildfire risk; extreme-heat days projected 7→23/yr by 2055 (HVAC capex compounding) — expect insurance premiums to compound above CPI over the hold.
Questions for the listing agent
- It's been on market 132 days. Have you received any prior offers? Is the seller open to a 12% concession, seller financing, or rate buy-down credit?
- What does the HOA fee cover, when was the last increase, and are there any pending special assessments or reserve-fund shortfalls?
- Why hasn't it sold? Are there any deal-killer items the seller is aware of (foundation, flood, title, zoning, code violations)?
- Is there a deadline driving the sale (1031 exchange, divorce, estate, relocation)? That informs how much negotiation room exists.
- Schools are F-rated, which usually means shorter tenancies and higher turnover. Who's the typical renter profile here, and what's been the actual vacancy rate?
- Crime grade is F in this area — have there been break-ins, vandalism, or insurance claims at this property in the last 3 years? What carrier currently insures it and at what premium?
- The area grade is low — what's the realistic commute time and amenity access for the typical tenant pool here? Any planned neighborhood developments (good or bad) we should know about?
- What's the average days-on-market for RENTAL listings here right now (not sales)? A rising rental-DOM trend means longer vacancies and softer asking-rent achievability than the comps imply.
- What's the recent tenant-quality profile in this submarket — average credit score on applications, eviction rate, late-payment / NSF rate, and stable-employment percentage? A property-management company in the area should have these aggregated.
- How much new for-sale + rental construction is in the pipeline within 1–3 miles? Heavy new supply typically softens prices + rents 12–24 months out; constrained supply supports both.
Investment metrics
- 1% rule
- 0.93% ✗
- Cap rate
- 6.71%
- Cash-on-cash
- 1.49%
- DSCR
- 1.07
- GRM
- 8.9
CMA / ARV
No comps found within radius.
Projected returns pro-forma
-3.0% appreciation · 1.1% rent growth · sell at horizon
- IRR
- -16.1%
- Equity multiple
- 0.44×
- Total profit
- $-35,371
- Equity at exit
- $33,548
- IRR
- -11.5%
- Equity multiple
- 0.37×
- Total profit
- $-39,757
- Equity at exit
- $19,454
Cash invested: $63,000 (down + closing). Projections, not guarantees.
Landlord ↔ Tenant lean methodology
- Overall (STATE)
- 87 Strongly Landlord-Friendly
- State Texas
- 87 Strongly Landlord-Friendly · R+5
- County
- — inherits STATE
- City
- — inherits STATE
ZIP-level market 76048
- Home prices YoY
- -23.4%
- Rents YoY
- 1.1%
- Active inventory
- 930
- Price-to-rent
- 8.9×
Monthly cashflow live
- Estimated rent
- $2,100 high interval (Pro) →
- Mortgage (P&I)
- −$1,180
- Tax est. 1.5%
- −$281 /mo · $3,375/yr
- Insurance
- −$94
- HOA
- −$26
- Vacancy / Maint / Mgmt
- −$441
- Net cashflow
- $78
Break-even live
Sensitivity live
| Price | -10% $234 | -5% $156 | +0% $78 | +5% $0 | +10% $-77 |
|---|---|---|---|---|---|
| Rent | -10% $-88 | -5% $-5 | +0% $78 | +5% $161 | +10% $244 |
| Rate | -1.0pp $192 | -0.5pp $135 | base $78 | +0.5pp $20 | +1.0pp $-39 |
UW: 25.0% down · 7.5% · 30yr · 1.5% tax · 5.0% vac · 8.0% maint · 8.0% mgmt
Financing live
Cash to close
- Down payment
- $56,250
- Closing costs
- $6,750
- Reserves months
- —
- Total cash needed
- —
Loan-product check · same deal, 3 products live
Conventional
25% down · 7.5% · 30yr
- Down + closing
- —
- Monthly P&I
- —
- Monthly cashflow
- —
- DSCR
- —
- Eligible?
- —
Personal DTI + credit; lowest rate.
DSCR
20% down · 8.5% · 30yr
- Down + closing
- —
- Monthly P&I
- —
- Monthly cashflow
- —
- DSCR
- —
- Eligible?
- —
No personal income docs; deal must DSCR.
Hard money
10% down · 12.0% · 12mo
- Down + closing
- —
- Monthly P&I
- —
- Monthly cashflow
- —
- DSCR
- —
- Eligible?
- —
Short-term bridge; refi at stabilization.
Rent comps 15 comps
| Address | Beds | Baths | Sqft | Rent | $/sqft | DOM | Units | Dist |
|---|---|---|---|---|---|---|---|---|
| 5619 Cold Water Trl Granbury, TX | 3.0 | 2.5 | 1801 | $2,090 | $1.16 | 45d | 1 | 0.21mi |
| 5105 Waterbury Ct Granbury, TX | 4.0 | 2.0 | 1727 | $2,300 | $1.33 | 26d | 1 | 0.29mi |
| 5522 Firewood Trl Granbury, TX | 3.0 | 2.0 | 1437 | $2,400 | $1.67 | 45d | 1 | 0.33mi |
| 2500 Houston Dr Granbury, TX | 4.0 | 2.5 | 1770 | $2,400 | $1.36 | 6d | 1 | 0.35mi |
| 2524 Creek Dr Granbury, TX | 3.0 | 2.0 | 1620 | $2,150 | $1.33 | 4d | 1 | 0.36mi |
| 2524 Creek Dr Granbury, TX | 3.0 | 2.0 | 1620 | $2,150 | $1.33 | 0d | 1 | 0.36mi |
| 5621 San Jacinto Dr Granbury, TX | 3.0 | 2.0 | 1477 | $2,100 | $1.42 | 9d | 1 | 0.52mi |
| 5718 Barkridge Dr Granbury, TX | 3.0 | 2.0 | 1445 | $2,070 | $1.43 | 0d | 1 | 0.54mi |
| 2213 Beverly Dr Granbury, TX | 4.0 | 2.5 | 1850 | $2,300 | $1.24 | 26d | 1 | 0.71mi |
| 2414 Forest Hill Ln Granbury, TX | 3.0 | 2.0 | 1493 | $2,150 | $1.44 | 5d | 1 | 0.85mi |
| 2700 Steepleridge Cir Granbury, TX | 3.0 | 2.0 | 1438 | $1,895 | $1.32 | 9d | 1 | 0.86mi |
| 4710 Llano St Granbury, TX | 3.0 | 2.0 | 1456 | $1,775 | $1.22 | 45d | 1 | 0.90mi |
| 3705 Mandy Dr #2 Granbury, TX | 3.0 | 1.0 | 1158 | $1,400 | $1.21 | 26d | 1 | 1.22mi |
| 3712 Mandy Dr Unit 1 Granbury, TX | 3.0 | 1.0 | 1112 | $1,300 | $1.17 | 20d | 1 | 1.24mi |
| 3712 Mandy Dr Unit 2 Granbury, TX | 3.0 | 1.0 | 1158 | $1,300 | $1.12 | 24d | 1 | 1.24mi |
HOA detail
- Monthly dues
- $26 · $312/yr
- Likely covers
- poolsecurity
Listing history 8 events
-
2026-04-28status Pending
-
2026-04-13price $225,000
-
2026-04-07price $230,000
-
2026-02-18price $235,000
-
2025-12-17$240,000 Active
-
2025-07-08historical
-
2025-05-28$20,000 Active
-
2003-08-25soldstatus
ⓘ Source: listings_history table (triggers on properties + properties_extension) + one-shot
backfill from property_details.listing_events for pre-trigger history.
Climate risk First Street
- Flood 1/10 Low FEMA zone X (unshaded) · 0% chance over 30 yrs
- Wildfire 6/10 Major
- Heat 7/10 Severe 7 d/yr ≥108°F today · 23 d/yr by 30 yrs out
- Wind 6/10 Major 27% chance of damaging wind over 30 yrs
- Air quality 2/10 Low 1 unhealthy d/yr today · 2 by 30 yrs out
Nearby sold comps map
Loading sold comps map…
Walkable amenities ~0.75 mi
Loading nearby amenities…
Taxation est. · year 1
- Rental income
- $25,202
- − Mortgage interest
- −$12,603
- − Property taxes
- −$3,375
- − Insurance
- −$1,125
- − Repairs & maintenance
- −$2,016
- − Management
- −$2,016
- − HOA
- −$312
- − Depreciation
- −$6,545
- Taxable loss
- −$2,791
- Est. tax savings @ 24.0%
- +$670
- After-tax cash flow
- $1,608/yr
For passive investors: Depreciation is non-cash, so a rental often shows a tax loss while cash-flowing — sheltering income. Rental losses are passive: they offset passive income freely, and up to $25,000/yr can offset ordinary (W-2) income if you actively participate and your MAGI is under $100k (phasing out to $0 by $150k); unused losses carry forward. On sale, claimed depreciation is recaptured at up to 25%, and gains may owe capital-gains tax (a 1031 exchange can defer both). Figures are a year-1 estimate at your 24.0% rate — not tax advice; consult a CPA.
Schools (NCES district)
- District
- Granbury ISD
- NCES district ID
- 4821390
- Math proficiency
- 46% ▬ 0.00%
- Reading proficiency
- 46% ▲ 4.00%
- Median HH income
- $55,856
- Composite
- 40.04/100
- National rank
- #3820
- State rank
- #237 of 826 in TX
Livability — Canyon Creek
- Score
- 60/100
- State rank
- #1102
- US rank
- #19485
Category grades
Schools grade is shown separately in the Schools card above.
Census & demographics
- Census place
- Canyon Creek, TX
- County
- Hood County · 58,506 people
- Metro
- Granbury, TX
- Population (ZIP)
- 27,000
- Household income
- $70,346
- Rent vs Own
- Severe rent burden
- 612.0
Population outlook (Hood County) Hauer SSP2
- Today (2025)
- 63,502 people
- By 2030
- 67,459 · +6.2%
- By 2040
- 74,958 · +18.0%
- By 2050
- 81,922 · +29.0%
- By 2075
- 98,872 · +55.7%
- By 2100
- 107,796 · +69.8%
Race, ethnicity, and origin ACS 2023
- Neighborhood character
- Predominantly White (80%)
- Race & ethnicity
- White 80% Hispanic / Latino 14% Two or more races 11% Black 1%
- Hispanic origin (detail)
- Mexican 13%
- Common ancestry
- Italian 2% Slovak 2% Portuguese 1%
- Foreign-born
- 4% · Canada
- Languages at home
- 89% English-only · Spanish 10%
Political lean MEDSL · Hood
- 2024 margin
- Solid R (+66.0) · D 16.6% · R 82.6%
- 2008→2024 swing
- -11.9pp toward R · 2008: -54.0pp · 2024: -66.0pp
- All cycles
- 2024: R+66.0 2020: R+64.1 2016: R+66.5 2012: R+64.7 2008: R+54.0
Not yet ingested
- Civics
- —
Market trends
- HPI YoY
- ▼ -83.25%
- Current HPI
- 272.2126
- Rent YoY
- ▲ 1.10%
- Metro
- Granbury, TX
- State GDP YoY
- ▲ 3.95%
- F500 in state
- 110
Industry mix (Fortune 500 HQ in TX)
| Industry | F500 HQs | Revenue |
|---|---|---|
| Energy | 16 | $1,198B |
|
||
| Technology | 5 | $198B |
|
||
| Engineering / Construction | 4 | $72B |
|
||
| Energy Services | 3 | $60B |
|
||
| Utilities | 3 | $41B |
|
||
| Healthcare | 2 | $330B |
|
||
Price history
+1025.0% since first listed8 events — show timeline
- 2026-04-28 Pending — NTREIS
- 2026-04-13 Price Changed $225,000 NTREIS
- 2026-04-07 Price Changed $230,000 NTREIS
- 2026-02-18 Price Changed $235,000 NTREIS
- 2025-12-17 Listed $240,000 NTREIS
- 2025-07-08 Listing Removed — NTREIS
- 2025-05-28 Listed $20,000 NTREIS
- 2003-08-25 Sold (Public Records) — Public Records
Property tax history
+13.9%/yrLatest (2025): $237 · +0.8% YoY. Source: county tax records.
Cash-flow waterfall
monthlySold comps — $/sqft
last 12 mo · ≤1 miLoading sold comps…