20111 Beechview Ln · Houston, TX
Flood risk 6/10 · Moderate
- FEMA flood zone
- X (unshaded)
- Chance of flooding over 30 yrs
- 0.95%
- Est. flood insurance / yr
- $507 – $1,088
Fire risk 1/10 · Minimal
- Est. fire insurance / yr
- $1,222 – $2,270
Heat risk 9/10 · Severe
- Hot days now (above 110°F)
- 7 days/yr
- Hot days in 30 yrs
- 21 days/yr
Wind risk 8/10 · Major
- Chance of severe wind over 30 yrs
- 99.0%
Air-quality risk 2/10 · Minimal
- Unhealthy air days now
- 2 days/yr
- Unhealthy air days in 30 yrs
- 2 days/yr
Risk factors via First Street. Map © Google.
Why this score? — see what drove the D grade
The composite is a weighted blend of 9 inputs, each scored 0–100. Each bar is that input's sub-score; the figure is the points it added to the 100-point composite (weight × sub-score).
- ARV discount +9.5/15.0
- Cash flow +7.8/30.0
- Schools +5.7/10.0
- Appreciation +4.4/10.0
- Livability +3.7/5.0
- 1% rule +3.3/10.0
- Condition / age +2.5/5.0
- DSCR +1.9/10.0
- Rent growth +1.8/5.0
$229,995
🖨 Deal sheet 📄 Offer letter ✓ Due diligence
Listing remarks MLS
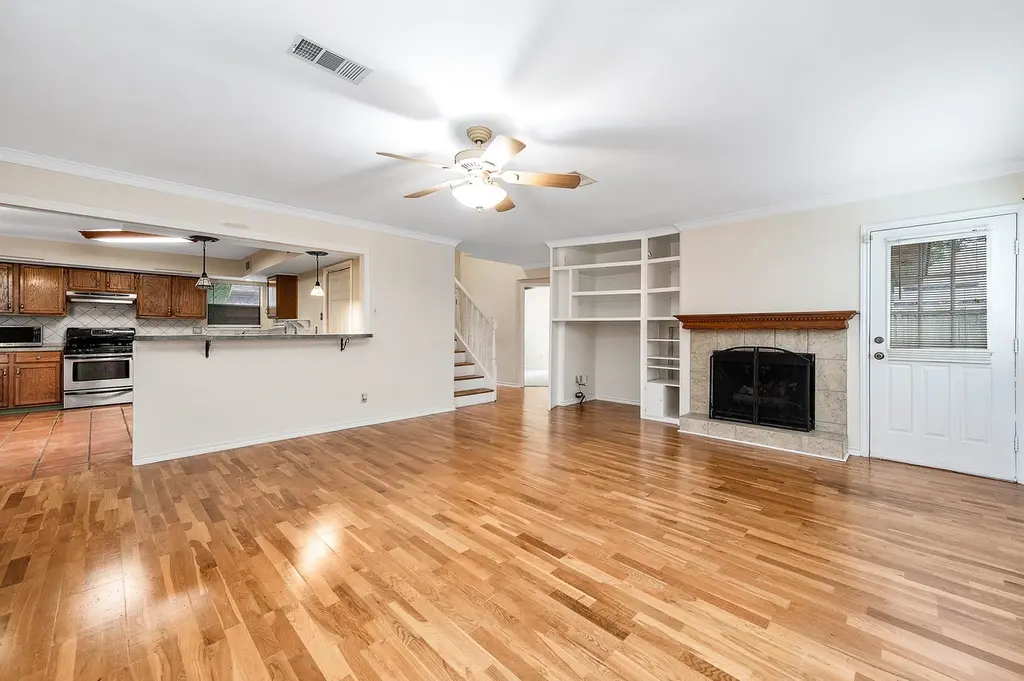
Welcome home to this well-maintained property in Westgreen! Ideal for a , this home offers versatile living spaces, a spacious kitchen, and updated bathrooms. Enjoy entertaining in the generous indoor and outdoor areas, with built-ins and plenty of storage throughout. Relax on the private deck, perfect for morning coffee or evening wine. Washer, dryer, and refrigerator included. This Single-Family home boasts 3 bedrooms, 2 bathrooms, 1654 sq ft, and was built in 1983. Don't miss out on this opportunity to make this house your home!
Key facts
- 4,726 sq ft lot
- 2 garage spots
- Community pool
Neighborhood map
What this means for you Summary
Snapshot
- This is a 3-bed/2.0-bath single-family listed at $230k.
Deal economics
- At list price, monthly cash flow is $-255 ($-3k/yr) — negative.
- To cash-flow at today's rent, offer at most $185k (19.6% below list).
- To meet the 1% rule (rent ≥ 1% of price), the offer needs to be $192k (16.7% below list).
- Recommended offer: $185k (19.6% below list) — sets the bar for cash-flow.
- Cap rate 5.0% vs local median 3.2% in Houston — top-decile yield for the area; either an underpriced asset or a hidden risk that comps aren't pricing in. Stress-test before assuming the spread holds.
Location & tenants
- Location reads 74/100 on livability (#184 in TX, #4,771 nationally) — a middle-class / working-renter tenant base. Strengths: amenities A+, cost of living A+, housing A+; Watch: schools D, crime F.
- Katy ISD (suburban): math 61% / reading 63% proficiency, ranked #29 of 826 in TX (top 4%) — acceptable for families but not a draw, mixed tenant base, ~2y average lease.
- Market conditions: Rents soft (-2.9%/yr); 744 active listings in the ZIP; 40 comparable units currently listed for rent nearby; rentals leasing fast (median 13d on market — plan ~1-2 weeks tenant-placement turnaround); solid renter incomes; 29,883 units permitted in Harris County in 2024 (8,621 in 5+ unit buildings).
Forward outlook
- Local home prices are declining (-1.3%/yr); year-one equity from $2k of loan paydown is wiped out by about $3k of value loss. Plan a longer hold.
- Harris County population projected at +47% by 2050 — long-run rental-demand tailwind backs the buy-and-hold thesis.
Negotiation context
- It's been on market 41 days — a 3% lower offer ($223k) is reasonable based on typical stale-listing flexibility.
Risks & watch-outs
- Climate carrying-cost: major flood risk; severe wind risk, 99% chance of damaging wind over 30y; extreme-heat days projected 7→21/yr by 2055 (HVAC capex compounding) — expect insurance premiums to compound above CPI over the hold.
Questions for the listing agent
- What do current leases actually rent for vs. the listed asking? Can we see a recent rent roll and the last 12 months of T-12 income?
- It's been on market 41 days. Have you received any prior offers? Is the seller open to a 20% concession, seller financing, or rate buy-down credit?
- What does the HOA fee cover, when was the last increase, and are there any pending special assessments or reserve-fund shortfalls?
- Is there a deadline driving the sale (1031 exchange, divorce, estate, relocation)? That informs how much negotiation room exists.
- Schools are D-rated, which usually means shorter tenancies and higher turnover. Who's the typical renter profile here, and what's been the actual vacancy rate?
- Crime grade is F in this area — have there been break-ins, vandalism, or insurance claims at this property in the last 3 years? What carrier currently insures it and at what premium?
- The area grade is low — what's the realistic commute time and amenity access for the typical tenant pool here? Any planned neighborhood developments (good or bad) we should know about?
- What's the average days-on-market for RENTAL listings here right now (not sales)? A rising rental-DOM trend means longer vacancies and softer asking-rent achievability than the comps imply.
- What's the recent tenant-quality profile in this submarket — average credit score on applications, eviction rate, late-payment / NSF rate, and stable-employment percentage? A property-management company in the area should have these aggregated.
- How much new for-sale + rental construction is in the pipeline within 1–3 miles? Heavy new supply typically softens prices + rents 12–24 months out; constrained supply supports both.
Investment metrics
- 1% rule
- 0.83% ✗
- Cap rate
- 4.96%
- Cash-on-cash
- -4.76%
- DSCR
- 0.79
- GRM
- 10.0
CMA / ARV
- ARV (median comp)
- $240,416
- List price
- $229,995
- Delta
- -4.33%
- Verdict
- FAIR
- Comps
- 20 within 1.0 mi
Show comp detail 12 sales within ~0.75 mi
| Address | Dist | Beds/Ba | Sqft | Sold | Price | $/sf | Match |
|---|---|---|---|---|---|---|---|
| 20111 Beechview Ln | 0.00mi | 3/2.0 | 1,654 (0%) | 1mo | $229,995 | $139 | 99 |
| 20066 Moonflower Ln | 0.15mi | 3/2.0 | 1,704 (+3%) | 2mo | $225,000 | $132 | 86 |
| 20058 Little Big Horn Dr | 0.23mi | 4/2.5 (+1) | 1,724 (+4%) | 4mo | $279,900 | $162 | 72 |
| 20055 Fort Stanton Dr | 0.37mi | 3/2.0 | 1,567 (-5%) | 4mo | $250,000 | $160 | 71 |
| 1823 Strongs Ct | 0.60mi | 3/2.0 | 1,666 (+1%) | 0mo | $285,000 | $171 | 70 |
| 20319 S Sabinal Dr | 0.59mi | 3/2.5 | 1,678 (+2%) | 6mo | $260,000 | $155 | 63 |
| 20426 Blue Juniper Dr | 0.55mi | 3/2.5 | 1,762 (+6%) | 4mo | $255,000 | $145 | 58 |
| 19718 Mission Mill Ln | 0.67mi | 3/2.0 | 1,769 (+7%) | 1mo | $256,900 | $145 | 56 |
| 2606 Sunbird Drive Dr | 0.67mi | 3/2.0 | 1,527 (-8%) | 1mo | $235,000 | $154 | 55 |
| 20115 Golden Mesa Dr | 0.66mi | 3/2.0 | 1,490 (-10%) | 2mo | $225,000 | $151 | 51 |
| 20503 Blue Beech Dr | 0.69mi | 3/2.0 | 1,470 (-11%) | 1mo | $249,900 | $170 | 49 |
| 20119 Golden Mesa Dr | 0.65mi | 3/2.5 | 1,834 (+11%) | 6mo | $261,500 | $143 | 44 |
Match score weights: distance 35% · size 25% · config 20% · recency 20%. Top-matched comps best support the ARV.
Projected returns pro-forma
-1.27% appreciation · 0.0% rent growth · sell at horizon
- IRR
- -16.0%
- Equity multiple
- 0.35×
- Total profit
- $-41,861
- Equity at exit
- $52,543
- IRR
- -12.7%
- Equity multiple
- 0.03×
- Total profit
- $-62,650
- Equity at exit
- $52,677
Cash invested: $64,399 (down + closing). Projections, not guarantees.
Landlord ↔ Tenant lean methodology
- Overall (STATE)
- 87 Strongly Landlord-Friendly
- State Texas
- 87 Strongly Landlord-Friendly · R+5
- County
- — inherits STATE
- City
- — inherits STATE
ZIP-level market 77449
- Home prices YoY
- -0.5%
- Rents YoY
- -2.9%
- Active inventory
- 744
- Price-to-rent
- 10.0×
Monthly cashflow live
- Estimated rent
- $1,916 high interval (Pro) →
- Mortgage (P&I)
- −$1,206
- Tax from tax record
- −$415 /mo · $4,981/yr
- Insurance
- −$96
- HOA
- −$52
- Vacancy / Maint / Mgmt
- −$402
- Net cashflow
- $-255
Break-even live
UW: 25.0% down · 7.5% · 30yr · 1.5% tax · 5.0% vac · 8.0% maint · 8.0% mgmt
Financing live
Cash to close
- Down payment
- $57,499
- Closing costs
- $6,900
- Reserves months
- —
- Total cash needed
- —
Loan-product check · same deal, 3 products live
Conventional
25% down · 7.5% · 30yr
- Down + closing
- —
- Monthly P&I
- —
- Monthly cashflow
- —
- DSCR
- —
- Eligible?
- —
Personal DTI + credit; lowest rate.
DSCR
20% down · 8.5% · 30yr
- Down + closing
- —
- Monthly P&I
- —
- Monthly cashflow
- —
- DSCR
- —
- Eligible?
- —
No personal income docs; deal must DSCR.
Hard money
10% down · 12.0% · 12mo
- Down + closing
- —
- Monthly P&I
- —
- Monthly cashflow
- —
- DSCR
- —
- Eligible?
- —
Short-term bridge; refi at stabilization.
Rent comps 40 comps
| Address | Beds | Baths | Sqft | Rent | $/sqft | DOM | Units | Dist |
|---|---|---|---|---|---|---|---|---|
| 2203 Wheathall Camp Ln Katy, TX | 3.0 | 2.0 | 1393 | $1,745 | $1.25 | 43d | 1 | 0.26mi |
| 20000 Saums Rd Katy, TX | 1.0–3.0 | 1.0–2.0 | 841 | $1,839 | $2.19 | 1d | 22 | 0.29mi |
| 2000 Westborough Dr Katy, TX | 1.0–3.0 | 1.0–2.0 | 1025 | $1,857 | $1.81 | 2d | 16 | 0.44mi |
| 20070 N Navaho Trl Katy, TX | 3.0 | 2.0 | 1372 | $1,695 | $1.24 | 21d | 1 | 0.47mi |
| 2603 N Fry Rd Katy, TX | 3.0 | 1.0–2.0 | 954 | $2,213 | $2.32 | 1d | 39 | 0.57mi |
| 2014 N Fry Rd Katy, TX | 2.0 | 2.0 | 1129 | $1,265 | $1.12 | 43d | 1 | 0.66mi |
| 2919 Amber Cliff Dr Katy, TX | 3.0 | 2.0 | 1526 | $1,900 | $1.25 | 43d | 1 | 0.68mi |
| 20104 Park Row Blvd Katy, TX | 3.0 | 2.0 | 1234 | $1,309 | $1.06 | 43d | 1 | 0.69mi |
| 1550 Westborough Dr Unit DW5 Katy, TX | 3.0 | 2.0 | 1670 | $1,850 | $1.11 | 2d | 1 | 0.78mi |
| 1550 Westborough Dr Unit 2112 Katy, TX | 2.0 | 2.0 | 1078 | $1,376 | $1.28 | 2d | 1 | 0.78mi |
| 1550 Westborough Dr Unit DW4 Katy, TX | 2.0 | 2.0 | 1235 | $1,639 | $1.33 | 5d | 1 | 0.78mi |
| 1550 Westborough Dr Unit 1583 Katy, TX | 3.0 | 2.0 | 1670 | $1,974 | $1.18 | 43d | 1 | 0.78mi |
| 1550 Westborough Dr Unit 3174 Katy, TX | 3.0 | 2.0 | 1670 | $1,963 | $1.18 | 10d | 1 | 0.78mi |
| 1550 Westborough Dr Unit 1607 Katy, TX | 2.0 | 2.0 | 1078 | $1,409 | $1.31 | 43d | 1 | 0.78mi |
| 1550 Westborough Dr Unit 3112 Katy, TX | 3.0 | 2.0 | 1670 | $1,931 | $1.16 | 2d | 1 | 0.78mi |
| 1550 Westborough Dr Unit 424 Katy, TX | 2.0 | 2.0 | 1078 | $1,384 | $1.28 | 5d | 1 | 0.78mi |
| 1550 Westborough Dr Unit 1587 Katy, TX | 2.0 | 2.0 | 1078 | $1,408 | $1.31 | 10d | 1 | 0.78mi |
| 1550 Westborough Dr Unit 2047 Katy, TX | 2.0 | 2.0 | 1078 | $1,419 | $1.32 | 10d | 1 | 0.78mi |
| 2503 Silver Trumpet Dr Katy, TX | 3.0 | 2.0 | 1388 | $1,791 | $1.29 | 11d | 1 | 0.78mi |
| 20102 Twilight Canyon Rd Katy, TX | 4.0 | 2.5 | 1633 | $3,395 | $2.08 | 2d | 1 | 0.79mi |
| 1562 N Westgreen Blvd Katy, TX | 3.0 | 2.0 | 1670 | $1,850 | $1.11 | 43d | 1 | 0.81mi |
| 19638 Southaven Dr Houston, TX | 3.0 | 2.0 | 1684 | $1,769 | $1.05 | 16d | 1 | 0.82mi |
| 1550 Westborough Dr Katy, TX | 3.0 | 2.0 | 1670 | $1,850 | $1.11 | 43d | 1 | 0.85mi |
| 2622 Broomsedge Dr Houston, TX | 3.0 | 2.0 | 1746 | $1,050 | $0.60 | 5d | 1 | 0.99mi |
| 1501 Foxlake Dr Houston, TX | 2.0 | 2.0 | 1181 | $1,653 | $1.40 | 24d | 1 | 1.04mi |
| 2607 Cypressvine Dr Houston, TX | 3.0 | 2.0 | 1527 | $2,000 | $1.31 | 19d | 1 | 1.12mi |
| 3130 Birchleaf Dr Katy, TX | 3.0 | 2.0 | 1700 | $1,840 | $1.08 | 43d | 1 | 1.13mi |
| 2606 Olster Dr Houston, TX | 3.0 | 2.0 | 1527 | $1,571 | $1.03 | 5d | 1 | 1.19mi |
| 2411 Shady Brook Dr Houston, TX | 3.0 | 2.0 | 1715 | $1,916 | $1.12 | 5d | 1 | 1.19mi |
| 333 Dominion Dr Katy, TX | 1.0–3.0 | 1.0–2.0 | 1043 | $1,969 | $1.89 | 43d | 1 | 1.22mi |
| 1550 Foxlake Dr Unit 424 Houston, TX | 2.0 | 2.0 | 1122 | $1,806 | $1.61 | 5d | 1 | 1.24mi |
| 1550 Foxlake Dr Unit 1587 Houston, TX | 2.0 | 2.0 | 1122 | $1,798 | $1.60 | 2d | 1 | 1.24mi |
| 1550 Foxlake Dr Unit 1583 Houston, TX | 3.0 | 2.0 | 1426 | $2,428 | $1.70 | 2d | 1 | 1.24mi |
| 21402 Doral Rose Ln Katy, TX | 3.0 | 2.0 | 1864 | $1,950 | $1.05 | 24d | 1 | 1.25mi |
| 1710 Blindlake Dr Houston, TX | 3.0 | 2.0 | 1406 | $1,750 | $1.24 | 44d | 1 | 1.28mi |
| 21455 Merchants Way Katy, TX | 3.0 | 2.5 | 1405 | $2,137 | $1.52 | 43d | 1 | 1.35mi |
| 21622 Stonecross Terrace Ln Katy, TX | 3.0 | 2.0 | 1778 | $2,050 | $1.15 | 24d | 1 | 1.36mi |
| 510 Westgreen Blvd Unit 547 Katy, TX | 2.0 | 2.0 | 1250 | $1,753 | $1.40 | 43d | 1 | 1.37mi |
| 510 Westgreen Blvd Unit 424 Katy, TX | 2.0 | 2.0 | 1108 | $1,575 | $1.42 | 5d | 1 | 1.37mi |
| 510 Westgreen Blvd Unit 533 Katy, TX | 2.0 | 2.0 | 1250 | $1,753 | $1.40 | 12d | 1 | 1.37mi |
HOA detail
- Monthly dues
- $52 · $624/yr
Listing history 3 events
-
2026-04-18$229,995 Active 537-char remark
Show marketing remark (537 chars)
Welcome home to this well-maintained property in Westgreen! Ideal for a , this home offers versatile living spaces, a spacious kitchen, and updated bathrooms. Enjoy entertaining in the generous indoor and outdoor areas, with built-ins and plenty of storage throughout. Relax on the private deck, perfect for morning coffee or evening wine. Washer, dryer, and refrigerator included. This Single-Family home boasts 3 bedrooms, 2 bathrooms, 1654 sq ft, and was built in 1983. Don't miss out on this opportunity to make this house your home!
-
2007-05-18soldstatus
-
1988-08-04soldstatus
ⓘ Source: listings_history table (triggers on properties + properties_extension) + one-shot
backfill from property_details.listing_events for pre-trigger history.
Tax reassessment forecast TX · Resets to sale price
- Current annual tax
- $4,981 · $415/mo
- Projected year-2 tax
- $4,981 · $415/mo
- Expected delta
- $0/yr ($0/mo · 0.0%)
ⓘ Screening estimate from a state-policy table — verify with the county assessor before closing.
Climate risk First Street
- Flood 6/10 Major FEMA zone X (unshaded) · 95% chance over 30 yrs
- Wildfire 1/10 Low
- Heat 9/10 Extreme 7 d/yr ≥110°F today · 21 d/yr by 30 yrs out
- Wind 8/10 Severe 99% chance of damaging wind over 30 yrs
- Air quality 2/10 Low 2 unhealthy d/yr today · 2 by 30 yrs out
Nearby sold comps map
Loading sold comps map…
Walkable amenities ~0.75 mi
Loading nearby amenities…
Taxation est. · year 1
- Rental income
- $22,991
- − Mortgage interest
- −$12,883
- − Property taxes
- −$4,981
- − Insurance
- −$1,150
- − Repairs & maintenance
- −$1,839
- − Management
- −$1,839
- − HOA
- −$624
- − Depreciation
- −$6,691
- Taxable loss
- −$7,017
- Est. tax savings @ 24.0%
- +$1,684
- After-tax cash flow
- $-1,382/yr
For passive investors: Depreciation is non-cash, so a rental often shows a tax loss while cash-flowing — sheltering income. Rental losses are passive: they offset passive income freely, and up to $25,000/yr can offset ordinary (W-2) income if you actively participate and your MAGI is under $100k (phasing out to $0 by $150k); unused losses carry forward. On sale, claimed depreciation is recaptured at up to 25%, and gains may owe capital-gains tax (a 1031 exchange can defer both). Figures are a year-1 estimate at your 24.0% rate — not tax advice; consult a CPA.
Schools (NCES district)
- District
- Katy ISD
- NCES district ID
- 4825170
- Math proficiency
- 61% ▼ -7.00%
- Reading proficiency
- 63% ▼ -3.00%
- Median HH income
- $90,312
- Composite
- 56.59/100
- National rank
- #1146
- State rank
- #29 of 826 in TX
Livability — Houston
- Score
- 74/100
- State rank
- #184
- US rank
- #4771
Category grades
Schools grade is shown separately in the Schools card above.
Census & demographics
- County
- Harris County · 4,702,590 people
- City population
- 3,226,434
- Metro
- Houston-The Woodlands-Sugar Land, TX
- Population (ZIP)
- 130,028
- Household income
- $87,808
- Rent vs Own
- Severe rent burden
- 3088.0
Population outlook (Harris County) Hauer SSP2
- Today (2025)
- 5,571,493 people
- By 2030
- 6,089,821 · +9.3%
- By 2040
- 7,142,806 · +28.2%
- By 2050
- 8,185,864 · +46.9%
- By 2075
- 10,574,329 · +89.8%
- By 2100
- 12,109,958 · +117.4%
Race, ethnicity, and origin ACS 2023
- Neighborhood character
- Diverse neighborhood (Simpson 0.68)
- Race & ethnicity
- Hispanic / Latino 49% Two or more races 22% Black 20% White 19% Asian 6%
- Hispanic origin (detail)
- Mexican 26% Puerto Rican 1% Cuban 4%
- Common ancestry
- Lithuanian 1% Italian 1%
- Foreign-born
- 32% · Canada, Jamaica, Vietnam
- Languages at home
- 48% English-only · Spanish 40% Other Indo-European 3% Vietnamese 1%
Political lean MEDSL · Harris
- 2024 margin
- Lean D (+5.5) · D 52.0% · R 46.4% · Other 1.6%
- 2008→2024 swing
- +3.9pp toward D · 2008: 1.6pp · 2024: 5.5pp
- All cycles
- 2024: D+5.5 2020: D+13.3 2016: D+12.4 2012: D+0.1 2008: D+1.6
Not yet ingested
- Civics
- —
Market trends
- HPI YoY
- ▼ -1.27%
- Current HPI
- 254.6622
- Rent YoY
- ▼ -2.86%
- Metro
- Houston-The Woodlands-Sugar Land, TX
- State GDP YoY
- ▲ 3.95%
- F500 in state
- 110
Industry mix (Fortune 500 HQ in TX)
| Industry | F500 HQs | Revenue |
|---|---|---|
| Energy | 16 | $1,198B |
|
||
| Technology | 5 | $198B |
|
||
| Engineering / Construction | 4 | $72B |
|
||
| Energy Services | 3 | $60B |
|
||
| Utilities | 3 | $41B |
|
||
| Healthcare | 2 | $330B |
|
||
Price history
3 events — show timeline
- 2026-04-18 Listed $229,995 HARMLS
- 2007-05-18 Sold (Public Records) — Public Records
- 1988-08-04 Sold (Public Records) — Public Records
Property tax history
+7.5%/yrLatest (2025): $4,981 · +11.0% YoY. Source: county tax records.
Cash-flow waterfall
monthlySold comps — $/sqft
last 12 mo · ≤1 miLoading sold comps…