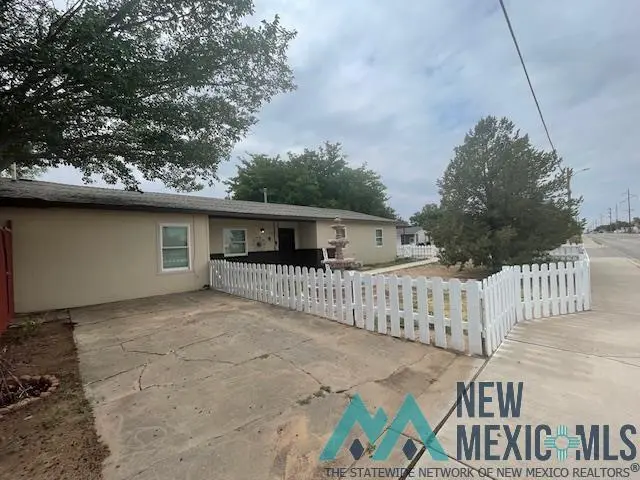
1301 W Briscoe Ave · Artesia, NM
Flood risk 3/10 · Minor
- FEMA flood zone
- AO
- Chance of flooding over 30 yrs
- 0.2%
- Est. flood insurance / yr
- $848 – $2,087
Fire risk 6/10 · Moderate
- Est. fire insurance / yr
- $706 – $1,312
Heat risk 6/10 · Moderate
- Hot days now (above 101°F)
- 5 days/yr
- Hot days in 30 yrs
- 15 days/yr
Wind risk 2/10 · Minimal
- Chance of severe wind over 30 yrs
- —
Air-quality risk 2/10 · Minimal
- Unhealthy air days now
- 1 days/yr
- Unhealthy air days in 30 yrs
- 1 days/yr
Risk factors via First Street. Map © Google.
Why this score? — see what drove the C+ grade
The composite is a weighted blend of 9 inputs, each scored 0–100. Each bar is that input's sub-score; the figure is the points it added to the 100-point composite (weight × sub-score).
- Cash flow +27.6/30.0
- DSCR +9.7/10.0
- ARV discount +7.5/15.0
- 1% rule +6.6/10.0
- Schools +3.3/10.0
- Livability +3.2/5.0
- Rent growth +2.5/5.0
- Condition / age +2.5/5.0
- Appreciation +0.0/10.0
$315,000
🖨 Deal sheet (PDF) 📄 Offer letter ✓ Due diligence
Listing remarks MLS
Experience elegance in this newly remodeled 4 bedroom home, perfectly situated on a desirable corner lot. Highlighted by quartz countertops, the kitchen shines with stainless steel appliances and modern cabinetry. Natural light enhances the fresh paint and new flooring throughout, creating a bright and inviting atmosphere. Each bathroom showcases updated fixtures and finishes for a luxurious feel. Enjoy the extra space offered by the corner location, ideal for outdoor activities. With a new HVAC system, this home ensures year-round comfort.
Key facts
- Modern cabinetry
- Granite counters
- Updated fixtures
Tags
Property features AI
Exterior
- Parking: 2 total parking spaces; 2 covered spaces; 2-car garage; Detached carport
- Utilities: Public water; Sewer connected; Electricity connected; Natural gas connected; Natural gas available
- Home design: One-story residential home; Frame, stucco, and brick construction; Slab foundation
- Construction: Built with frame, stucco and brick; Shingle roof; Slab foundation
- Exterior features: Fenced front and back yard; Shingle roof
Interior
- Kitchen: Microwave; Gas water heater; Water softener
- Flooring: Carpet; Laminate; Wood
- Bathrooms: 2 full bathrooms
- Heating & cooling: Natural gas heating; Heat pump; Central air; Electric cooling; Ceiling fans
- Interior features: Ceiling fans; Walk-in closets
Neighborhood map
What this means for you Summary
Snapshot
- This is a 4-bed/2.0-bath single-family listed at $315k.
Deal economics
- At list price, monthly cash flow is $814 ($10k/yr) — positive.
- The deal already cash-flows at list — no discount required.
- Meets the 1% rule at list price ($4k rent vs $315k).
Location & tenants
- Location reads 63/100 on livability (#75 in NM) — a middle-class / working-renter tenant base. Strengths: cost of living A+, housing A+; Watch: employment C-, health & safety C-, crime F.
- Artesia Public Schools (town): math 29% / reading 42% proficiency, ranked #17 of 95 in NM (top 18%) — families likely to look elsewhere, expect single-tenant / working-renter base with shorter leases.
- Zoned schools: Artesia Zia Intermediate (546 students, 50% FRL); Artesia High (math 44% / reading 74%, grade C+, #27 of 110 statewide, top 28%, 766 students, 40% FRL) — zoned schools at 45% FRL track the district average.
- Zoned-school proficiency averages 60% at this address vs 36% district-wide (+24 pts) — the actual schools serving this property are materially stronger than the Artesia Public Schools average implies; a family-tenant draw the district grade alone would hide.
- Market conditions: 166 active listings in the ZIP; 2 comparable units currently listed for rent nearby; solid renter incomes; 156 units permitted in Eddy County in 2024 (0 in 5+ unit buildings).
- At $3,650/mo this rent would consume 55% of the median local household income ($80k/yr) (locally 159% of renters already pay >50% of income on rent) — very limited rent-growth headroom before tenants either downsize or default.
Forward outlook
- Local home prices are declining (-3.0%/yr); year-one equity from $2k of loan paydown is wiped out by about $9k of value loss. Plan a longer hold.
- Eddy County population projected at +36% by 2050 — long-run rental-demand tailwind backs the buy-and-hold thesis.
- At projected returns (-3.0% appreciation + 3.0% rent growth), your $88k cash investment doubles in ~10 years — after that, you're playing with house money.
Negotiation context
- Only 1 days on market — expect competitive offers; lowballing is unlikely to land.
- 2 sale attempts since 2y ago with the ask held roughly flat each time — persistent listings suggest the price (not the market) is what's stuck; bring a comps-based counter.
Risks & watch-outs
- Watch-outs: flood insurance adds $122/mo.
- Climate carrying-cost: in FEMA flood zone AO (mandatory federal flood insurance); major wildfire risk; extreme-heat days projected 5→15/yr by 2055 (HVAC capex compounding) — expect insurance premiums to compound above CPI over the hold.
Questions for the listing agent
- Built in 1976 — when were the roof, HVAC, electrical panel, plumbing, and water heater last replaced?
- What's the actual annual flood-insurance premium (NFIP or private), and is the property in a SFHA with mandatory coverage?
- Is there a deadline driving the sale (1031 exchange, divorce, estate, relocation)? That informs how much negotiation room exists.
- Schools are F-rated, which usually means shorter tenancies and higher turnover. Who's the typical renter profile here, and what's been the actual vacancy rate?
- Crime grade is F in this area — have there been break-ins, vandalism, or insurance claims at this property in the last 3 years? What carrier currently insures it and at what premium?
- What's the average days-on-market for RENTAL listings here right now (not sales)? A rising rental-DOM trend means longer vacancies and softer asking-rent achievability than the comps imply.
- What's the recent tenant-quality profile in this submarket — average credit score on applications, eviction rate, late-payment / NSF rate, and stable-employment percentage? A property-management company in the area should have these aggregated.
- How much new for-sale + rental construction is in the pipeline within 1–3 miles? Heavy new supply typically softens prices + rents 12–24 months out; constrained supply supports both.
Investment metrics
- 1% rule
- 1.16% ✓
- Cap rate
- 9.86%
- Cash-on-cash
- 12.74%
- DSCR
- 1.57
- GRM
- 7.2
CMA / ARV
No comps found within radius.
Projected returns pro-forma
-3.0% appreciation · 3.0% rent growth · sell at horizon
- IRR
- 0.2%
- Equity multiple
- 1.01×
- Total profit
- $793
- Equity at exit
- $46,968
- IRR
- 9.9%
- Equity multiple
- 1.76×
- Total profit
- $67,409
- Equity at exit
- $27,235
Cash invested: $88,200 (down + closing). Projections, not guarantees.
Landlord ↔ Tenant lean methodology
- Overall (STATE)
- 55 Moderately Landlord-Leaning
- State New Mexico
- 55 Moderately Landlord-Leaning · D+3
- County
- — inherits STATE
- City
- — inherits STATE
ZIP-level market 88210
- Active inventory
- 166
- Price-to-rent
- 7.2×
Monthly cashflow live
- Estimated rent
- $3,650 medium interval (Pro) →
- Mortgage (P&I)
- −$1,652
- Tax from tax record
- −$164 /mo · $1,971/yr
- Insurance
- −$131
- Flood insurance flood zone
- −$122 /mo · $1,468/yr
- HOA
- −$0
- Vacancy / Maint / Mgmt
- −$767
- Net cashflow
- $814
Break-even live
Sensitivity live
| Price | -10% $992 | -5% $903 | +0% $814 | +5% $725 | +10% $636 |
|---|---|---|---|---|---|
| Rent | -10% $526 | -5% $670 | +0% $814 | +5% $958 | +10% $1,102 |
| Rate | -1.0pp $973 | -0.5pp $894 | base $814 | +0.5pp $732 | +1.0pp $649 |
UW: 25.0% down · 7.5% · 30yr · 1.5% tax · 5.0% vac · 8.0% maint · 8.0% mgmt
Financing live
Cash to close
- Down payment
- $78,750
- Closing costs
- $9,450
- Reserves months
- —
- Total cash needed
- —
Loan-product check · same deal, 3 products live
Conventional
25% down · 7.5% · 30yr
- Down + closing
- —
- Monthly P&I
- —
- Monthly cashflow
- —
- DSCR
- —
- Eligible?
- —
Personal DTI + credit; lowest rate.
DSCR
20% down · 8.5% · 30yr
- Down + closing
- —
- Monthly P&I
- —
- Monthly cashflow
- —
- DSCR
- —
- Eligible?
- —
No personal income docs; deal must DSCR.
Hard money
10% down · 12.0% · 12mo
- Down + closing
- —
- Monthly P&I
- —
- Monthly cashflow
- —
- DSCR
- —
- Eligible?
- —
Short-term bridge; refi at stabilization.
Rent comps 2 comps
| Address | Beds | Baths | Sqft | Rent | $/sqft | DOM | Units | Dist |
|---|---|---|---|---|---|---|---|---|
| 1402 W Briscoe Ave Artesia, NM | 3.0 | 2.0 | 1564 | $1,750 | $1.12 | 45d | 1 | 0.06mi |
| 2106 W Bullock Ave Artesia, NM | 3.0 | 2.0 | 1320 | $1,800 | $1.36 | 45d | 1 | 0.59mi |
Listing history 2 events
-
2026-06-18remarks 630-char remark
-
2026-06-18$315,000 Active 1 DOM
ⓘ Source: listings_history table (triggers on properties + properties_extension) + one-shot
backfill from property_details.listing_events for pre-trigger history.
Tax reassessment forecast NM · Resets to sale price
- Current annual tax
- $1,971 · $164/mo
- Projected year-2 tax
- $2,520 · $210/mo
- Expected delta
- +$549/yr (+$46/mo · 27.9%)
ⓘ Screening estimate from a state-policy table — verify with the county assessor before closing.
Climate risk First Street
- Flood 3/10 Moderate FEMA zone AO · 20% chance over 30 yrs
- Wildfire 6/10 Major
- Heat 6/10 Major 5 d/yr ≥101°F today · 15 d/yr by 30 yrs out
- Wind 2/10 Low
- Air quality 2/10 Low 1 unhealthy d/yr today · 1 by 30 yrs out
Nearby sold comps map
Loading sold comps map…
Walkable amenities ~0.75 mi
Loading nearby amenities…
Taxation est. · year 1
- Rental income
- $43,804
- − Mortgage interest
- −$17,645
- − Property taxes
- −$1,971
- − Insurance
- −$3,042
- − Repairs & maintenance
- −$3,504
- − Management
- −$3,504
- − Depreciation
- −$9,164
- Taxable income
- $4,973
- Est. tax owed @ 24.0%
- −$1,194
- After-tax cash flow
- $8,575/yr
For passive investors: Depreciation is non-cash, so a rental often shows a tax loss while cash-flowing — sheltering income. Rental losses are passive: they offset passive income freely, and up to $25,000/yr can offset ordinary (W-2) income if you actively participate and your MAGI is under $100k (phasing out to $0 by $150k); unused losses carry forward. On sale, claimed depreciation is recaptured at up to 25%, and gains may owe capital-gains tax (a 1031 exchange can defer both). Figures are a year-1 estimate at your 24.0% rate — not tax advice; consult a CPA.
Schools (NCES district)
- District
- Artesia Public Schools
- NCES district ID
- 3500120
- Math proficiency
- 29% —
- Reading proficiency
- 42% —
- Median HH income
- $51,397
- Composite
- 33.48/100
- National rank
- #10522
- State rank
- #17 of 95 in NM
Livability — Artesia
- Score
- 63/100
- State rank
- #75
- US rank
- #15300
Category grades
Schools grade is shown separately in the Schools card above.
Census & demographics
- Census place
- Artesia, NM
- County
- Eddy County · 58,370 people
- City population
- 18,542
- Metro
- Carlsbad-Artesia, NM
- Population (ZIP)
- 18,542
- Household income
- $79,632
- Rent vs Own
- Severe rent burden
- 159.0
Population outlook (Eddy County) Hauer SSP2
- Today (2025)
- 65,505 people
- By 2030
- 69,797 · +6.6%
- By 2040
- 79,191 · +20.9%
- By 2050
- 89,199 · +36.2%
- By 2075
- 115,829 · +76.8%
- By 2100
- 129,336 · +97.4%
Race, ethnicity, and origin ACS 2023
- Neighborhood character
- Majority Hispanic (55%)
- Race & ethnicity
- Hispanic / Latino 55% White 40% Two or more races 19% Native American 3%
- Hispanic origin (detail)
- Mexican 50%
- Common ancestry
- Italian 1% Romanian 1% Iranian 1%
- Foreign-born
- 6% · Canada, Jamaica
- Languages at home
- 74% English-only · Spanish 24%
Political lean MEDSL · Eddy
- 2024 margin
- Solid R (+55.9) · D 21.4% · R 77.3% · Other 1.3%
- 2008→2024 swing
- -30.2pp toward R · 2008: -25.6pp · 2024: -55.9pp
- All cycles
- 2024: R+55.9 2020: R+51.8 2016: R+41.6 2012: R+33.5 2008: R+25.6
Not yet ingested
- Civics
- —
Market trends
- HPI YoY
- ▼ -238.85%
- Current HPI
- 115.6107
- Rent YoY
- —
- Metro
- Carlsbad-Artesia, NM
- State GDP YoY
- —
- F500 in state
- 0
Price history
+18.9% since first listed5 events — show timeline
- 2026-06-16 Listed $315,000 NMMLS
- 2024-03-29 Sold (Public Records) — Public Records
- 2024-03-28 Sold (MLS) — SNMMLS as distributed by MLS GRID
- 2024-02-14 Pending — SNMMLS as distributed by MLS GRID
- 2024-02-12 Listed $265,000 SNMMLS as distributed by MLS GRID
Property tax history
+14.0%/yrLatest (2025): $1,971 · +64.7% YoY. Source: county tax records.
Cash-flow waterfall
monthlySold comps — $/sqft
last 12 mo · ≤1 miLoading sold comps…