 🏷️ Likely Rental
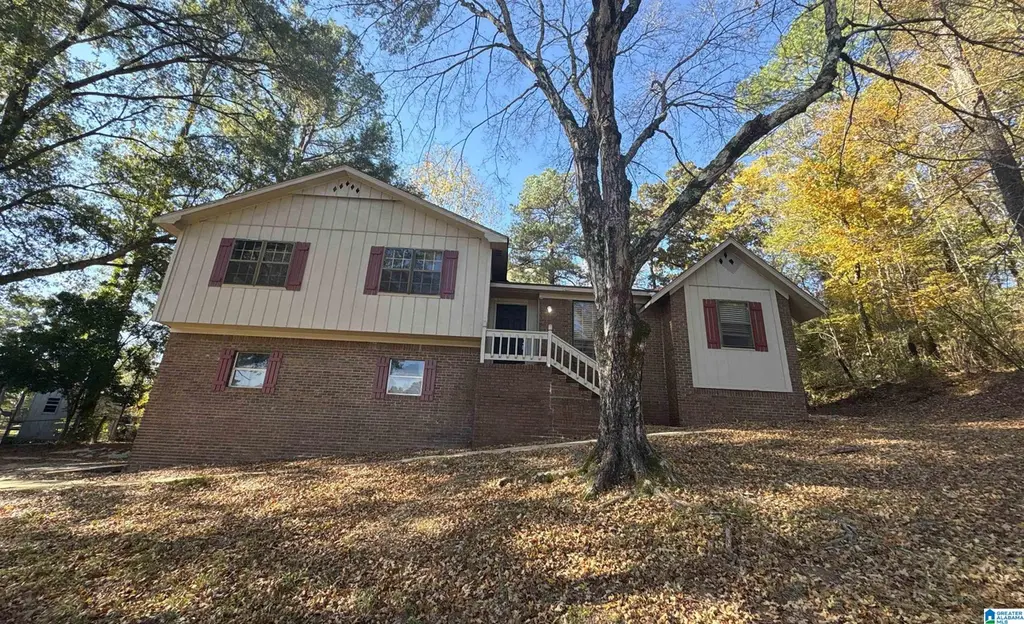
434 Hillside Rd · Bessemer, AL
Flood risk 1/10 · Minimal
- FEMA flood zone
- X (unshaded)
- Chance of flooding over 30 yrs
- 0.0%
- Est. flood insurance / yr
- $507 – $1,088
Fire risk 2/10 · Minimal
- Est. fire insurance / yr
- $916 – $1,700
Heat risk 6/10 · Moderate
- Hot days now (above 108°F)
- 7 days/yr
- Hot days in 30 yrs
- 19 days/yr
Wind risk 6/10 · Moderate
- Chance of severe wind over 30 yrs
- 48.0%
Air-quality risk 3/10 · Minor
- Unhealthy air days now
- 2 days/yr
- Unhealthy air days in 30 yrs
- 5 days/yr
Risk factors via First Street. Map © Google.
Why this score? — see what drove the D grade
The composite is a weighted blend of 9 inputs, each scored 0–100. Each bar is that input's sub-score; the figure is the points it added to the 100-point composite (weight × sub-score).
- ARV discount +15.0/15.0
- Cash flow +11.1/30.0
- 1% rule +3.5/10.0
- DSCR +3.2/10.0
- Livability +3.0/5.0
- Condition / age +2.5/5.0
- Rent growth +1.7/5.0
- Schools +0.8/10.0
- Appreciation +0.0/10.0
$149,500
🖨 Deal sheet (PDF) 📄 Offer letter ✓ Due diligence
Listing remarks
Great investment opportunity with a tenant in place paying $1400/mo through Feb 2027. 4 bed / 2/5 bath home. Finished basement area.
Key facts
- 0.35 acre lot
- Built 1974
- Listed 45 days
Property features AI
Finance
- Other: Parcel ID: 38-00-17-4-010-028.000
- Financial info: Annual fire fee ($50); Monthly garbage fee ($12)
Exterior
- Parking: Driveway parking
- Utilities: Public water; Septic system; Gas water heater; Internet service available
- Home design: Brick over foundation construction; Basement foundation; Existing/previously built home
- Construction: Brick-over-foundation exterior
- Exterior features: Open patio; No pool; No waterfront; No garden/yard features listed; No decks
Interior
- Kitchen: Laminate countertops
- Bedrooms: Primary bedroom on main level; Additional primary bedroom in basement; Multiple bedrooms on main level
- Flooring: Hardwood; Laminate
- Bathrooms: Two full bathrooms; One half bathroom; Tub/shower combo
- Heating & cooling: Central heating; Central cooling
- Interior features: Smooth ceilings; Other ceiling details (see remarks); One wood-burning fireplace with brick surround in the living room; Full finished daylight basement; Pull-down attic
- Laundry & utility: Laundry room in basement; Washer hookup; Electric dryer hookup
Neighborhood map
What this means for you Summary
Snapshot
- This is a 3-bed/2.5-bath single-family listed at $150k.
Deal economics
- At list price, monthly cash flow is $-60 ($-717/yr) — negative.
- To cash-flow at today's rent, offer at most $139k (7.1% below list).
- To meet the 1% rule (rent ≥ 1% of price), the offer needs to be $128k (14.6% below list).
- Recommended offer: $128k (14.6% below list) — sets the bar for 1% rule.
Location & tenants
- Location reads 59/100 on livability (#331 in AL) — a working-class tenant base; expect higher turnover. Strengths: commute A+, cost of living A+, housing A; Watch: crime F, amenities F, employment F.
- Bessemer City (suburban): math 3% / reading 19% proficiency, ranked #120 of 129 in AL (top 93%) — low school quality limits family demand, transient renter base, plan for 1-2y turnover; 87% free/reduced lunch — lower-income household profile, screen leases tightly.
- Zoned schools: Greenwood Elementary School (math 2% / reading 27%, grade F, #508 of 627 statewide, top 84%, 286 students, 77% FRL); Bessemer City Middle School (math 3% / reading 23%, grade F, #215 of 257 statewide, top 84%, 674 students, 88% FRL); Bessemer City High School (math 2% / reading 8%, grade F, #276 of 305 statewide, top 95%, 850 students, 61% FRL).
- Market conditions: Rents falling (-3.1%/yr); 116 active listings in the ZIP; 4 comparable units currently listed for rent nearby; rentals lingering (median 46d on market — plan ~5-8 weeks vacancy on turnover, expect pricing pressure); 50% of comp listings sitting > 30 days — soft ceiling on asking rent; lower-income renter base — watch delinquency; 2,114 units permitted in Jefferson County in 2024 (556 in 5+ unit buildings).
- This rent runs 43% of the median local income ($35k/yr) — at the standard rent-burdened threshold; future hikes will face affordability resistance.
Forward outlook
- Local home prices are declining (-3.0%/yr); year-one equity from $1k of loan paydown is wiped out by about $4k of value loss. Plan a longer hold.
- Jefferson County population projected to shrink 4% by 2050 — rents likely to lag national; underwrite the cash flow, not the appreciation.
Negotiation context
- It's been on market 45 days — a 3% lower offer ($145k) is reasonable based on typical stale-listing flexibility.
- 3 sale attempts since 3y ago with the ask held roughly flat each time — persistent listings suggest the price (not the market) is what's stuck; bring a comps-based counter.
- Current owner paid $84k; list at $150k implies a 78% gain — meaningful room to come down on a strong offer.
Risks & watch-outs
- Climate carrying-cost: major wind risk, 48% chance of damaging wind over 30y; extreme-heat days projected 7→19/yr by 2055 (HVAC capex compounding) — expect insurance premiums to compound above CPI over the hold.
Questions for the listing agent
- What do current leases actually rent for vs. the listed asking? Can we see a recent rent roll and the last 12 months of T-12 income?
- It's been on market 45 days. Have you received any prior offers? Is the seller open to a 15% concession, seller financing, or rate buy-down credit?
- Built in 1974 — when were the roof, HVAC, electrical panel, plumbing, and water heater last replaced?
- Is there a deadline driving the sale (1031 exchange, divorce, estate, relocation)? That informs how much negotiation room exists.
- Schools are D-rated, which usually means shorter tenancies and higher turnover. Who's the typical renter profile here, and what's been the actual vacancy rate?
- Crime grade is F in this area — have there been break-ins, vandalism, or insurance claims at this property in the last 3 years? What carrier currently insures it and at what premium?
- The area grade is low — what's the realistic commute time and amenity access for the typical tenant pool here? Any planned neighborhood developments (good or bad) we should know about?
- What's the average days-on-market for RENTAL listings here right now (not sales)? A rising rental-DOM trend means longer vacancies and softer asking-rent achievability than the comps imply.
- What's the recent tenant-quality profile in this submarket — average credit score on applications, eviction rate, late-payment / NSF rate, and stable-employment percentage? A property-management company in the area should have these aggregated.
- How much new for-sale + rental construction is in the pipeline within 1–3 miles? Heavy new supply typically softens prices + rents 12–24 months out; constrained supply supports both.
Investment metrics
- 1% rule
- 0.85% ✗
- Cap rate
- 5.81%
- Cash-on-cash
- -1.71%
- DSCR
- 0.92
- GRM
- 9.8
CMA / ARV
- ARV (median comp)
- $227,827
- List price
- $149,500
- Delta
- -34.38%
- Verdict
- UNDERPRICED
- Comps
- 20 within 1.0 mi
Show comp detail 11 sales within ~0.75 mi
| Address | Dist | Beds/Ba | Sqft | Sold | Price | $/sf | Match |
|---|---|---|---|---|---|---|---|
| 105 Woodland Rd | 0.27mi | 3/2.5 | 2,181 (-2%) | 10mo | $231,500 | $106 | 76 |
| 432 Oak St SW | 0.21mi | 3/1.0 | 2,262 (+2%) | 13mo | $147,000 | $65 | 71 |
| 445 Oak St | 0.17mi | 2/1.0 (-1) | 2,256 (+2%) | 10mo | $131,000 | $58 | 70 |
| 701 Rosemary Ln | 0.24mi | 4/3.0 (+1) | 2,390 (+8%) | 2mo | $245,000 | $103 | 68 |
| 109 Hillside Rd | 0.21mi | 4/2.0 (+1) | 2,008 (-10%) | 1mo | $169,000 | $84 | 66 |
| 822 S Montez Dr | 0.42mi | 3/3.0 | 2,413 (+9%) | 0mo | $240,000 | $99 | 64 |
| 726 Parker Rd | 0.35mi | 3/2.0 | 2,322 (+4%) | 15mo | $211,000 | $91 | 62 |
| 109 Waverly Cir | 0.23mi | 3/2.0 | 1,923 (-14%) | 6mo | $285,000 | $148 | 60 |
| 402 Memorial Dr | 0.69mi | 3/2.5 | 2,264 (+2%) | 8mo | $170,000 | $75 | 58 |
| 1055 Barclay Dr | 0.71mi | 3/2.0 | 2,233 (+0%) | 7mo | $255,000 | $114 | 58 |
| 1052 Gloria Dr | 0.72mi | 3/2.0 | 1,915 (-14%) | 19mo | $220,000 | $115 | 25 |
Match score weights: distance 35% · size 25% · config 20% · recency 20%. Top-matched comps best support the ARV.
Projected returns pro-forma
-3.0% appreciation · 0.0% rent growth · sell at horizon
- IRR
- -22.6%
- Equity multiple
- 0.24×
- Total profit
- $-31,729
- Equity at exit
- $22,291
- IRR
- -27.7%
- Equity multiple
- -0.12×
- Total profit
- $-46,816
- Equity at exit
- $12,926
Cash invested: $41,860 (down + closing). Projections, not guarantees.
Landlord ↔ Tenant lean methodology
- Overall (STATE)
- 90 Strongly Landlord-Friendly
- State Alabama
- 90 Strongly Landlord-Friendly · R+15
- County
- — inherits STATE
- City
- — inherits STATE
ZIP-level market 35020
- Home prices YoY
- -24.2%
- Rents YoY
- -3.1%
- Active inventory
- 116
- Price-to-rent
- 9.8×
Monthly cashflow live
- Estimated rent
- $1,276 medium interval (Pro) →
- Mortgage (P&I)
- −$784
- Tax from tax record
- −$222 /mo · $2,659/yr
- Insurance
- −$62
- HOA
- −$0
- Vacancy / Maint / Mgmt
- −$268
- Net cashflow
- $-60
Break-even live
Sensitivity live
| Price | -10% $25 | -5% $-17 | +0% $-60 | +5% $-102 | +10% $-144 |
|---|---|---|---|---|---|
| Rent | -10% $-161 | -5% $-110 | +0% $-60 | +5% $-9 | +10% $41 |
| Rate | -1.0pp $16 | -0.5pp $-22 | base $-60 | +0.5pp $-98 | +1.0pp $-138 |
UW: 25.0% down · 7.5% · 30yr · 1.5% tax · 5.0% vac · 8.0% maint · 8.0% mgmt
Financing live
Cash to close
- Down payment
- $37,375
- Closing costs
- $4,485
- Reserves months
- —
- Total cash needed
- —
Loan-product check · same deal, 3 products live
Conventional
25% down · 7.5% · 30yr
- Down + closing
- —
- Monthly P&I
- —
- Monthly cashflow
- —
- DSCR
- —
- Eligible?
- —
Personal DTI + credit; lowest rate.
DSCR
20% down · 8.5% · 30yr
- Down + closing
- —
- Monthly P&I
- —
- Monthly cashflow
- —
- DSCR
- —
- Eligible?
- —
No personal income docs; deal must DSCR.
Hard money
10% down · 12.0% · 12mo
- Down + closing
- —
- Monthly P&I
- —
- Monthly cashflow
- —
- DSCR
- —
- Eligible?
- —
Short-term bridge; refi at stabilization.
Rent comps 4 comps
| Address | Beds | Baths | Sqft | Rent | $/sqft | DOM | Units | Dist |
|---|---|---|---|---|---|---|---|---|
| 18 Center St Bessemer, AL | 3.0 | 1.0 | 1418 | $1,100 | $0.78 | 46d | 1 | 0.77mi |
| 200 Center St Bessemer, AL | 3.0 | 1.5 | 1826 | $1,200 | $0.66 | 12d | 1 | 0.89mi |
| 236 Clifton St Bessemer, AL | 3.0 | 1.0 | 1450 | $1,100 | $0.76 | 46d | 1 | 1.06mi |
| 434 Bryant St Bessemer, AL | 4.0 | 2.0 | 1540 | $1,523 | $0.99 | 5d | 1 | 1.30mi |
Listing history 26 events
-
2026-06-21days on market $149,500 Active 45 DOM
-
2026-06-18days on market $149,500 Active 42 DOM
-
2026-06-17days on market $149,500 Active 41 DOM
-
2026-06-16days on market $149,500 Active 40 DOM
-
2026-06-15days on market $149,500 Active 39 DOM
-
2026-06-13days on market $149,500 Active 37 DOM
-
2026-06-10days on market $149,500 Active 34 DOM
-
2026-06-09days on market $149,500 Active 33 DOM
-
2026-06-08days on market $149,500 Active 32 DOM
-
2026-06-07days on market $149,500 Active 31 DOM
-
2026-06-05days on market $149,500 Active 28 DOM
-
2026-06-03days on market $149,500 Active 27 DOM
-
2026-06-02days on market $149,500 Active 26 DOM
-
2026-06-01days on market $149,500 Active 25 DOM
-
2026-05-31days on market $149,500 Active 24 DOM
-
2026-05-07$149,500 Active 99-char remark
-
2026-02-02historical $1,623
-
2026-01-18$1,623
-
2025-05-15price $155,000
-
2025-04-03price $165,000
-
2025-01-17price $175,000
-
2023-12-14historical $1,400
-
2023-11-29price $1,400
-
2023-11-18$1,500
-
1989-09-11soldstatus $83,882
-
1985-02-01soldstatus $79,500
ⓘ Source: listings_history table (triggers on properties + properties_extension) + one-shot
backfill from property_details.listing_events for pre-trigger history.
Tax reassessment forecast AL · Resets to sale price
- Current annual tax
- $2,659 · $222/mo
- Projected year-2 tax
- $2,659 · $222/mo
- Expected delta
- $0/yr ($0/mo · 0.0%)
ⓘ Screening estimate from a state-policy table — verify with the county assessor before closing.
Climate risk First Street
- Flood 1/10 Low FEMA zone X (unshaded) · 0% chance over 30 yrs
- Wildfire 2/10 Low
- Heat 6/10 Major 7 d/yr ≥108°F today · 19 d/yr by 30 yrs out
- Wind 6/10 Major 48% chance of damaging wind over 30 yrs
- Air quality 3/10 Moderate 2 unhealthy d/yr today · 5 by 30 yrs out
Nearby sold comps map
Loading sold comps map…
Walkable amenities ~0.75 mi
Loading nearby amenities…
Taxation est. · year 1
- Rental income
- $15,313
- − Mortgage interest
- −$8,374
- − Property taxes
- −$2,659
- − Insurance
- −$748
- − Repairs & maintenance
- −$1,225
- − Management
- −$1,225
- − Depreciation
- −$4,349
- Taxable loss
- −$3,267
- Est. tax savings @ 24.0%
- +$784
- After-tax cash flow
- $67/yr
For passive investors: Depreciation is non-cash, so a rental often shows a tax loss while cash-flowing — sheltering income. Rental losses are passive: they offset passive income freely, and up to $25,000/yr can offset ordinary (W-2) income if you actively participate and your MAGI is under $100k (phasing out to $0 by $150k); unused losses carry forward. On sale, claimed depreciation is recaptured at up to 25%, and gains may owe capital-gains tax (a 1031 exchange can defer both). Figures are a year-1 estimate at your 24.0% rate — not tax advice; consult a CPA.
Schools (NCES district)
- District
- Bessemer City
- NCES district ID
- 0100330
- Math proficiency
- 3% ▼ -18.00%
- Reading proficiency
- 19% ▼ -3.00%
- Median HH income
- $29,721
- Composite
- 8.45/100
- National rank
- #9905
- State rank
- #120 of 129 in AL
Livability — Bessemer
- Score
- 59/100
- State rank
- #331
- US rank
- #20078
Category grades
Schools grade is shown separately in the Schools card above.
Census & demographics
- Census place
- Bessemer, AL
- County
- Jefferson County · 527,445 people
- City population
- 48,018
- Metro
- Birmingham-Hoover, AL
- Population (ZIP)
- 24,892
- Household income
- $35,362
- Rent vs Own
- Severe rent burden
- 1001.0
Population outlook (Jefferson County) Hauer SSP2
- Today (2025)
- 669,185 people
- By 2030
- 669,694 · +0.1%
- By 2040
- 661,388 · -1.2%
- By 2050
- 643,086 · -3.9%
- By 2075
- 577,267 · -13.7%
- By 2100
- 474,758 · -29.1%
Race, ethnicity, and origin ACS 2023
- Neighborhood character
- Predominantly Black (74%)
- Race & ethnicity
- Black 74% Hispanic / Latino 13% White 11% Two or more races 6%
- Hispanic origin (detail)
- Mexican 10%
- Foreign-born
- 5% · Canada
- Languages at home
- 89% English-only · Spanish 11%
Political lean MEDSL · Jefferson
- 2024 margin
- D (+10.4) · D 54.6% · R 44.2% · Other 1.2%
- 2008→2024 swing
- +5.4pp toward D · 2008: 5.1pp · 2024: 10.4pp
- All cycles
- 2024: D+10.4 2020: D+13.2 2016: D+7.2 2012: D+6.0 2008: D+5.1
Not yet ingested
- Civics
- —
Market trends
- HPI YoY
- ▼ -57.54%
- Current HPI
- 179.7702
- Rent YoY
- ▼ -3.12%
- Metro
- Birmingham-Hoover, AL
- State GDP YoY
- ▲ 2.94%
- F500 in state
- 4
Industry mix (Fortune 500 HQ in AL)
| Industry | F500 HQs | Revenue |
|---|---|---|
| Financial Services | 1 | $8B |
|
||
| Healthcare | 1 | $5B |
|
||
Price history
+88.1% since first listed11 events — show timeline
- 2026-05-07 Listed $149,500 Greater Alabama MLS
- 2026-02-02 Rental Removed $1,623 RENTLY
- 2026-01-18 Listed for Rent $1,623 RENTLY
- 2025-05-15 Price Changed $155,000 Greater Alabama MLS
- 2025-04-03 Price Changed $165,000 Greater Alabama MLS
- 2025-01-17 Price Changed $175,000 Greater Alabama MLS
- 2023-12-14 Rental Removed $1,400 GALMLS
- 2023-11-29 Price Changed $1,400 GALMLS
- 2023-11-18 Listed for Rent $1,500 GALMLS
- 1989-09-11 Sold (Public Records) $83,882 Public Records
- 1985-02-01 Sold (Public Records) $79,500 Public Records
Property tax history
+9.6%/yrLatest (2025): $2,659 · +0.0% YoY. Source: county tax records.
Cash-flow waterfall
monthlySold comps — $/sqft
last 12 mo · ≤1 miLoading sold comps…