706 E Joliet St · Ottawa, IL
Flood risk 1/10 · Minimal
- FEMA flood zone
- X (unshaded)
- Chance of flooding over 30 yrs
- 0.0%
- Est. flood insurance / yr
- $473 – $860
Fire risk 3/10 · Minor
- Est. fire insurance / yr
- $804 – $1,492
Heat risk 3/10 · Minor
- Hot days now (above 103°F)
- 7 days/yr
- Hot days in 30 yrs
- 17 days/yr
Wind risk 2/10 · Minimal
- Chance of severe wind over 30 yrs
- 1.0%
Air-quality risk 2/10 · Minimal
- Unhealthy air days now
- 1 days/yr
- Unhealthy air days in 30 yrs
- 2 days/yr
Risk factors via First Street. Map © Google.
Why this score? — see what drove the C- grade
The composite is a weighted blend of 9 inputs, each scored 0–100. Each bar is that input's sub-score; the figure is the points it added to the 100-point composite (weight × sub-score).
- Cash flow +23.1/30.0
- DSCR +7.4/10.0
- 1% rule +7.0/10.0
- Livability +3.9/5.0
- Schools +2.7/10.0
- Rent growth +2.5/5.0
- Condition / age +2.5/5.0
- ARV discount +1.6/15.0
- Appreciation +0.0/10.0
$119,500
🖨 Deal sheet 📄 Offer letter ✓ Due diligence
Listing remarks MLS
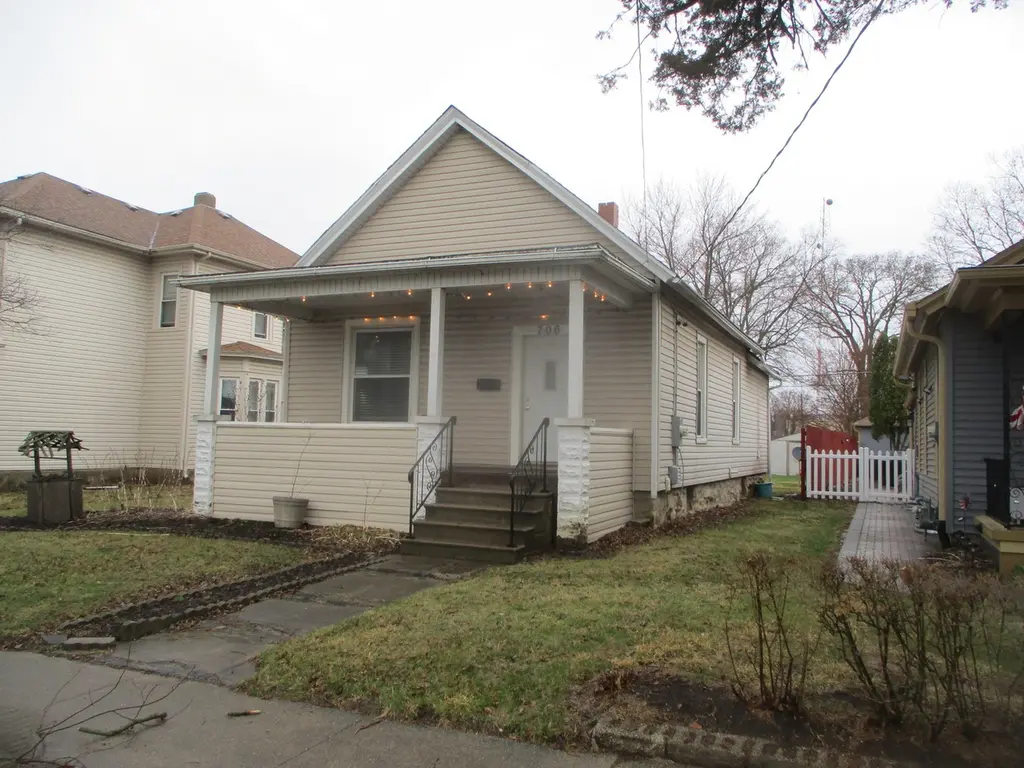
This home has been completely remodeled with plank floors, drywall, vinyl bathroom floor and newer HVAC. Other features include stove, refrigerator, dishwasher, front open porch and a deep accessible crawl space.
Key facts
- Plank floors
- Front open porch
- Completely remodeled
Tags
Neighborhood map
What this means for you Summary
Snapshot
- This is a 2-bed/1.0-bath single-family listed at $120k.
Deal economics
- At list price, monthly cash flow is $215 ($3k/yr) — positive.
- The deal already cash-flows at list — no discount required.
- Meets the 1% rule at list price ($1k rent vs $120k).
- Recommended offer: $112k (6.0% below list) — sets the bar for market timing.
- Cap rate 8.4% vs local median 3.1% in Ottawa — top-decile yield for the area; either an underpriced asset or a hidden risk that comps aren't pricing in. Stress-test before assuming the spread holds.
Location & tenants
- Location reads 77/100 on livability (#172 in IL, #3,175 nationally) — a middle-class / working-renter tenant base. Strengths: cost of living A+, health & safety A+, housing A; Watch: employment C-, amenities D, commute F.
- Ottawa Twp Hsd 140 (town): math 25% / reading 30% proficiency, ranked #545 of 919 in IL (top 59%) — low school quality limits family demand, transient renter base, plan for 1-2y turnover.
- Zoned schools: Ottawa Township High School (math 17% / reading 27%, grade F, #319 of 693 statewide, top 50%, 1,261 students, 0% FRL).
- Market conditions: 205 active listings in the ZIP; 1 comparable units currently listed for rent nearby; solid renter incomes; 82 units permitted in LaSalle County in 2024 (0 in 5+ unit buildings).
Forward outlook
- Local home prices are declining (-3.0%/yr); year-one equity from $826 of loan paydown is wiped out by about $4k of value loss. Plan a longer hold.
- LaSalle County population projected at -16% by 2050 — secular population decline; favor cash flow + early exit over multi-decade hold.
Negotiation context
- It's been on market 83 days — a 6% lower offer ($112k) is reasonable based on typical stale-listing flexibility.
- 2 sale attempts with the ask held roughly flat each time — persistent listings suggest the price (not the market) is what's stuck; bring a comps-based counter.
- Current owner paid $36k; list at $120k implies a 232% gain — meaningful room to come down on a strong offer.
Risks & watch-outs
- Watch-outs: built in 1917 — expect roof / HVAC / electrical / plumbing capex.
Questions for the listing agent
- It's been on market 83 days. Have you received any prior offers? Is the seller open to a 6% concession, seller financing, or rate buy-down credit?
- Built in 1917 — when were the roof, HVAC, electrical panel, plumbing, and water heater last replaced?
- Why hasn't it sold? Are there any deal-killer items the seller is aware of (foundation, flood, title, zoning, code violations)?
- Is there a deadline driving the sale (1031 exchange, divorce, estate, relocation)? That informs how much negotiation room exists.
- Schools are D-rated, which usually means shorter tenancies and higher turnover. Who's the typical renter profile here, and what's been the actual vacancy rate?
- What's the average days-on-market for RENTAL listings here right now (not sales)? A rising rental-DOM trend means longer vacancies and softer asking-rent achievability than the comps imply.
- What's the recent tenant-quality profile in this submarket — average credit score on applications, eviction rate, late-payment / NSF rate, and stable-employment percentage? A property-management company in the area should have these aggregated.
- How much new for-sale + rental construction is in the pipeline within 1–3 miles? Heavy new supply typically softens prices + rents 12–24 months out; constrained supply supports both.
Investment metrics
- 1% rule
- 1.20% ✓
- Cap rate
- 8.45%
- Cash-on-cash
- 7.70%
- DSCR
- 1.34
- GRM
- 6.9
CMA / ARV
- ARV (on-the-fly)
- $105,655
- Comps found
- 10
Show comp detail 10 sales within ~0.75 mi
| Address | Dist | Beds/Ba | Sqft | Sold | Price | $/sf | Match |
|---|---|---|---|---|---|---|---|
| 1849 Post St | 0.44mi | 2/1.0 | 936 (+0%) | 3mo | $77,052 | $82 | 77 |
| 537 Saint George St | 0.34mi | 2/1.0 | 864 (-8%) | 1mo | $165,000 | $191 | 70 |
| 321 E Washington St | 0.44mi | 2/1.0 | 954 (+2%) | 7mo | $108,000 | $113 | 70 |
| 2103 Franklin Ave | 0.52mi | 2/1.0 | 1,008 (+8%) | 3mo | $70,100 | $70 | 60 |
| 805 Bellevue Ave | 0.49mi | 3/1.0 (+1) | 915 (-2%) | 10mo | $55,000 | $60 | 60 |
| 148 E Fremont St | 0.49mi | 3/1.0 (+1) | 900 (-4%) | 9mo | $147,500 | $164 | 58 |
| 708 Congress St | 0.59mi | 2/1.0 | 956 (+2%) | 15mo | $107,000 | $112 | 56 |
| 1833 Columbus St | 0.55mi | 2/2.0 | 912 (-2%) | 22mo | $112,000 | $123 | 48 |
| 221 Prairie St | 0.44mi | 2/1.0 | 847 (-9%) | 20mo | $90,000 | $106 | 48 |
| 1900 Post St | 0.44mi | 3/1.0 (+1) | 1,050 (+12%) | 22mo | $125,000 | $119 | 36 |
Match score weights: distance 35% · size 25% · config 20% · recency 20%. Top-matched comps best support the ARV.
Projected returns pro-forma
-3.0% appreciation · 3.0% rent growth · sell at horizon
- IRR
- -4.5%
- Equity multiple
- 0.83×
- Total profit
- $-5,603
- Equity at exit
- $17,818
- IRR
- 5.3%
- Equity multiple
- 1.39×
- Total profit
- $13,061
- Equity at exit
- $10,332
Cash invested: $33,460 (down + closing). Projections, not guarantees.
Landlord ↔ Tenant lean methodology
- Overall (STATE)
- 43 Moderately Tenant-Leaning
- State Illinois
- 43 Moderately Tenant-Leaning · D+7
- County
- — inherits STATE
- City
- — inherits STATE
ZIP-level market 61350
- Home prices YoY
- -31.5%
- Active inventory
- 205
- Price-to-rent
- 6.9×
Monthly cashflow live
- Estimated rent
- $1,437 medium interval (Pro) →
- Mortgage (P&I)
- −$627
- Tax from tax record
- −$244 /mo · $2,928/yr
- Insurance
- −$50
- HOA
- −$0
- Vacancy / Maint / Mgmt
- −$302
- Net cashflow
- $215
Break-even live
UW: 25.0% down · 7.5% · 30yr · 1.5% tax · 5.0% vac · 8.0% maint · 8.0% mgmt
Financing live
Cash to close
- Down payment
- $29,875
- Closing costs
- $3,585
- Reserves months
- —
- Total cash needed
- —
Loan-product check · same deal, 3 products live
Conventional
25% down · 7.5% · 30yr
- Down + closing
- —
- Monthly P&I
- —
- Monthly cashflow
- —
- DSCR
- —
- Eligible?
- —
Personal DTI + credit; lowest rate.
DSCR
20% down · 8.5% · 30yr
- Down + closing
- —
- Monthly P&I
- —
- Monthly cashflow
- —
- DSCR
- —
- Eligible?
- —
No personal income docs; deal must DSCR.
Hard money
10% down · 12.0% · 12mo
- Down + closing
- —
- Monthly P&I
- —
- Monthly cashflow
- —
- DSCR
- —
- Eligible?
- —
Short-term bridge; refi at stabilization.
Rent comps 1 comps
| Address | Beds | Baths | Sqft | Rent | $/sqft | DOM | Units | Dist |
|---|---|---|---|---|---|---|---|---|
| 224 1/2 W Madison St Ottawa, IL | 1.0 | 1.0 | 950 | $1,600 | $1.68 | 19d | 1 | 0.87mi |
Listing history 15 events
-
2026-06-19days on market $119,500 Active 83 DOM
-
2026-06-18days on market $119,500 Active 82 DOM
-
2026-06-17days on market $119,500 Active 81 DOM
-
2026-06-16days on market $119,500 Active 80 DOM
-
2026-06-15days on market $119,500 Active 79 DOM
-
2026-06-14days on market $119,500 Active 77 DOM
-
2026-06-12days on market $119,500 Active 76 DOM
-
2026-06-09days on market $119,500 Active 73 DOM
-
2026-06-08days on market $119,500 Active 72 DOM
-
2026-06-07days on market $119,500 Active 71 DOM
-
2026-06-05statusdays on market $119,500 Active 68 DOM
-
2026-04-03status Pending
-
2026-03-28$119,500 Active 212-char remark
Show marketing remark (212 chars)
This home has been completely remodeled with plank floors, drywall, vinyl bathroom floor and newer HVAC. Other features include stove, refrigerator, dishwasher, front open porch and a deep accessible crawl space.
-
2026-03-17$119,500 Active
-
2007-07-16soldstatus $36,000
ⓘ Source: listings_history table (triggers on properties + properties_extension) + one-shot
backfill from property_details.listing_events for pre-trigger history.
Tax reassessment forecast IL · Partial reset (capped growth)
- Current annual tax
- $2,928 · $244/mo
- Projected year-2 tax
- $2,928 · $244/mo
- Expected delta
- $0/yr ($0/mo · 0.0%)
ⓘ Screening estimate from a state-policy table — verify with the county assessor before closing.
Climate risk First Street
- Flood 1/10 Low FEMA zone X (unshaded) · 0% chance over 30 yrs
- Wildfire 3/10 Moderate
- Heat 3/10 Moderate 7 d/yr ≥103°F today · 17 d/yr by 30 yrs out
- Wind 2/10 Low 100% chance of damaging wind over 30 yrs
- Air quality 2/10 Low 1 unhealthy d/yr today · 2 by 30 yrs out
Nearby sold comps map
Loading sold comps map…
Walkable amenities ~0.75 mi
Loading nearby amenities…
Taxation est. · year 1
- Rental income
- $17,245
- − Mortgage interest
- −$6,694
- − Property taxes
- −$2,928
- − Insurance
- −$598
- − Repairs & maintenance
- −$1,380
- − Management
- −$1,380
- − Depreciation
- −$3,476
- Taxable income
- $790
- Est. tax owed @ 24.0%
- −$190
- After-tax cash flow
- $2,388/yr
For passive investors: Depreciation is non-cash, so a rental often shows a tax loss while cash-flowing — sheltering income. Rental losses are passive: they offset passive income freely, and up to $25,000/yr can offset ordinary (W-2) income if you actively participate and your MAGI is under $100k (phasing out to $0 by $150k); unused losses carry forward. On sale, claimed depreciation is recaptured at up to 25%, and gains may owe capital-gains tax (a 1031 exchange can defer both). Figures are a year-1 estimate at your 24.0% rate — not tax advice; consult a CPA.
Schools (NCES district)
- District
- Ottawa Twp Hsd 140
- NCES district ID
- 1730330
- Math proficiency
- 25% ▼ -3.00%
- Reading proficiency
- 30% ▼ -4.00%
- Median HH income
- $47,828
- Composite
- 26.85/100
- National rank
- #12528
- State rank
- #545 of 919 in IL
Livability — Ottawa
- Score
- 77/100
- State rank
- #172
- US rank
- #3175
Category grades
Schools grade is shown separately in the Schools card above.
Census & demographics
- Census place
- Ottawa, IL
- County
- La Salle County · 41,676 people
- City population
- 23,713
- Metro
- Ottawa, IL
- Population (ZIP)
- 23,713
- Household income
- $77,921
- Rent vs Own
- Severe rent burden
- 628.0
Population outlook (LaSalle County) Hauer SSP2
- Today (2025)
- 107,080 people
- By 2030
- 104,196 · -2.7%
- By 2040
- 97,413 · -9.0%
- By 2050
- 90,294 · -15.7%
- By 2075
- 76,252 · -28.8%
- By 2100
- 61,339 · -42.7%
Race, ethnicity, and origin ACS 2023
- Neighborhood character
- Predominantly White (85%)
- Race & ethnicity
- White 85% Hispanic / Latino 9% Two or more races 4% Black 2%
- Hispanic origin (detail)
- Mexican 7%
- Common ancestry
- Romanian 6% Portuguese 5% Lithuanian 2%
- Foreign-born
- 2% · Canada
- Languages at home
- 95% English-only · Spanish 3%
Political lean MEDSL · LaSalle
- 2024 margin
- R (+18.5) · D 40.1% · R 58.6% · Other 1.3%
- 2008→2024 swing
- -29.6pp toward R · 2008: 11.1pp · 2024: -18.5pp
- All cycles
- 2024: R+18.5 2020: R+14.3 2016: R+14.4 2012: R+0.4 2008: D+11.1
Not yet ingested
- Civics
- —
Market trends
- HPI YoY
- ▼ -84.46%
- Current HPI
- 183.6833
- Rent YoY
- —
- Metro
- Ottawa, IL
- State GDP YoY
- ▲ 1.59%
- F500 in state
- 60
Industry mix (Fortune 500 HQ in IL)
| Industry | F500 HQs | Revenue |
|---|---|---|
| Insurance | 4 | $201B |
|
||
| Consumer Goods | 4 | $87B |
|
||
| Industrial Machinery | 3 | $64B |
|
||
| Healthcare | 2 | $55B |
|
||
| Retail / Pharmacy | 1 | $148B |
|
||
| Agriculture / Food | 1 | $86B |
|
||
Price history
+231.9% since first listed4 events — show timeline
- 2026-04-03 Pending — MRED as Distributed by MLS Grid
- 2026-03-28 Listed $119,500 NWIAR
- 2026-03-17 Listed $119,500 MRED as Distributed by MLS Grid
- 2007-07-16 Sold (Public Records) $36,000 Public Records
Property tax history
+4.3%/yrLatest (2024): $2,928 · +9.2% YoY. Source: county tax records.
Cash-flow waterfall
monthlySold comps — $/sqft
last 12 mo · ≤1 miLoading sold comps…