 Duplex
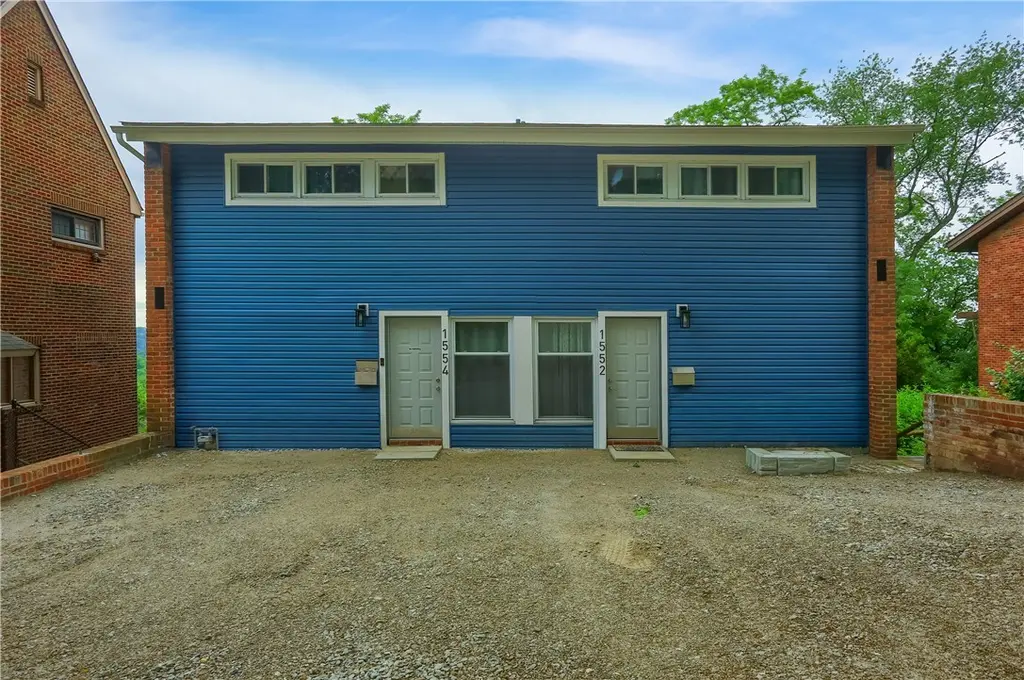
1552 - 1554 Barr Ave · Crafton, PA
Flood risk 1/10 · Minimal
- FEMA flood zone
- X (unshaded)
- Chance of flooding over 30 yrs
- 0.0%
- Est. flood insurance / yr
- $473 – $860
Fire risk 1/10 · Minimal
- Est. fire insurance / yr
- $511 – $949
Heat risk 3/10 · Minor
- Hot days now (above 97°F)
- 5 days/yr
- Hot days in 30 yrs
- 11 days/yr
Wind risk 2/10 · Minimal
- Chance of severe wind over 30 yrs
- —
Air-quality risk 2/10 · Minimal
- Unhealthy air days now
- 0 days/yr
- Unhealthy air days in 30 yrs
- 3 days/yr
Risk factors via First Street. Map © Google.
Why this score? — see what drove the B grade
The composite is a weighted blend of 9 inputs, each scored 0–100. Each bar is that input's sub-score; the figure is the points it added to the 100-point composite (weight × sub-score).
- Cash flow +30.0/30.0
- 1% rule +10.0/10.0
- DSCR +10.0/10.0
- ARV discount +7.5/15.0
- Livability +4.0/5.0
- Condition / age +3.8/5.0
- Rent growth +3.4/5.0
- Schools +3.4/10.0
- Appreciation +0.0/10.0
$250,000
🖨 Deal sheet 📄 Offer letter ✓ Due diligence
Multi-family units
County records classify this as Multi-Family (2-4 Unit). Listing-text estimate: 2 units. confirmed
Listing remarks
Income-producing duplex in Crafton — ideal for investors or owner occupied buyers. Both units are tenant occupied with leases ending August and September. Unit 1552 is a 3 bedroom, 2 baths, kitchen, dining room, living room and a finished basement with kitchenette. Furnace is 2019, AC is 2010 and H2O tank is 2018. Unit 1554 is a 3 bedroom, 1 bath, updated kitchen (2020), dining room, living room and a Pittsburgh toilet in basement. Furnace is 2020 and AC 2023. Other major capital improvements include: new roof (2023), Siding (2021) and 4 off street parking spots. All kitchen appliances and washer/dryer are included. Utilities are separated which tenants pay except trash.
Key facts
- Off street parking
- Finished basement
- Updated kitchen
Tags
Property features AI
Finance
- Financial info: Total of 2 units; Reported gross income: $28,800; Current actual rent listed as $1,200 for each unit
Exterior
- Parking: Off-street parking for 4 vehicles
- Home design: Multi-family zoning
- Construction: Brick and frame construction; Asphalt roof
- Exterior features: Lot dimensions approximately 50 x 110
Interior
- Bedrooms: Unit 1: 3 bedrooms; Unit 2: 3 bedrooms
- Bathrooms: Unit 1: 1 full bathroom; Unit 2: 2 full bathrooms
- Interior features: Two-unit multi-family property
Neighborhood map
What this means for you Summary
Snapshot
- This is a 2 × 3-bed/1.5-bath units multifamily listed at $250k. Condition is rated good.
Deal economics
- At list price, monthly cash flow is $2k ($18k/yr) — positive. Per door: $762/mo.
- The deal already cash-flows at list — no discount required.
- Meets the 1% rule at list price ($4k rent vs $250k).
Location & tenants
- Location reads 81/100 on livability (#160 in PA, #1,322 nationally) — a professional / high-income tenant draw. Strengths: cost of living A+, housing A+, schools A; Watch: commute F.
- Carlynton SD (suburban): math 29% / reading 52% proficiency, ranked #352 of 539 in PA (top 65%) — families likely to look elsewhere, expect single-tenant / working-renter base with shorter leases.
- Market conditions: Rents rising (+3.4%/yr); 61 active listings in the ZIP; 2,996 units permitted in Allegheny County in 2024 (1,588 in 5+ unit buildings).
- At $4,115/mo this rent would consume 70% of the median local household income ($71k/yr) (locally 1334% of renters already pay >50% of income on rent) — very limited rent-growth headroom before tenants either downsize or default.
Forward outlook
- Local home prices are declining (-3.0%/yr); year-one equity from $2k of loan paydown is wiped out by about $8k of value loss. Plan a longer hold.
- At projected returns (-3.0% appreciation + 3.4% rent growth), your $70k cash investment doubles in ~5 years — after that, you're playing with house money.
Negotiation context
- Only 8 days on market — expect competitive offers; lowballing is unlikely to land.
Questions for the listing agent
- Can we see the unit-by-unit rent roll, current vacancy, and any below-market leases? What's the average tenancy length?
- What capital expenditures (roof, boiler, parking lot, exteriors) have been made in the last 5 years, and what's planned in the next 2?
- Built in 1960 — when were the roof, HVAC, electrical panel, plumbing, and water heater last replaced?
- Is there a deadline driving the sale (1031 exchange, divorce, estate, relocation)? That informs how much negotiation room exists.
- Schools are A-rated — typically a magnet for longer-tenancy family renters. What's the average tenant stay here, and is there a school-zone premium baked into asking?
- What's the average days-on-market for RENTAL listings here right now (not sales)? A rising rental-DOM trend means longer vacancies and softer asking-rent achievability than the comps imply.
- What's the recent tenant-quality profile in this submarket — average credit score on applications, eviction rate, late-payment / NSF rate, and stable-employment percentage? A property-management company in the area should have these aggregated.
- How much new apartment / multifamily construction is in the pipeline within 1–3 miles? Heavy new supply (>2% of stock underway) typically softens rents 12–24 months out; light construction supports rent growth.
Investment metrics
- 1% rule
- 1.65% ✓
- Cap rate
- 13.60%
- Cash-on-cash
- 26.11%
- DSCR
- 2.16
- GRM
- 5.1
CMA / ARV
No comps found within radius.
Show comp detail 7 sales within ~0.75 mi
| Address | Dist | Beds/Ba | Sqft | Sold | Price | $/sf | Match |
|---|---|---|---|---|---|---|---|
| 20 Walnut | 0.22mi | 6/3.0 | — | 10mo | $195,000 | — | 70 |
| 216 Clairhaven St | 0.54mi | 6/3.0 | — | 2mo | $150,000 | — | 61 |
| 5 Union St | 0.28mi | 5/2.0 (-1) | 2,550 | 8mo | $46,000 | $18 | 58 |
| 42 Baldwick Rd | 0.48mi | 5/4.0 (-1) | — | 1mo | $295,500 | — | 55 |
| 1720 Stratmore St | 0.54mi | 6/2.0 | — | 11mo | $265,000 | — | 50 |
| 25-27 Joel St | 0.60mi | 6/2.0 | — | 8mo | $165,000 | — | 49 |
| 13 & 15 Clearview Ave | 0.44mi | 6/2.0 | — | 23mo | $190,000 | — | 44 |
Match score weights: distance 35% · size 25% · config 20% · recency 20%. Top-matched comps best support the ARV.
Projected returns pro-forma
-3.0% appreciation · 3.4% rent growth · sell at horizon
- IRR
- 20.3%
- Equity multiple
- 1.83×
- Total profit
- $58,225
- Equity at exit
- $37,276
- IRR
- 28.8%
- Equity multiple
- 3.61×
- Total profit
- $182,748
- Equity at exit
- $21,615
Cash invested: $70,000 (down + closing). Projections, not guarantees.
Landlord ↔ Tenant lean methodology
- Overall (STATE)
- 62 Landlord-Friendly
- State Pennsylvania
- 62 Landlord-Friendly · EVEN
- County
- — inherits STATE
- City
- — inherits STATE
ZIP-level market 15205
- Home prices YoY
- -30.7%
- Rents YoY
- 3.4%
- Active inventory
- 61
- Price-to-rent
- 10.1×
Monthly cashflow live
- Estimated rent
- $4,115 high interval (Pro) →
- Mortgage (P&I)
- −$1,311
- Tax est. 1.5%
- −$312 /mo · $3,750/yr
- Insurance
- −$104
- HOA
- −$0
- Vacancy / Maint / Mgmt
- −$864
- Net cashflow
- $1,523
Break-even live
2-unit breakdown (identical units grouped — click to expand)
| Units | Beds | Baths | Est. rent |
|---|---|---|---|
| 2× units | 3 | 1.5 | $4,114 |
| #1 | 3 | 1.5 | $2,057 |
| #2 | 3 | 1.5 | $2,057 |
| Total (2 units) | $4,115 | ||
UW: 25.0% down · 7.5% · 30yr · 1.5% tax · 5.0% vac · 8.0% maint · 8.0% mgmt
Financing live
Cash to close
- Down payment
- $62,500
- Closing costs
- $7,500
- Reserves months
- —
- Total cash needed
- —
Loan-product check · same deal, 3 products live
Conventional
25% down · 7.5% · 30yr
- Down + closing
- —
- Monthly P&I
- —
- Monthly cashflow
- —
- DSCR
- —
- Eligible?
- —
Personal DTI + credit; lowest rate.
DSCR
20% down · 8.5% · 30yr
- Down + closing
- —
- Monthly P&I
- —
- Monthly cashflow
- —
- DSCR
- —
- Eligible?
- —
No personal income docs; deal must DSCR.
Hard money
10% down · 12.0% · 12mo
- Down + closing
- —
- Monthly P&I
- —
- Monthly cashflow
- —
- DSCR
- —
- Eligible?
- —
Short-term bridge; refi at stabilization.
Listing history 1 events
-
2026-05-20$250,000 Active
ⓘ Source: listings_history table (triggers on properties + properties_extension) + one-shot
backfill from property_details.listing_events for pre-trigger history.
Climate risk First Street
- Flood 1/10 Low FEMA zone X (unshaded) · 0% chance over 30 yrs
- Wildfire 1/10 Low
- Heat 3/10 Moderate 5 d/yr ≥97°F today · 11 d/yr by 30 yrs out
- Wind 2/10 Low
- Air quality 2/10 Low 0 unhealthy d/yr today · 3 by 30 yrs out
Nearby sold comps map
Loading sold comps map…
Walkable amenities ~0.75 mi
Loading nearby amenities…
Taxation est. · year 1
- Rental income
- $49,380
- − Mortgage interest
- −$14,004
- − Property taxes
- −$3,750
- − Insurance
- −$1,250
- − Repairs & maintenance
- −$3,950
- − Management
- −$3,950
- − Depreciation
- −$7,273
- Taxable income
- $15,203
- Est. tax owed @ 24.0%
- −$3,649
- After-tax cash flow
- $14,629/yr
For passive investors: Depreciation is non-cash, so a rental often shows a tax loss while cash-flowing — sheltering income. Rental losses are passive: they offset passive income freely, and up to $25,000/yr can offset ordinary (W-2) income if you actively participate and your MAGI is under $100k (phasing out to $0 by $150k); unused losses carry forward. On sale, claimed depreciation is recaptured at up to 25%, and gains may owe capital-gains tax (a 1031 exchange can defer both). Figures are a year-1 estimate at your 24.0% rate — not tax advice; consult a CPA.
Condition & rehab AI · 4 photos
This well-maintained, updated duplex is ready for new tenants or buyers. Recent improvements include a new roof, siding, and HVAC systems, making it a solid investment opportunity.
Value-add opportunities
- Both Paint the exterior and interior walls — Fresh paint can enhance curb appeal and interior aesthetics.
- Both Replace the garage door — A new garage door can improve curb appeal and functionality.
- Both Install a new front door — A new front door can significantly boost curb appeal and security.
- Both Add landscaping around the house — Well-maintained landscaping can improve curb appeal and add value to the property.
Renovation cost estimate screening
Value-add ROI direction
- Both Paint the exterior and interior walls — Fresh paint can enhance curb appeal and interior aesthetics. ↑
- Both Replace the garage door — A new garage door can improve curb appeal and functionality. ↑
- Both Install a new front door — A new front door can significantly boost curb appeal and security. ↑
- Both Add landscaping around the house — Well-maintained landscaping can improve curb appeal and add value to the property. ↑
ⓘ Cost ranges are severity-bucket heuristics (US national rule-of-thumb). Get contractor quotes + a written scope before underwriting a rehab budget.
Schools (NCES district)
- District
- Carlynton SD
- NCES district ID
- 4205040
- Math proficiency
- 29% ▼ -15.00%
- Reading proficiency
- 52% ▼ -11.00%
- Median HH income
- $46,249
- Composite
- 34.46/100
- National rank
- #5192
- State rank
- #352 of 539 in PA
Livability — Crafton
- Score
- 81/100
- State rank
- #160
- US rank
- #1322
Category grades
Schools grade is shown separately in the Schools card above.
Census & demographics
- Census place
- Crafton, PA
- County
- Allegheny County · 1,022,028 people
- City population
- 24,060
- Metro
- Pittsburgh, PA
- Population (ZIP)
- 24,060
- Household income
- $70,991
- Rent vs Own
- Severe rent burden
- 1334.0
Population outlook (Allegheny County) Hauer SSP2
- Today (2025)
- 1,250,282 people
- By 2030
- 1,256,482 · +0.5%
- By 2040
- 1,256,318 · +0.5%
- By 2050
- 1,244,169 · -0.5%
- By 2075
- 1,197,693 · -4.2%
- By 2100
- 1,093,187 · -12.6%
Race, ethnicity, and origin ACS 2023
- Neighborhood character
- Predominantly White (75%)
- Race & ethnicity
- White 75% Black 12% Two or more races 5% Asian 5% Hispanic / Latino 4%
- Common ancestry
- Romanian 9% Lithuanian 2% Serbian 2%
- Foreign-born
- 7% · Canada
- Languages at home
- 91% English-only · Spanish 3% Other Asian/Pacific 2% Other Indo-European 2%
Political lean MEDSL · Allegheny
- 2024 margin
- Strong D (+20.3) · D 59.7% · R 39.4%
- 2008→2024 swing
- +4.8pp toward D · 2008: 15.5pp · 2024: 20.3pp
- All cycles
- 2024: D+20.3 2020: D+20.4 2016: D+16.4 2012: D+14.4 2008: D+15.5
Not yet ingested
- Civics
- —
Market trends
- HPI YoY
- ▼ -109.16%
- Current HPI
- 246.4018
- Rent YoY
- ▲ 3.40%
- Metro
- Pittsburgh, PA
- State GDP YoY
- ▲ 1.68%
- F500 in state
- 34
Industry mix (Fortune 500 HQ in PA)
| Industry | F500 HQs | Revenue |
|---|---|---|
| Healthcare | 2 | $309B |
|
||
| Insurance | 2 | $27B |
|
||
| Telecommunications / Media | 1 | $124B |
|
||
| Industrial Distribution | 1 | $22B |
|
||
| Financial Services | 1 | $20B |
|
||
| Chemicals / Materials | 1 | $18B |
|
||
Price history
1 event — show timeline
- 2026-05-20 Listed $250,000 West Penn MLS
Cash-flow waterfall
monthlySold comps — $/sqft
last 12 mo · ≤1 miLoading sold comps…