 🏷️ Likely Rental
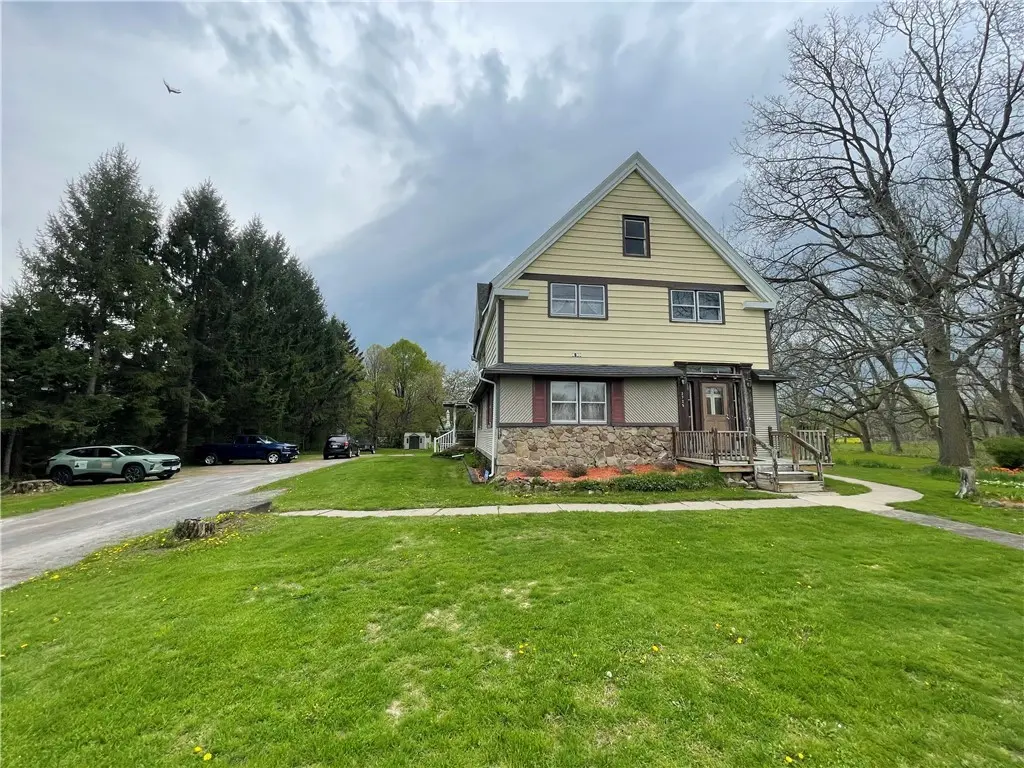
2725 S Union St · Spencerport, NY
Flood risk 1/10 · Minimal
- FEMA flood zone
- X (unshaded)
- Chance of flooding over 30 yrs
- 0.0%
- Est. flood insurance / yr
- $473 – $860
Fire risk 3/10 · Minor
- Est. fire insurance / yr
- $691 – $1,283
Heat risk 2/10 · Minimal
- Hot days now (above 95°F)
- 7 days/yr
- Hot days in 30 yrs
- 15 days/yr
Wind risk 1/10 · Minimal
- Chance of severe wind over 30 yrs
- —
Air-quality risk 2/10 · Minimal
- Unhealthy air days now
- 1 days/yr
- Unhealthy air days in 30 yrs
- 2 days/yr
Risk factors via First Street. Map © Google.
Why this score? — see what drove the B+ grade
The composite is a weighted blend of 9 inputs, each scored 0–100. Each bar is that input's sub-score; the figure is the points it added to the 100-point composite (weight × sub-score).
- Cash flow +30.0/30.0
- ARV discount +15.0/15.0
- DSCR +10.0/10.0
- 1% rule +9.3/10.0
- Schools +5.1/10.0
- Livability +3.8/5.0
- Rent growth +2.5/5.0
- Condition / age +2.5/5.0
- Appreciation +0.0/10.0
$374,900
🖨 Deal sheet (PDF) 📄 Offer letter ✓ Due diligence
Multi-family units
County records classify this as Multi-Family (2-4 Unit). Listing-text estimate: 3 units. confirmed
Listing remarks
Rare opportunity to own a character-filled 3-unit multi-family triplex in Ogden, New York within the highly sought-after Spencerport Central School District. Offering approximately 3,740 sq ft of living space on 1.15 acres, this income-producing property includes a one-bedroom, two-bedroom, and three-bedroom apartment, providing excellent flexibility for both owner-occupied investment and full rental use, with all units available at closing. Conveniently located near New York State Route 531 and Interstate 490, it offers easy access to Rochester, New York and surrounding areas. Each unit features separate utilities and forced air furnaces, making management efficient and tenant-friendly. Ad
Key facts
- 1.15 acre lot
- 2 parking spots
- Built 1900
Property features AI
Finance
- Other: Zoned Residential Multi Use; Property listed as resale; Multi-unit property with 3 total units; Each unit has separate gas and electric meters (3 each)
- Financial info: Owner pays water; Water rent included where applicable; Operating expenses include insurance and trash
Exterior
- Parking: Two or more parking spaces
- Utilities: Public water connected; Septic tank sewer
- Home design: 2-story building; Existing construction
- Construction: Vinyl siding
- Exterior features: Rectangular lot; Road frontage on a main thoroughfare; 1.15-acre lot
Interior
- Flooring: Carpet; Hardwood; Vinyl; Varies
- Bathrooms: 3 full bathrooms; 1 half bathroom
- Heating & cooling: Gas forced-air heating
- Interior features: Full basement; Varied flooring including carpet, hardwood and vinyl
- Laundry & utility: Gas water heater
Neighborhood map
What this means for you Summary
Snapshot
- This is a 3 × 2-bed/1.2-bath units multifamily listed at $375k.
Deal economics
- At list price, monthly cash flow is $1k ($17k/yr) — positive. Per door: $477/mo.
- The deal already cash-flows at list — no discount required.
- Meets the 1% rule at list price ($5k rent vs $375k).
- Cap rate 10.9% vs local median 3.3% in Spencerport — top-decile yield for the area; either an underpriced asset or a hidden risk that comps aren't pricing in. Stress-test before assuming the spread holds.
Location & tenants
- Location reads 76/100 on livability (#237 in NY, #3,718 nationally) — a middle-class / working-renter tenant base. Strengths: housing A+, health & safety A, crime B+; Watch: amenities F, commute F.
- Spencerport Central School District (suburban): math 52% / reading 63% proficiency, ranked #248 of 590 in NY (top 42%) — acceptable for families but not a draw, mixed tenant base, ~2y average lease.
- Zoned schools: Leo Bernabi School (math 42% / reading 52%, grade D-, #1,195 of 2,108 statewide, top 60%, 375 students, 28% FRL); A M Cosgrove Middle School (math 32% / reading 53%, grade D-, #373 of 729 statewide, top 52%, 844 students, 39% FRL); Spencerport High School (math 95% / reading 96%, grade A+, #76 of 1,100 statewide, top 7%, 1,142 students, 40% FRL).
- Market conditions: 73 active listings in the ZIP; solid renter incomes; 1,169 units permitted in Monroe County in 2024 (591 in 5+ unit buildings).
- At $5,364/mo this rent would consume 68% of the median local household income ($95k/yr) (locally 220% of renters already pay >50% of income on rent) — very limited rent-growth headroom before tenants either downsize or default.
Forward outlook
- Local home prices are declining (-3.0%/yr); year-one equity from $3k of loan paydown is wiped out by about $11k of value loss. Plan a longer hold.
- Monroe County population projected to shrink 6% by 2050 — rents likely to lag national; underwrite the cash flow, not the appreciation.
- At projected returns (-3.0% appreciation + 3.0% rent growth), your $105k cash investment doubles in ~8 years — after that, you're playing with house money.
Negotiation context
- Only 9 days on market — expect competitive offers; lowballing is unlikely to land.
Risks & watch-outs
- Watch-outs: built in 1900 — expect roof / HVAC / electrical / plumbing capex.
Questions for the listing agent
- Can we see the unit-by-unit rent roll, current vacancy, and any below-market leases? What's the average tenancy length?
- What capital expenditures (roof, boiler, parking lot, exteriors) have been made in the last 5 years, and what's planned in the next 2?
- Built in 1900 — when were the roof, HVAC, electrical panel, plumbing, and water heater last replaced?
- Is there a deadline driving the sale (1031 exchange, divorce, estate, relocation)? That informs how much negotiation room exists.
- Schools are B-rated — typically a magnet for longer-tenancy family renters. What's the average tenant stay here, and is there a school-zone premium baked into asking?
- What's the average days-on-market for RENTAL listings here right now (not sales)? A rising rental-DOM trend means longer vacancies and softer asking-rent achievability than the comps imply.
- What's the recent tenant-quality profile in this submarket — average credit score on applications, eviction rate, late-payment / NSF rate, and stable-employment percentage? A property-management company in the area should have these aggregated.
- How much new apartment / multifamily construction is in the pipeline within 1–3 miles? Heavy new supply (>2% of stock underway) typically softens rents 12–24 months out; light construction supports rent growth.
Investment metrics
- 1% rule
- 1.43% ✓
- Cap rate
- 10.87%
- Cash-on-cash
- 16.36%
- DSCR
- 1.73
- GRM
- 5.8
CMA / ARV
- ARV (median comp)
- $642,552
- List price
- $374,900
- Delta
- -41.65%
- Verdict
- UNDERPRICED
- Comps
- 2 within 2.0 mi
Projected returns pro-forma
-3.0% appreciation · 3.0% rent growth · sell at horizon
- IRR
- 7.4%
- Equity multiple
- 1.29×
- Total profit
- $30,597
- Equity at exit
- $55,899
- IRR
- 16.8%
- Equity multiple
- 2.38×
- Total profit
- $144,860
- Equity at exit
- $32,415
Cash invested: $104,972 (down + closing). Projections, not guarantees.
Landlord ↔ Tenant lean methodology
- Overall (STATE)
- 15 Strongly Tenant-Friendly
- State New York
- 15 Strongly Tenant-Friendly · D+10
- County
- — inherits STATE
- City
- — inherits STATE
ZIP-level market 14559
- Home prices YoY
- -31.7%
- Active inventory
- 73
- Price-to-rent
- 17.5×
Monthly cashflow live
- Estimated rent
- $5,364 medium interval (Pro) →
- Mortgage (P&I)
- −$1,966
- Tax from tax record
- −$684 /mo · $8,213/yr
- Insurance
- −$156
- HOA
- −$0
- Vacancy / Maint / Mgmt
- −$1,126
- Net cashflow
- $1,431
Break-even live
Sensitivity live
| Price | -10% $1,643 | -5% $1,537 | +0% $1,431 | +5% $1,325 | +10% $1,219 |
|---|---|---|---|---|---|
| Rent | -10% $1,007 | -5% $1,219 | +0% $1,431 | +5% $1,643 | +10% $1,855 |
| Rate | -1.0pp $1,620 | -0.5pp $1,526 | base $1,431 | +0.5pp $1,334 | +1.0pp $1,235 |
3-unit breakdown (identical units grouped — click to expand)
| Units | Beds | Baths | Est. rent |
|---|---|---|---|
| 3× units | 2 | 1.2 | $5,364 |
| #1 | 2 | 1.2 | $1,788 |
| #2 | 2 | 1.2 | $1,788 |
| #3 | 2 | 1.2 | $1,788 |
| Total (3 units) | $5,364 | ||
UW: 25.0% down · 7.5% · 30yr · 1.5% tax · 5.0% vac · 8.0% maint · 8.0% mgmt
Financing live
Cash to close
- Down payment
- $93,725
- Closing costs
- $11,247
- Reserves months
- —
- Total cash needed
- —
Loan-product check · same deal, 3 products live
Conventional
25% down · 7.5% · 30yr
- Down + closing
- —
- Monthly P&I
- —
- Monthly cashflow
- —
- DSCR
- —
- Eligible?
- —
Personal DTI + credit; lowest rate.
DSCR
20% down · 8.5% · 30yr
- Down + closing
- —
- Monthly P&I
- —
- Monthly cashflow
- —
- DSCR
- —
- Eligible?
- —
No personal income docs; deal must DSCR.
Hard money
10% down · 12.0% · 12mo
- Down + closing
- —
- Monthly P&I
- —
- Monthly cashflow
- —
- DSCR
- —
- Eligible?
- —
Short-term bridge; refi at stabilization.
Listing history 2 events
-
2026-05-15status Pending 1231-char remark
-
2026-05-06$374,900 Active 1231-char remark
ⓘ Source: listings_history table (triggers on properties + properties_extension) + one-shot
backfill from property_details.listing_events for pre-trigger history.
Tax reassessment forecast NY · Partial reset (capped growth)
- Current annual tax
- $8,213 · $684/mo
- Projected year-2 tax
- $8,213 · $684/mo
- Expected delta
- $0/yr ($0/mo · 0.0%)
ⓘ Screening estimate from a state-policy table — verify with the county assessor before closing.
Climate risk First Street
- Flood 1/10 Low FEMA zone X (unshaded) · 0% chance over 30 yrs
- Wildfire 3/10 Moderate
- Heat 2/10 Low 7 d/yr ≥95°F today · 15 d/yr by 30 yrs out
- Wind 1/10 Low
- Air quality 2/10 Low 1 unhealthy d/yr today · 2 by 30 yrs out
Nearby sold comps map
Loading sold comps map…
Walkable amenities ~0.75 mi
Loading nearby amenities…
Taxation est. · year 1
- Rental income
- $64,368
- − Mortgage interest
- −$21,000
- − Property taxes
- −$8,213
- − Insurance
- −$1,874
- − Repairs & maintenance
- −$5,149
- − Management
- −$5,149
- − Depreciation
- −$10,906
- Taxable income
- $12,075
- Est. tax owed @ 24.0%
- −$2,898
- After-tax cash flow
- $14,273/yr
For passive investors: Depreciation is non-cash, so a rental often shows a tax loss while cash-flowing — sheltering income. Rental losses are passive: they offset passive income freely, and up to $25,000/yr can offset ordinary (W-2) income if you actively participate and your MAGI is under $100k (phasing out to $0 by $150k); unused losses carry forward. On sale, claimed depreciation is recaptured at up to 25%, and gains may owe capital-gains tax (a 1031 exchange can defer both). Figures are a year-1 estimate at your 24.0% rate — not tax advice; consult a CPA.
Schools (NCES district)
- District
- Spencerport Central School District
- NCES district ID
- 3627780
- Math proficiency
- 52% ▼ -15.00%
- Reading proficiency
- 63% ▲ 8.00%
- Median HH income
- $66,920
- Composite
- 50.58/100
- National rank
- #1846
- State rank
- #248 of 590 in NY
Livability — Spencerport
- Score
- 76/100
- State rank
- #237
- US rank
- #3718
Category grades
Schools grade is shown separately in the Schools card above.
Census & demographics
- County
- Monroe County · 674,131 people
- City population
- 17,200
- Metro
- Rochester, NY
- Population (ZIP)
- 17,200
- Household income
- $94,794
- Rent vs Own
- Severe rent burden
- 220.0
Population outlook (Monroe County) Hauer SSP2
- Today (2025)
- 759,460 people
- By 2030
- 757,154 · -0.3%
- By 2040
- 740,644 · -2.5%
- By 2050
- 714,443 · -5.9%
- By 2075
- 645,883 · -15.0%
- By 2100
- 547,084 · -28.0%
Race, ethnicity, and origin ACS 2023
- Neighborhood character
- Predominantly White (92%)
- Race & ethnicity
- White 92% Two or more races 5% Hispanic / Latino 2% Black 1%
- Common ancestry
- Romanian 4% Slovak 3% Lithuanian 3%
- Foreign-born
- 3% · Canada
- Languages at home
- 97% English-only · Russian/Polish/Slavic 2% Other Indo-European 1%
Political lean MEDSL · Monroe
- 2024 margin
- D (+19.1) · D 59.5% · R 40.5%
- 2008→2024 swing
- +1.4pp toward D · 2008: 17.7pp · 2024: 19.1pp
- All cycles
- 2024: D+19.1 2020: D+21.0 2016: D+14.1 2012: D+17.4 2008: D+17.7
Not yet ingested
- Civics
- —
Market trends
- HPI YoY
- ▼ -121.06%
- Current HPI
- 260.3489
- Rent YoY
- —
- Metro
- Rochester, NY
- State GDP YoY
- ▲ 2.60%
- F500 in state
- 92
Industry mix (Fortune 500 HQ in NY)
| Industry | F500 HQs | Revenue |
|---|---|---|
| Financial Services | 10 | $950B |
|
||
| Consumer Goods | 9 | $162B |
|
||
| Insurance | 4 | $225B |
|
||
| Telecommunications | 2 | $144B |
|
||
| Pharmaceuticals | 2 | $112B |
|
||
| Media / Entertainment | 2 | $69B |
|
||
Price history
2 events — show timeline
- 2026-05-15 Pending — UNYREIS
- 2026-05-06 Listed $374,900 UNYREIS
Property tax history
+3.5%/yrLatest (2025): $8,213 · +4.9% YoY. Source: county tax records.
Cash-flow waterfall
monthlySold comps — $/sqft
last 12 mo · ≤1 miLoading sold comps…