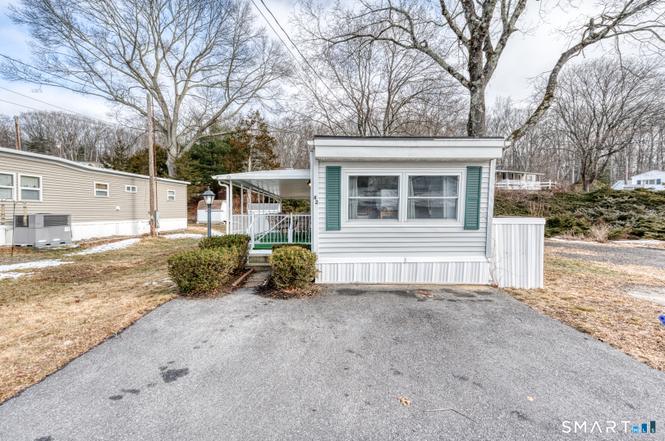
42 Grandview Cir · Mansfield, CT
Flood risk 1/10 · Minimal
- FEMA flood zone
- X
- Chance of flooding over 30 yrs
- 0.0%
- Est. flood insurance / yr
- $507 – $1,088
Fire risk 3/10 · Minor
- Est. fire insurance / yr
- $829 – $1,539
Heat risk 4/10 · Minor
- Hot days now (above 94°F)
- 7 days/yr
- Hot days in 30 yrs
- 16 days/yr
Wind risk 6/10 · Moderate
- Chance of severe wind over 30 yrs
- 46.0%
Air-quality risk 3/10 · Minor
- Unhealthy air days now
- 3 days/yr
- Unhealthy air days in 30 yrs
- 4 days/yr
Risk factors via First Street. Map © Google.
Why this score? — see what drove the C grade
The composite is a weighted blend of 9 inputs, each scored 0–100. Each bar is that input's sub-score; the figure is the points it added to the 100-point composite (weight × sub-score).
- Cash flow +20.8/30.0
- 1% rule +10.0/10.0
- ARV discount +7.5/15.0
- DSCR +6.6/10.0
- Schools +5.6/10.0
- Rent growth +2.5/5.0
- Livability +2.5/5.0
- Condition / age +2.5/5.0
- Appreciation +0.0/10.0
$99,000
🖨 Deal sheet 📄 Offer letter ✓ Due diligence
Listing remarks MLS
12X52 two-bedroom mobile home features covered porch, thermopane tilt-out windows, central air, and more in 55+ jensen's community. Pool, clubhouse, activities. Buyer must be approved by jensen's. Monthly park fee $357 + water bill $31/mo. Small pet ok.
Key facts
- Covered deck
- Garden area
- Shed
Tags
Property features AI
Finance
- Financial info: Property managed by on-site professional management
- HOA & community: Homeowners association with monthly fee; Association fee covers trash pickup, water, and sewer
Exterior
- Parking: Off-street parking for 2 vehicles
- Utilities: Public water connected; Public sewer connected; Electric hot water
- Home design: Single-family home in a 55+ adult community; Grey and white exterior
- Construction: Prefabricated construction; Flat roof; Vinyl and aluminum siding; No foundation listed
- Exterior features: Garden area; Covered deck; Patio; Located on a cul-de-sac
Interior
- Kitchen: Oven/Range; Refrigerator
- Bedrooms: 2 bedrooms
- Bathrooms: 1 full bathroom
- Heating & cooling: Central air; Hot air heating (propane fuel, above-ground tank)
- Interior features: Cable available; Total of 4 rooms; No basement
- Laundry & utility: Laundry in hallway on the main level
Neighborhood map
What this means for you Summary
Snapshot
- This is a 2-bed/1.0-bath manufactured listed at $99k.
Deal economics
- At list price, monthly cash flow is $136 ($2k/yr) — positive.
- The deal already cash-flows at list — no discount required.
- Meets the 1% rule at list price ($2k rent vs $99k).
- Recommended offer: $87k (12.0% below list) — sets the bar for market timing.
Location & tenants
- Location reads: area grade C — affects rentability + tenant quality, not the cash-flow math above.
- Mansfield School District (rural): math 59% / reading 70% proficiency, ranked #36 of 153 in CT (top 24%) — acceptable for families but not a draw, mixed tenant base, ~2y average lease; only 18% free/reduced lunch — higher-income household profile.
- Market conditions: 37 active listings in the ZIP; 4 comparable units currently listed for rent nearby; rentals at typical pace (median 14d on market — plan ~3-4 weeks tenant-placement turnaround); 1,867 units permitted in Capitol Planning Region in 2024 (1,399 in 5+ unit buildings).
Forward outlook
- Local home prices are declining (-3.0%/yr); year-one equity from $684 of loan paydown is wiped out by about $3k of value loss. Plan a longer hold.
Negotiation context
- It's been on market 156 days — a 12% lower offer ($87k) is reasonable based on typical stale-listing flexibility.
- 2 sale attempts since 15y ago; this cycle's ask has dropped $16k (14%) from the opening price — seller is motivated, your offer sets the floor, not the list.
- Current owner paid $24k; list at $99k implies a 321% gain — meaningful room to come down on a strong offer.
Risks & watch-outs
- Watch-outs: HOA is 32% of rent.
- Climate carrying-cost: major wind risk, 46% chance of damaging wind over 30y — expect insurance premiums to compound above CPI over the hold.
Questions for the listing agent
- It's been on market 156 days. Have you received any prior offers? Is the seller open to a 12% concession, seller financing, or rate buy-down credit?
- Built in 1971 — when were the roof, HVAC, electrical panel, plumbing, and water heater last replaced?
- What does the HOA fee cover, when was the last increase, and are there any pending special assessments or reserve-fund shortfalls?
- Why hasn't it sold? Are there any deal-killer items the seller is aware of (foundation, flood, title, zoning, code violations)?
- Is there a deadline driving the sale (1031 exchange, divorce, estate, relocation)? That informs how much negotiation room exists.
- What's the average days-on-market for RENTAL listings here right now (not sales)? A rising rental-DOM trend means longer vacancies and softer asking-rent achievability than the comps imply.
- What's the recent tenant-quality profile in this submarket — average credit score on applications, eviction rate, late-payment / NSF rate, and stable-employment percentage? A property-management company in the area should have these aggregated.
- How much new for-sale + rental construction is in the pipeline within 1–3 miles? Heavy new supply typically softens prices + rents 12–24 months out; constrained supply supports both.
Investment metrics
- 1% rule
- 1.63% ✓
- Cap rate
- 7.95%
- Cash-on-cash
- 5.91%
- DSCR
- 1.26
- GRM
- 5.1
CMA / ARV
No comps found within radius.
Projected returns pro-forma
-3.0% appreciation · 3.0% rent growth · sell at horizon
- IRR
- -6.9%
- Equity multiple
- 0.75×
- Total profit
- $-7,050
- Equity at exit
- $14,761
- IRR
- 3.1%
- Equity multiple
- 1.23×
- Total profit
- $6,278
- Equity at exit
- $8,560
Cash invested: $27,720 (down + closing). Projections, not guarantees.
Landlord ↔ Tenant lean methodology
- Overall (STATE)
- 27 Tenant-Leaning
- State Connecticut
- 27 Tenant-Leaning · D+7
- County
- — inherits STATE
- City
- — inherits STATE
ZIP-level market 06268
- Home prices YoY
- -16.5%
- Active inventory
- 37
- Price-to-rent
- 5.1×
Monthly cashflow live
- Estimated rent
- $1,611 medium interval (Pro) →
- Mortgage (P&I)
- −$519
- Tax from tax record
- −$53 /mo · $637/yr
- Insurance
- −$41
- HOA
- −$523
- Vacancy / Maint / Mgmt
- −$338
- Net cashflow
- $136
Break-even live
UW: 25.0% down · 7.5% · 30yr · 1.5% tax · 5.0% vac · 8.0% maint · 8.0% mgmt
Financing live
Cash to close
- Down payment
- $24,750
- Closing costs
- $2,970
- Reserves months
- —
- Total cash needed
- —
Loan-product check · same deal, 3 products live
Conventional
25% down · 7.5% · 30yr
- Down + closing
- —
- Monthly P&I
- —
- Monthly cashflow
- —
- DSCR
- —
- Eligible?
- —
Personal DTI + credit; lowest rate.
DSCR
20% down · 8.5% · 30yr
- Down + closing
- —
- Monthly P&I
- —
- Monthly cashflow
- —
- DSCR
- —
- Eligible?
- —
No personal income docs; deal must DSCR.
Hard money
10% down · 12.0% · 12mo
- Down + closing
- —
- Monthly P&I
- —
- Monthly cashflow
- —
- DSCR
- —
- Eligible?
- —
Short-term bridge; refi at stabilization.
Rent comps 4 comps
| Address | Beds | Baths | Sqft | Rent | $/sqft | DOM | Units | Dist |
|---|---|---|---|---|---|---|---|---|
| 20 Dartmouth Rd Storrs, CT | 1.0 | 1.0 | 576 | $1,550 | $2.69 | 1d | 1 | 1.00mi |
| 64 Cheney Dr Storrs, CT | 1.0 | 1.0 | 525 | $1,750 | $3.33 | 11d | 1 | 1.21mi |
| 85 Cheney Dr Storrs, CT | 1.0 | 1.0 | 500 | $1,750 | $3.50 | 14d | 1 | 1.26mi |
| 380 Daleville Rd Willington, CT | 1.0 | 1.0 | 488 | $1,400 | $2.87 | 14d | 1 | 1.29mi |
HOA detail
- Monthly dues
- $523 · $6,276/yr
- Likely covers
- waterpool
Listing history 22 events
-
2026-06-18days on market $99,000 Active 156 DOM
-
2026-06-17days on market $99,000 Active 155 DOM
-
2026-06-16days on market $99,000 Active 154 DOM
-
2026-06-15days on market $99,000 Active 153 DOM
-
2026-06-14days on market $99,000 Active 151 DOM
-
2026-06-13days on market $99,000 Active 150 DOM
-
2026-06-10days on market $99,000 Active 148 DOM
-
2026-06-09days on market $99,000 Active 147 DOM
-
2026-06-08days on market $99,000 Active 146 DOM
-
2026-06-07days on market $99,000 Active 145 DOM
-
2026-06-03days on market $99,000 Active 141 DOM
-
2026-06-02days on market $99,000 Active 140 DOM
-
2026-06-01days on market $99,000 Active 139 DOM
-
2026-05-31days on market $99,000 Active 138 DOM
-
2026-05-31days on market $99,000 Active 137 DOM
-
2026-04-27price $99,000
-
2026-03-07price $105,000
-
2026-01-13$115,000 Active
-
2011-12-13soldstatus $23,500
-
2011-12-12soldstatus $23,500 253-char remark
Show marketing remark (253 chars)
12X52 two-bedroom mobile home features covered porch, thermopane tilt-out windows, central air, and more in 55+ jensen's community. Pool, clubhouse, activities. Buyer must be approved by jensen's. Monthly park fee $357 + water bill $31/mo. Small pet ok.
-
2011-10-01$23,500 253-char remark
Show marketing remark (253 chars)
12X52 two-bedroom mobile home features covered porch, thermopane tilt-out windows, central air, and more in 55+ jensen's community. Pool, clubhouse, activities. Buyer must be approved by jensen's. Monthly park fee $357 + water bill $31/mo. Small pet ok.
-
2010-07-29soldstatus $25,500
ⓘ Source: listings_history table (triggers on properties + properties_extension) + one-shot
backfill from property_details.listing_events for pre-trigger history.
Tax reassessment forecast CT · Partial reset (capped growth)
- Current annual tax
- $637 · $53/mo
- Projected year-2 tax
- $1,378 · $115/mo
- Expected delta
- +$741/yr (+$62/mo · 116.3%)
ⓘ Screening estimate from a state-policy table — verify with the county assessor before closing.
Climate risk First Street
- Flood 1/10 Low FEMA zone X · 0% chance over 30 yrs
- Wildfire 3/10 Moderate
- Heat 4/10 Moderate 7 d/yr ≥94°F today · 16 d/yr by 30 yrs out
- Wind 6/10 Major 46% chance of damaging wind over 30 yrs
- Air quality 3/10 Moderate 3 unhealthy d/yr today · 4 by 30 yrs out
Nearby sold comps map
Loading sold comps map…
Walkable amenities ~0.75 mi
Loading nearby amenities…
Taxation est. · year 1
- Rental income
- $19,336
- − Mortgage interest
- −$5,546
- − Property taxes
- −$637
- − Insurance
- −$495
- − Repairs & maintenance
- −$1,547
- − Management
- −$1,547
- − HOA
- −$6,276
- − Depreciation
- −$2,880
- Taxable income
- $408
- Est. tax owed @ 24.0%
- −$98
- After-tax cash flow
- $1,539/yr
For passive investors: Depreciation is non-cash, so a rental often shows a tax loss while cash-flowing — sheltering income. Rental losses are passive: they offset passive income freely, and up to $25,000/yr can offset ordinary (W-2) income if you actively participate and your MAGI is under $100k (phasing out to $0 by $150k); unused losses carry forward. On sale, claimed depreciation is recaptured at up to 25%, and gains may owe capital-gains tax (a 1031 exchange can defer both). Figures are a year-1 estimate at your 24.0% rate — not tax advice; consult a CPA.
Schools (NCES district)
- District
- Mansfield School District
- NCES district ID
- 0902340
- Math proficiency
- 59% ▼ -12.00%
- Reading proficiency
- 70% ▼ -6.00%
- Median HH income
- $60,954
- Composite
- 55.81/100
- National rank
- #1209
- State rank
- #36 of 153 in CT
Livability — Mansfield
No livability data for this city. (Only ~50 U.S. cities are tracked.)
Census & demographics
- Census place
- Storrs, CT
- Population (ZIP)
- 10,782
Population outlook (Capitol County) Hauer SSP2
- By 2040
- 1,063,519
Race, ethnicity, and origin ACS 2023
- Neighborhood character
- Predominantly White (75%)
- Race & ethnicity
- White 75% Asian 12% Hispanic / Latino 6% Black 5% Two or more races 4%
- Hispanic origin (detail)
- Mexican 1% Puerto Rican 2%
- Common ancestry
- Lithuanian 6% Romanian 5% Slovak 3%
- Foreign-born
- 14% · China, Canada, Dominican Republic
- Languages at home
- 82% English-only · Chinese 6% Other Indo-European 4% Spanish 2%
Political lean MEDSL · Capitol
- 2024 margin
- Strong D (+21.9) · D 60.1% · R 38.2% · Other 1.7%
- All cycles
- 2024: D+21.9
Not yet ingested
- Civics
- —
Market trends
- HPI YoY
- ▼ -49.53%
- Current HPI
- 251.3467
- Rent YoY
- —
- Metro
- —
- State GDP YoY
- ▲ 1.06%
- F500 in state
- 38
Industry mix (Fortune 500 HQ in CT)
| Industry | F500 HQs | Revenue |
|---|---|---|
| Industrial Machinery | 4 | $38B |
|
||
| Insurance | 3 | $71B |
|
||
| Financial Services | 2 | $25B |
|
||
| Transportation / Logistics | 2 | $18B |
|
||
| Healthcare | 1 | $247B |
|
||
| Telecommunications | 1 | $55B |
|
||
Price history
+288.2% since first listed7 events — show timeline
- 2026-04-27 Price Changed $99,000 Smart MLS
- 2026-03-07 Price Changed $105,000 Smart MLS
- 2026-01-13 Listed $115,000 Smart MLS
- 2011-12-13 Sold (Public Records) $23,500 Public Records
- 2011-12-12 Sold (MLS) $23,500 Smart MLS
- 2011-10-01 Listed $23,500 Smart MLS
- 2010-07-29 Sold (Public Records) $25,500 Public Records
Property tax history
+1.8%/yrLatest (2023): $637 · +3.7% YoY. Source: county tax records.
Cash-flow waterfall
monthlySold comps — $/sqft
last 12 mo · ≤1 miLoading sold comps…