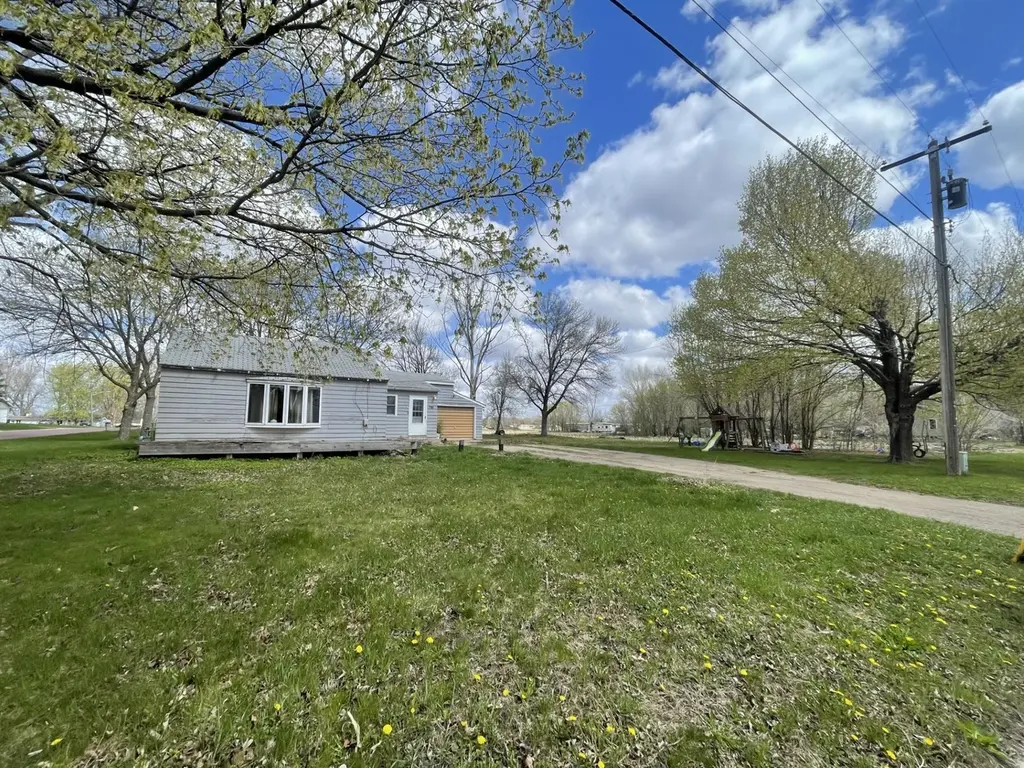
750 Greenwood Ave · Tracy, MN
Flood risk 1/10 · Minimal
- FEMA flood zone
- X (unshaded)
- Chance of flooding over 30 yrs
- 0.0%
- Est. flood insurance / yr
- $473 – $860
Fire risk 1/10 · Minimal
- Est. fire insurance / yr
- $888 – $1,650
Heat risk 2/10 · Minimal
- Hot days now (above 98°F)
- 7 days/yr
- Hot days in 30 yrs
- 15 days/yr
Wind risk 2/10 · Minimal
- Chance of severe wind over 30 yrs
- —
Air-quality risk 2/10 · Minimal
- Unhealthy air days now
- 1 days/yr
- Unhealthy air days in 30 yrs
- 1 days/yr
Risk factors via First Street. Map © Google.
Why this score? — see what drove the B grade
The composite is a weighted blend of 9 inputs, each scored 0–100. Each bar is that input's sub-score; the figure is the points it added to the 100-point composite (weight × sub-score).
- Cash flow +30.0/30.0
- 1% rule +10.0/10.0
- DSCR +10.0/10.0
- ARV discount +7.5/15.0
- Schools +5.0/10.0
- Livability +3.8/5.0
- Rent growth +2.5/5.0
- Condition / age +2.5/5.0
- Appreciation +0.0/10.0
$69,000
🖨 Deal sheet 📄 Offer letter ✓ Due diligence
Listing remarks
This is a great starter home with 3 bedroom, 1 bathroom, on a corner lot in a quiet part of town, within walking distance to the High School. The inside has a newer spacious kitchen shared with dining room, upgraded windows and a newer heating system. The main floor has a large living room with bay window, large bathroom with Laundry and 3 bedrooms. The Garage has a large shop room attached to the north. This home has a partially finished basement with room to grow! The owners are finishing up a couple projects in this home at this time.
Key facts
- Large living room
- Bay window
- Upgraded windows
Tags
Property features AI
Exterior
- Parking: Attached garage with gravel driveway; 1-car garage (approx. 14 x 24)
- Utilities: City water; City sewer; Natural gas; Electric service with circuit breakers (Xcel Energy)
- Home design: Residential property; One story; Main level entry
- Construction: Frame construction; Block foundation; Asphalt roof (over 8 years old); Basement: full, block construction with drainage system, sump pump and storage space
- Exterior features: Deck; Wood exterior; Storage shed; Corner lot; Medium tree coverage; City street frontage with paved streets, street lights and storm sewer; Public maintained road
Interior
- Kitchen: Dishwasher; Range; Refrigerator; Kitchen and dining combined (Kitchen/Dining Room)
- Bedrooms: 3 bedrooms — all on the main level; Primary bedroom on the main level
- Bathrooms: One full bath; Main floor 3/4 bath
- Heating & cooling: Forced air heating; Central air conditioning
- Interior features: All living facilities on one level; Main floor primary bedroom; Main floor laundry; Ceiling fan(s); Kitchen window
- Laundry & utility: Washer/dryer hookup; Laundry on main level
Neighborhood map
What this means for you Summary
Snapshot
- This is a 3-bed/1.0-bath single-family listed at $69k.
Deal economics
- At list price, monthly cash flow is $467 ($6k/yr) — positive.
- The deal already cash-flows at list — no discount required.
- Meets the 1% rule at list price ($1k rent vs $69k).
- Recommended offer: $68k (1.5% below list) — sets the bar for market timing.
Location & tenants
- Location reads 76/100 on livability (#170 in MN, #3,680 nationally) — a middle-class / working-renter tenant base. Strengths: cost of living A+, housing A+, health & safety A+; Watch: amenities F, commute F.
- Market conditions: 20 active listings in the ZIP; 91 units permitted in Lyon County in 2024 (72 in 5+ unit buildings).
Forward outlook
- Local home prices are declining (-3.0%/yr); year-one equity from $477 of loan paydown is wiped out by about $2k of value loss. Plan a longer hold.
- Lyon County population projected at -12% by 2050 — secular population decline; favor cash flow + early exit over multi-decade hold.
- At projected returns (-3.0% appreciation + 3.0% rent growth), your $19k cash investment doubles in ~5 years — after that, you're playing with house money.
Negotiation context
- It's been on market 16 days — a 2% lower offer ($68k) is reasonable based on typical stale-listing flexibility.
Risks & watch-outs
- Watch-outs: built in 1946 — expect roof / HVAC / electrical / plumbing capex.
Questions for the listing agent
- Built in 1946 — when were the roof, HVAC, electrical panel, plumbing, and water heater last replaced?
- Is there a deadline driving the sale (1031 exchange, divorce, estate, relocation)? That informs how much negotiation room exists.
- What's the average days-on-market for RENTAL listings here right now (not sales)? A rising rental-DOM trend means longer vacancies and softer asking-rent achievability than the comps imply.
- What's the recent tenant-quality profile in this submarket — average credit score on applications, eviction rate, late-payment / NSF rate, and stable-employment percentage? A property-management company in the area should have these aggregated.
- How much new for-sale + rental construction is in the pipeline within 1–3 miles? Heavy new supply typically softens prices + rents 12–24 months out; constrained supply supports both.
Investment metrics
- 1% rule
- 1.76% ✓
- Cap rate
- 14.41%
- Cash-on-cash
- 28.99%
- DSCR
- 2.29
- GRM
- 4.7
CMA / ARV
No comps found within radius.
Projected returns pro-forma
-3.0% appreciation · 3.0% rent growth · sell at horizon
- IRR
- 23.4%
- Equity multiple
- 1.96×
- Total profit
- $18,578
- Equity at exit
- $10,288
- IRR
- 31.3%
- Equity multiple
- 3.82×
- Total profit
- $54,574
- Equity at exit
- $5,966
Cash invested: $19,320 (down + closing). Projections, not guarantees.
Landlord ↔ Tenant lean methodology
- Overall (STATE)
- 46 Balanced
- State Minnesota
- 46 Balanced · D+2
- County
- — inherits STATE
- City
- — inherits STATE
ZIP-level market 56175
- Home prices YoY
- -22.1%
- Active inventory
- 20
- Price-to-rent
- 4.7×
Monthly cashflow live
- Estimated rent
- $1,214 medium interval (Pro) →
- Mortgage (P&I)
- −$362
- Tax from tax record
- −$101 /mo · $1,216/yr
- Insurance
- −$29
- HOA
- −$0
- Vacancy / Maint / Mgmt
- −$255
- Net cashflow
- $467
Break-even live
UW: 25.0% down · 7.5% · 30yr · 1.5% tax · 5.0% vac · 8.0% maint · 8.0% mgmt
Financing live
Cash to close
- Down payment
- $17,250
- Closing costs
- $2,070
- Reserves months
- —
- Total cash needed
- —
Loan-product check · same deal, 3 products live
Conventional
25% down · 7.5% · 30yr
- Down + closing
- —
- Monthly P&I
- —
- Monthly cashflow
- —
- DSCR
- —
- Eligible?
- —
Personal DTI + credit; lowest rate.
DSCR
20% down · 8.5% · 30yr
- Down + closing
- —
- Monthly P&I
- —
- Monthly cashflow
- —
- DSCR
- —
- Eligible?
- —
No personal income docs; deal must DSCR.
Hard money
10% down · 12.0% · 12mo
- Down + closing
- —
- Monthly P&I
- —
- Monthly cashflow
- —
- DSCR
- —
- Eligible?
- —
Short-term bridge; refi at stabilization.
Listing history 13 events
-
2026-06-19remarks 543-char remark
-
2026-06-19days on market $69,000 Active 16 DOM
-
2026-06-18days on market $69,000 Active 15 DOM
-
2026-06-17days on market $69,000 Active 14 DOM
-
2026-06-16days on market $69,000 Active 13 DOM
-
2026-06-15days on market $69,000 Active 12 DOM
-
2026-06-14days on market $69,000 Active 10 DOM
-
2026-06-12days on market $69,000 Active 9 DOM
-
2026-06-08days on market $69,000 Active 5 DOM
-
2026-06-07days on market $69,000 Active 4 DOM
-
2026-06-05days on market $69,000 Active 2 DOM
-
2026-06-04remarks 541-char remark
-
2026-06-04$69,000 Active 1 DOM
ⓘ Source: listings_history table (triggers on properties + properties_extension) + one-shot
backfill from property_details.listing_events for pre-trigger history.
Tax reassessment forecast MN · Partial reset (capped growth)
- Current annual tax
- $1,216 · $101/mo
- Projected year-2 tax
- $1,216 · $101/mo
- Expected delta
- $0/yr ($0/mo · 0.0%)
ⓘ Screening estimate from a state-policy table — verify with the county assessor before closing.
Climate risk First Street
- Flood 1/10 Low FEMA zone X (unshaded) · 0% chance over 30 yrs
- Wildfire 1/10 Low
- Heat 2/10 Low 7 d/yr ≥98°F today · 15 d/yr by 30 yrs out
- Wind 2/10 Low
- Air quality 2/10 Low 1 unhealthy d/yr today · 1 by 30 yrs out
Nearby sold comps map
Loading sold comps map…
Walkable amenities ~0.75 mi
Loading nearby amenities…
Taxation est. · year 1
- Rental income
- $14,563
- − Mortgage interest
- −$3,865
- − Property taxes
- −$1,216
- − Insurance
- −$345
- − Repairs & maintenance
- −$1,165
- − Management
- −$1,165
- − Depreciation
- −$2,007
- Taxable income
- $4,800
- Est. tax owed @ 24.0%
- −$1,152
- After-tax cash flow
- $4,450/yr
For passive investors: Depreciation is non-cash, so a rental often shows a tax loss while cash-flowing — sheltering income. Rental losses are passive: they offset passive income freely, and up to $25,000/yr can offset ordinary (W-2) income if you actively participate and your MAGI is under $100k (phasing out to $0 by $150k); unused losses carry forward. On sale, claimed depreciation is recaptured at up to 25%, and gains may owe capital-gains tax (a 1031 exchange can defer both). Figures are a year-1 estimate at your 24.0% rate — not tax advice; consult a CPA.
Schools (NCES district)
No district data.
Livability — Tracy
- Score
- 76/100
- State rank
- #170
- US rank
- #3680
Category grades
Schools grade is shown separately in the Schools card above.
Census & demographics
- Census place
- Tracy, MN
- Population (ZIP)
- 2,791
Population outlook (Lyon County) Hauer SSP2
- Today (2025)
- 25,369 people
- By 2030
- 24,890 · -1.9%
- By 2040
- 23,599 · -7.0%
- By 2050
- 22,383 · -11.8%
- By 2075
- 20,076 · -20.9%
- By 2100
- 18,901 · -25.5%
Race, ethnicity, and origin ACS 2023
- Neighborhood character
- Predominantly White (82%)
- Race & ethnicity
- White 82% Hispanic / Latino 7% Asian 7% Two or more races 5%
- Hispanic origin (detail)
- Mexican 7%
- Common ancestry
- Portuguese 16% Romanian 4% English 4%
- Foreign-born
- 4% · Canada
- Languages at home
- 89% English-only · Spanish 5% Other Asian/Pacific 5%
Political lean MEDSL · Lyon
- 2024 margin
- Solid R (+31.8) · D 33.1% · R 64.9% · Other 2.0%
- 2008→2024 swing
- -30.2pp toward R · 2008: -1.6pp · 2024: -31.8pp
- All cycles
- 2024: R+31.8 2020: R+25.9 2016: R+28.3 2012: R+9.2 2008: R+1.6
Not yet ingested
- Civics
- —
Market trends
- HPI YoY
- ▼ -47.45%
- Current HPI
- 167.4911
- Rent YoY
- —
- Metro
- —
- State GDP YoY
- ▲ 2.41%
- F500 in state
- 34
Industry mix (Fortune 500 HQ in MN)
| Industry | F500 HQs | Revenue |
|---|---|---|
| Healthcare | 2 | $407B |
|
||
| Retail | 2 | $150B |
|
||
| Consumer Goods | 2 | $32B |
|
||
| Industrial Machinery | 2 | $6B |
|
||
| Agriculture | 1 | $40B |
|
||
| Healthcare / Medical Devices | 1 | $32B |
|
||
Price history
1 event — show timeline
- 2026-06-03 Listed $69,000 NORTHSTARMLS as Distributed by MLS Grid
Property tax history
+2.8%/yrLatest (2026): $1,216 · +10.9% YoY. Source: county tax records.
Cash-flow waterfall
monthlySold comps — $/sqft
last 12 mo · ≤1 miLoading sold comps…