 Triplex
378 Montauk Ave · New York, NY
Flood risk 1/10 · Minimal
- FEMA flood zone
- X (unshaded)
- Chance of flooding over 30 yrs
- 0.0%
- Est. flood insurance / yr
- $507 – $1,088
Fire risk 1/10 · Minimal
- Est. fire insurance / yr
- $691 – $1,283
Heat risk 7/10 · Major
- Hot days now (above 99°F)
- 7 days/yr
- Hot days in 30 yrs
- 15 days/yr
Wind risk 6/10 · Moderate
- Chance of severe wind over 30 yrs
- 65.0%
Air-quality risk 5/10 · Moderate
- Unhealthy air days now
- 6 days/yr
- Unhealthy air days in 30 yrs
- 8 days/yr
Risk factors via First Street. Map © Google.
Why this score? — see what drove the A- grade
The composite is a weighted blend of 9 inputs, each scored 0–100. Each bar is that input's sub-score; the figure is the points it added to the 100-point composite (weight × sub-score).
- Cash flow +30.0/30.0
- ARV discount +15.0/15.0
- 1% rule +10.0/10.0
- DSCR +10.0/10.0
- Schools +5.0/10.0
- Rent growth +4.0/5.0
- Livability +3.8/5.0
- Condition / age +2.5/5.0
- Appreciation +0.0/10.0
$740,900
🖨 Deal sheet (PDF) 📄 Offer letter ✓ Due diligence
Multi-family units
County records classify this as Multi-Family (2-4 Unit). Listing-text estimate: 3 units. confirmed
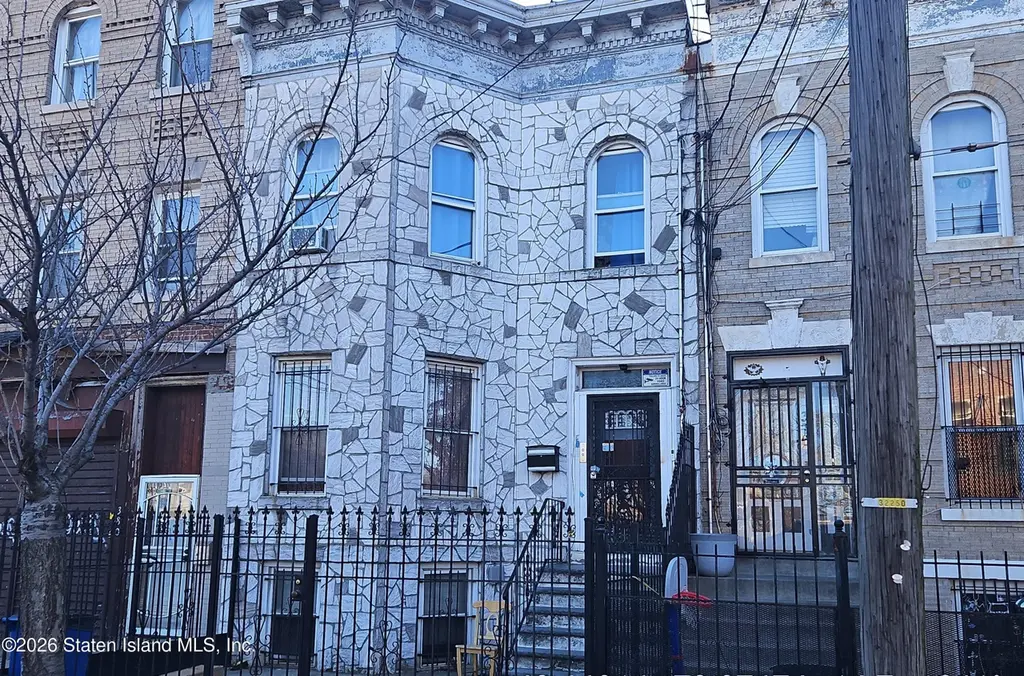
Listing remarks
* * * AUCTION EVENT ENDING MAY 29TH BID NOW 3 DAYS LEFT * * * for this Stone exterior 3 family Attached home In the East New York part of Brooklyn. This property features 9 bedrooms and 3 Full baths with good rent roll potential. No Financing available at this time. Please do not disturb the occupants. For more information you can visit the website at Hubzu.com or call Listing Agent. Click on link below to take you to the Auction. For more information contact Listing Agent https://www. hubzu.com/property/00016723369-Brooklyn-NY-11208
Key facts
- 2,000 sq ft lot
- Built 1901
- Listed 48 days
Property features AI
Finance
- Other: Property condition listed as fair; Directions: GPS address available (378 Montauk Ave, Brooklyn, NY 11208)
- Financial info: Parcel number 04071-2027
Exterior
- Parking: On-street parking
- Utilities: 110V electric
- Home design: Multi-family property with 3 total units; Two-story building; Approximate year built
- Construction: Brick and stone construction; Building area about 3,072 (listed)
- Exterior features: Lot roughly 20 x 100 (approx. 0.05 acres); Zoned R5
Interior
- Bedrooms: Three 3-bedroom units (one unit listed on level 2)
- Bathrooms: Three full bathrooms total (each of two units listed with 1 bath; overall 3 full baths)
- Heating & cooling: Natural gas heating; Steam heating; Cooling present
- Interior features: Partially finished basement
Neighborhood map
What this means for you Summary
Snapshot
- This is a 3 × 3-bed/1.0-bath units multifamily listed at $741k.
Deal economics
- At list price, monthly cash flow is $4k ($51k/yr) — positive. Per door: $1k/mo.
- The deal already cash-flows at list — no discount required.
- Meets the 1% rule at list price ($11k rent vs $741k).
- Recommended offer: $719k (3.0% below list) — sets the bar for market timing.
- Cap rate 13.1% vs local median 2.6% in New York — top-decile yield for the area; either an underpriced asset or a hidden risk that comps aren't pricing in. Stress-test before assuming the spread holds.
Location & tenants
- Location reads 75/100 on livability (#268 in NY, #4,188 nationally) — a middle-class / working-renter tenant base. Strengths: amenities A+, commute A+, health & safety A; Watch: crime F, cost of living F.
- Market conditions: Rents rising fast (+6.1%/yr); 192 active listings in the ZIP; 10,063 units permitted in Kings County in 2024 (9,789 in 5+ unit buildings).
- At $11,105/mo this rent would consume 215% of the median local household income ($62k/yr) (locally 7574% of renters already pay >50% of income on rent) — very limited rent-growth headroom before tenants either downsize or default.
Forward outlook
- Local home prices are declining (-3.0%/yr); year-one equity from $5k of loan paydown is wiped out by about $22k of value loss. Plan a longer hold.
- Kings County population projected at +13% by 2050 — modest demand growth; plan on rents tracking national, not racing it.
- At projected returns (-3.0% appreciation + 6.1% rent growth), your $207k cash investment doubles in ~5 years — after that, you're playing with house money.
Negotiation context
- It's been on market 48 days — a 3% lower offer ($719k) is reasonable based on typical stale-listing flexibility.
- 6 sale attempts since 8y ago with the ask held roughly flat each time — persistent listings suggest the price (not the market) is what's stuck; bring a comps-based counter.
Risks & watch-outs
- Watch-outs: built in 1901 — expect roof / HVAC / electrical / plumbing capex.
- Climate carrying-cost: major wind risk, 65% chance of damaging wind over 30y; extreme-heat days projected 7→15/yr by 2055 (HVAC capex compounding) — expect insurance premiums to compound above CPI over the hold.
Questions for the listing agent
- It's been on market 48 days. Have you received any prior offers? Is the seller open to a 3% concession, seller financing, or rate buy-down credit?
- Can we see the unit-by-unit rent roll, current vacancy, and any below-market leases? What's the average tenancy length?
- What capital expenditures (roof, boiler, parking lot, exteriors) have been made in the last 5 years, and what's planned in the next 2?
- Built in 1901 — when were the roof, HVAC, electrical panel, plumbing, and water heater last replaced?
- Is there a deadline driving the sale (1031 exchange, divorce, estate, relocation)? That informs how much negotiation room exists.
- Schools are B-rated — typically a magnet for longer-tenancy family renters. What's the average tenant stay here, and is there a school-zone premium baked into asking?
- Crime grade is F in this area — have there been break-ins, vandalism, or insurance claims at this property in the last 3 years? What carrier currently insures it and at what premium?
- What's the average days-on-market for RENTAL listings here right now (not sales)? A rising rental-DOM trend means longer vacancies and softer asking-rent achievability than the comps imply.
- What's the recent tenant-quality profile in this submarket — average credit score on applications, eviction rate, late-payment / NSF rate, and stable-employment percentage? A property-management company in the area should have these aggregated.
- How much new apartment / multifamily construction is in the pipeline within 1–3 miles? Heavy new supply (>2% of stock underway) typically softens rents 12–24 months out; light construction supports rent growth.
Investment metrics
- 1% rule
- 1.50% ✓
- Cap rate
- 13.12%
- Cash-on-cash
- 24.37%
- DSCR
- 2.08
- GRM
- 5.6
CMA / ARV
- ARV (on-the-fly)
- $1,152,000
- Comps found
- 10
Show comp detail 10 sales within ~0.75 mi
| Address | Dist | Beds/Ba | Sqft | Sold | Price | $/sf | Match |
|---|---|---|---|---|---|---|---|
| 369 Milford St | 0.09mi | 8/1.0 (-1) | 3,198 (+4%) | 5mo | $1,200,000 | $375 | 72 |
| 1017 Dumont Ave | 0.22mi | 8/4.0 (-1) | 3,116 (+1%) | 17mo | $618,500 | $198 | 64 |
| 301 Montauk Ave | 0.15mi | 8/3.0 (-1) | 2,730 (-11%) | 11mo | $985,000 | $361 | 60 |
| 448 Ashford St #3 | 0.43mi | 8/5.0 (-1) | 2,970 (-3%) | 3mo | $1,250,000 | $421 | 59 |
| 387 Jerome St | 0.54mi | 9/5.0 | 2,934 (-4%) | 1mo | $1,175,000 | $400 | 58 |
| 1140 Sutter Ave | 0.21mi | 8/3.0 (-1) | 3,420 (+11%) | 19mo | $694,785 | $203 | 51 |
| 590 Liberty Ave | 0.73mi | 8/3.0 (-1) | 3,240 (+6%) | 7mo | $1,050,000 | $324 | 46 |
| 390 Essex St | 0.46mi | 8/5.0 (-1) | 2,812 (-8%) | 8mo | $1,140,000 | $405 | 44 |
| 758 Livonia Ave | 0.68mi | 8/4.0 (-1) | 2,775 (-10%) | 20mo | $965,000 | $348 | 27 |
| 306 Sheridan Ave | 0.67mi | 8/5.0 (-1) | 2,652 (-14%) | 19mo | $1,000,000 | $377 | 17 |
Match score weights: distance 35% · size 25% · config 20% · recency 20%. Top-matched comps best support the ARV.
Projected returns pro-forma
-3.0% appreciation · 6.14% rent growth · sell at horizon
- IRR
- 21.0%
- Equity multiple
- 1.89×
- Total profit
- $184,326
- Equity at exit
- $110,471
- IRR
- 31.0%
- Equity multiple
- 4.20×
- Total profit
- $663,757
- Equity at exit
- $64,059
Cash invested: $207,452 (down + closing). Projections, not guarantees.
Landlord ↔ Tenant lean methodology
- Overall (CITY)
- 0 Strongly Tenant-Friendly
- State New York
- 15 Strongly Tenant-Friendly · D+10
- County
- — inherits STATE
- City New York
- 0 Strongly Tenant-Friendly · D+34
ZIP-level market 11208
- Rents YoY
- 6.1%
- Active inventory
- 192
- Price-to-rent
- 16.7×
Monthly cashflow live
- Estimated rent
- $11,105 high interval (Pro) →
- Mortgage (P&I)
- −$3,885
- Tax from tax record
- −$365 /mo · $4,382/yr
- Insurance
- −$309
- HOA
- −$0
- Vacancy / Maint / Mgmt
- −$2,332
- Net cashflow
- $4,214
Break-even live
Sensitivity live
| Price | -10% $4,633 | -5% $4,423 | +0% $4,214 | +5% $4,004 | +10% $3,794 |
|---|---|---|---|---|---|
| Rent | -10% $3,336 | -5% $3,775 | +0% $4,214 | +5% $4,652 | +10% $5,091 |
| Rate | -1.0pp $4,587 | -0.5pp $4,402 | base $4,214 | +0.5pp $4,022 | +1.0pp $3,826 |
3-unit breakdown (identical units grouped — click to expand)
| Units | Beds | Baths | Est. rent |
|---|---|---|---|
| 3× units | 3 | 1 | $11,106 |
| #1 | 3 | 1 | $3,702 |
| #2 | 3 | 1 | $3,702 |
| #3 | 3 | 1 | $3,702 |
| Total (3 units) | $11,105 | ||
UW: 25.0% down · 7.5% · 30yr · 1.5% tax · 5.0% vac · 8.0% maint · 8.0% mgmt
Financing live
Cash to close
- Down payment
- $185,225
- Closing costs
- $22,227
- Reserves months
- —
- Total cash needed
- —
Loan-product check · same deal, 3 products live
Conventional
25% down · 7.5% · 30yr
- Down + closing
- —
- Monthly P&I
- —
- Monthly cashflow
- —
- DSCR
- —
- Eligible?
- —
Personal DTI + credit; lowest rate.
DSCR
20% down · 8.5% · 30yr
- Down + closing
- —
- Monthly P&I
- —
- Monthly cashflow
- —
- DSCR
- —
- Eligible?
- —
No personal income docs; deal must DSCR.
Hard money
10% down · 12.0% · 12mo
- Down + closing
- —
- Monthly P&I
- —
- Monthly cashflow
- —
- DSCR
- —
- Eligible?
- —
Short-term bridge; refi at stabilization.
Listing history 30 events
-
2026-06-18days on market $740,900 Active 48 DOM
-
2026-06-17days on market $740,900 Active 47 DOM
-
2026-06-16days on market $740,900 Active 46 DOM
-
2026-06-15days on market $740,900 Active 45 DOM
-
2026-06-13days on market $740,900 Active 43 DOM
-
2026-06-10days on market $740,900 Active 39 DOM
-
2026-06-08days on market $740,900 Active 38 DOM
-
2026-06-08days on market $740,900 Active 37 DOM
-
2026-06-04days on market $740,900 Active 34 DOM
-
2026-06-03days on market $740,900 Active 33 DOM
-
2026-06-01days on market $740,900 Active 31 DOM
-
2026-05-31days on market $740,900 Active 30 DOM
-
2026-04-30$740,900 Active
-
2026-04-28historical
-
2025-03-07$740,900 Active
-
2025-03-06historical
-
2024-10-10status Active
-
2024-04-25status Pending
-
2023-06-23price $740,900
-
2023-05-23price $779,800
-
2023-04-21price $820,800
-
2023-03-22$863,900 Active
-
2019-09-03historical
-
2019-01-09price $560,000
-
2018-09-26price $579,000
-
2018-09-07status Listing Extended
-
2018-09-07historical
-
2018-09-04price $615,000
-
2018-08-08price $649,000
-
2018-06-06$679,000 New
ⓘ Source: listings_history table (triggers on properties + properties_extension) + one-shot
backfill from property_details.listing_events for pre-trigger history.
Tax reassessment forecast NY · Partial reset (capped growth)
- Current annual tax
- $4,382 · $365/mo
- Projected year-2 tax
- $8,452 · $704/mo
- Expected delta
- +$4,070/yr (+$339/mo · 92.9%)
ⓘ Screening estimate from a state-policy table — verify with the county assessor before closing.
Climate risk First Street
- Flood 1/10 Low FEMA zone X (unshaded) · 0% chance over 30 yrs
- Wildfire 1/10 Low
- Heat 7/10 Severe 7 d/yr ≥99°F today · 15 d/yr by 30 yrs out
- Wind 6/10 Major 65% chance of damaging wind over 30 yrs
- Air quality 5/10 Major 6 unhealthy d/yr today · 8 by 30 yrs out
Nearby sold comps map
Loading sold comps map…
Walkable amenities ~0.75 mi
Loading nearby amenities…
Taxation est. · year 1
- Rental income
- $133,260
- − Mortgage interest
- −$41,502
- − Property taxes
- −$4,382
- − Insurance
- −$3,704
- − Repairs & maintenance
- −$10,661
- − Management
- −$10,661
- − Depreciation
- −$21,553
- Taxable income
- $40,796
- Est. tax owed @ 24.0%
- −$9,791
- After-tax cash flow
- $40,773/yr
For passive investors: Depreciation is non-cash, so a rental often shows a tax loss while cash-flowing — sheltering income. Rental losses are passive: they offset passive income freely, and up to $25,000/yr can offset ordinary (W-2) income if you actively participate and your MAGI is under $100k (phasing out to $0 by $150k); unused losses carry forward. On sale, claimed depreciation is recaptured at up to 25%, and gains may owe capital-gains tax (a 1031 exchange can defer both). Figures are a year-1 estimate at your 24.0% rate — not tax advice; consult a CPA.
Schools (NCES district)
No district data.
Livability — New York
- Score
- 75/100
- State rank
- #268
- US rank
- #4188
Category grades
Schools grade is shown separately in the Schools card above.
Census & demographics
- Census place
- New York, NY
- County
- Kings County · 2,614,986 people
- City population
- 7,731,280
- Metro
- New York-Newark-Jersey City, NY-NJ-PA
- Population (ZIP)
- 105,428
- Household income
- $62,077
- Rent vs Own
- Severe rent burden
- 7574.0
Population outlook (Kings County) Hauer SSP2
- Today (2025)
- 2,847,441 people
- By 2030
- 2,937,006 · +3.1%
- By 2040
- 3,095,491 · +8.7%
- By 2050
- 3,228,968 · +13.4%
- By 2075
- 3,321,723 · +16.7%
- By 2100
- 3,111,387 · +9.3%
Race, ethnicity, and origin ACS 2023
- Neighborhood character
- Diverse neighborhood (Simpson 0.66)
- Race & ethnicity
- Black 42% Hispanic / Latino 39% Asian 10% Two or more races 8% White 3%
- Hispanic origin (detail)
- Mexican 2% Puerto Rican 9% Dominican 16%
- Common ancestry
- Hispanic 1%
- Foreign-born
- 40% · Canada, China, Mexico
- Languages at home
- 48% English-only · Spanish 36% Other Indo-European 11% French/Haitian/Cajun 1%
Political lean MEDSL · Kings
- 2024 margin
- Solid D (+44.0) · D 72.0% · R 28.0%
- 2008→2024 swing
- -15.5pp toward R · 2008: 59.4pp · 2024: 44.0pp
- All cycles
- 2024: D+44.0 2020: D+54.8 2016: D+61.8 2012: D+63.9 2008: D+59.4
Not yet ingested
- Civics
- —
Market trends
- HPI YoY
- ▼ -546.38%
- Current HPI
- 376.1489
- Rent YoY
- ▲ 6.14%
- Metro
- New York-Newark-Jersey City, NY-NJ-PA
- State GDP YoY
- ▲ 2.60%
- F500 in state
- 92
Industry mix (Fortune 500 HQ in NY)
| Industry | F500 HQs | Revenue |
|---|---|---|
| Financial Services | 10 | $950B |
|
||
| Consumer Goods | 9 | $162B |
|
||
| Insurance | 4 | $225B |
|
||
| Telecommunications | 2 | $144B |
|
||
| Pharmaceuticals | 2 | $112B |
|
||
| Media / Entertainment | 2 | $69B |
|
||
Price history
+9.1% since first listed18 events — show timeline
- 2026-04-30 Listed $740,900 SIBORMLS
- 2026-04-28 Listing Removed — SIBORMLS
- 2025-03-07 Listed $740,900 SIBORMLS
- 2025-03-06 Listing Removed — OneKey® MLS as Distributed by MLS Grid
- 2024-10-10 Relisted — OneKey® MLS as Distributed by MLS Grid
- 2024-04-25 Pending — OneKey® MLS as Distributed by MLS Grid
- 2023-06-23 Price Changed $740,900 OneKey® MLS as Distributed by MLS Grid
- 2023-05-23 Price Changed $779,800 OneKey® MLS as Distributed by MLS Grid
- 2023-04-21 Price Changed $820,800 OneKey® MLS as Distributed by MLS Grid
- 2023-03-22 Listed $863,900 OneKey® MLS as Distributed by MLS Grid
- 2019-09-03 Listing Removed — OneKey® MLS as Distributed by MLS Grid
- 2019-01-09 Price Changed $560,000 OneKey® MLS as Distributed by MLS Grid
- 2018-09-26 Price Changed $579,000 OneKey® MLS as Distributed by MLS Grid
- 2018-09-07 Relisted — OneKey® MLS as Distributed by MLS Grid
- 2018-09-07 Listing Removed — OneKey® MLS as Distributed by MLS Grid
- 2018-09-04 Price Changed $615,000 OneKey® MLS as Distributed by MLS Grid
- 2018-08-08 Price Changed $649,000 OneKey® MLS as Distributed by MLS Grid
- 2018-06-06 Listed $679,000 OneKey® MLS as Distributed by MLS Grid
Property tax history
+6.4%/yrLatest (2025): $4,382 · -1.6% YoY. Source: county tax records.
Cash-flow waterfall
monthlySold comps — $/sqft
last 12 mo · ≤1 miLoading sold comps…