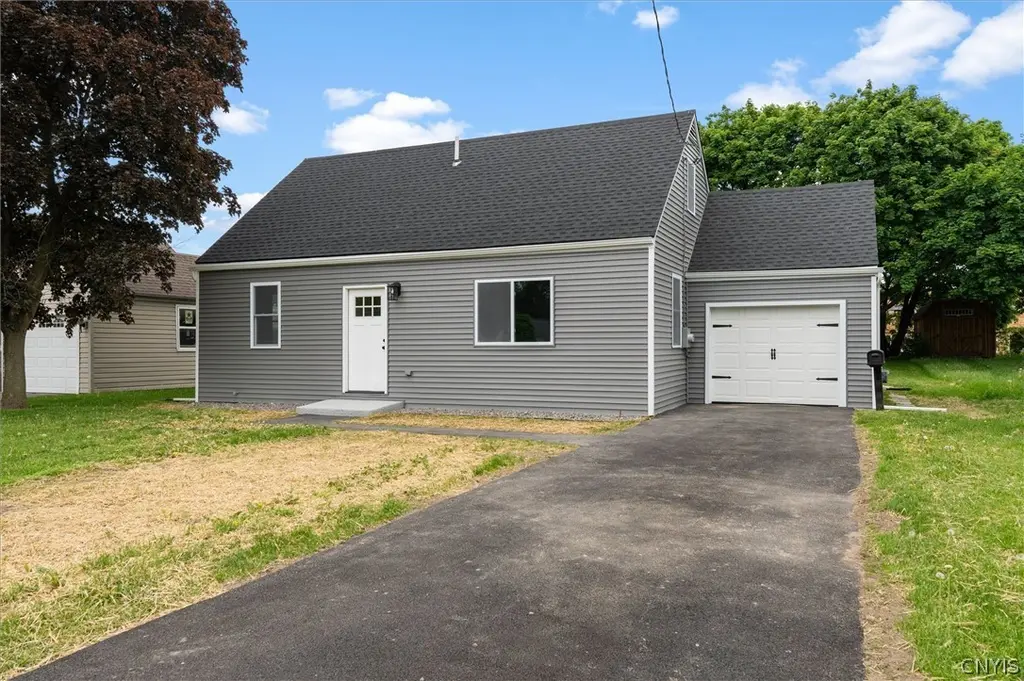
19 Grover St · East Syracuse, NY
Flood risk 1/10 · Minimal
- FEMA flood zone
- X (unshaded)
- Chance of flooding over 30 yrs
- 0.0%
- Est. flood insurance / yr
- $507 – $1,088
Fire risk 1/10 · Minimal
- Est. fire insurance / yr
- $691 – $1,283
Heat risk 3/10 · Minor
- Hot days now (above 95°F)
- 7 days/yr
- Hot days in 30 yrs
- 16 days/yr
Wind risk 1/10 · Minimal
- Chance of severe wind over 30 yrs
- 0.0%
Air-quality risk 2/10 · Minimal
- Unhealthy air days now
- 0 days/yr
- Unhealthy air days in 30 yrs
- 1 days/yr
Risk factors via First Street. Map © Google.
Why this score? — see what drove the D- grade
The composite is a weighted blend of 9 inputs, each scored 0–100. Each bar is that input's sub-score; the figure is the points it added to the 100-point composite (weight × sub-score).
- Cash flow +13.2/30.0
- 1% rule +4.6/10.0
- Livability +4.5/5.0
- Schools +4.3/10.0
- DSCR +4.0/10.0
- Rent growth +2.5/5.0
- Condition / age +2.5/5.0
- ARV discount +1.5/15.0
- Appreciation +0.0/10.0
$229,900
🖨 Deal sheet (PDF) 📄 Offer letter ✓ Due diligence
Listing remarks
Beautifully renovated and charming 3 bedroom, 1 bath Cape Cod awaits a new owner! Enjoy a modern kitchen with stainless steel appliances and stylish finishes perfect for all your upcoming holiday meals. With completely updated bathrooms, fresh interior paint, and new flooring throughout, this home is a great way to start fresh! Nothing to do but simply move right in and call it home!
Key facts
- Renovated
- New flooring
- Updated bathrooms
Tags
Property features AI
Exterior
- Parking: Attached garage (1 car)
- Utilities: Public water connected; Sewer connected; Cable available; High-speed internet available
- Home design: Single-story home; Resale property; Vinyl siding; Rectangular residential lot with approximately 60 x 147 dimensions, city street frontage
- Construction: Spray foam insulation; Vinyl siding
- Exterior features: Blacktop driveway; Deck
Interior
- Kitchen: Gas oven; Gas range; Microwave; Refrigerator
- Bedrooms: Two main-level bedrooms; Total of 9 rooms including bedrooms, living room, and laundry
- Flooring: Luxury vinyl
- Bathrooms: One full bathroom (on main level)
- Heating & cooling: Gas heating; Central air conditioning
- Interior features: Separate/formal living room; Combined living and dining area; Bedroom on main level; Crawl space basement
- Laundry & utility: Upper-level laundry; Gas water heater
Neighborhood map
What this means for you Summary
Snapshot
- This is a 3-bed/1.0-bath single-family listed at $230k.
Deal economics
- At list price, monthly cash flow is $-3 ($-38/yr) — negative.
- To cash-flow at today's rent, offer at most $229k (0.2% below list).
- To meet the 1% rule (rent ≥ 1% of price), the offer needs to be $221k (4.1% below list).
- Recommended offer: $221k (4.1% below list) — sets the bar for 1% rule.
Location & tenants
- Location reads 90/100 on livability (#4 in NY, #81 nationally) — a professional / high-income tenant draw. Strengths: amenities A+, commute A+, cost of living A+.
- East Syracuse Minoa Central School District (rural): math 46% / reading 53% proficiency, ranked #379 of 590 in NY (top 64%) — families likely to look elsewhere, expect single-tenant / working-renter base with shorter leases.
- Zoned schools: Woodland Elementary School (math 52% / reading 62%, grade C+, #842 of 2,108 statewide, top 43%, 291 students, 82% FRL); Pine Grove Middle School (math 29% / reading 49%, grade F, #433 of 729 statewide, top 60%, 672 students, 43% FRL); East Syracuse Minoa Central High School (math 97% / reading 87%, grade A+, #171 of 1,100 statewide, top 18%, 1,183 students, 60% FRL) — zoned schools average 62% FRL vs 29% district-wide (33 pts higher); higher-poverty schools than district average — tighter screening recommended.
- Zoned-school proficiency averages 63% at this address vs 50% district-wide (+13 pts) — the actual schools serving this property are materially stronger than the East Syracuse Minoa Central School District average implies; a family-tenant draw the district grade alone would hide.
- Market conditions: 59 active listings in the ZIP; 2 comparable units currently listed for rent nearby; solid renter incomes; 616 units permitted in Onondaga County in 2024 (256 in 5+ unit buildings).
- This rent runs 33% of the median local income ($81k/yr) — at the standard rent-burdened threshold; future hikes will face affordability resistance.
Forward outlook
- Local home prices are declining (-3.0%/yr); year-one equity from $2k of loan paydown is wiped out by about $7k of value loss. Plan a longer hold.
- Onondaga County population projected to shrink 9% by 2050 — rents likely to lag national; underwrite the cash flow, not the appreciation.
Negotiation context
- Only 10 days on market — expect competitive offers; lowballing is unlikely to land.
- Current owner paid $40k; list at $230k implies a 475% gain — meaningful room to come down on a strong offer.
Risks & watch-outs
- Watch-outs: built in 1950 — expect roof / HVAC / electrical / plumbing capex.
Questions for the listing agent
- What do current leases actually rent for vs. the listed asking? Can we see a recent rent roll and the last 12 months of T-12 income?
- Built in 1950 — when were the roof, HVAC, electrical panel, plumbing, and water heater last replaced?
- Is there a deadline driving the sale (1031 exchange, divorce, estate, relocation)? That informs how much negotiation room exists.
- Schools are D-rated, which usually means shorter tenancies and higher turnover. Who's the typical renter profile here, and what's been the actual vacancy rate?
- The area grade is low — what's the realistic commute time and amenity access for the typical tenant pool here? Any planned neighborhood developments (good or bad) we should know about?
- What's the average days-on-market for RENTAL listings here right now (not sales)? A rising rental-DOM trend means longer vacancies and softer asking-rent achievability than the comps imply.
- What's the recent tenant-quality profile in this submarket — average credit score on applications, eviction rate, late-payment / NSF rate, and stable-employment percentage? A property-management company in the area should have these aggregated.
- How much new for-sale + rental construction is in the pipeline within 1–3 miles? Heavy new supply typically softens prices + rents 12–24 months out; constrained supply supports both.
Investment metrics
- 1% rule
- 0.96% ✗
- Cap rate
- 6.28%
- Cash-on-cash
- -0.06%
- DSCR
- 1.00
- GRM
- 8.7
CMA / ARV
- ARV (on-the-fly)
- $202,752
- Comps found
- 12
Show comp detail 12 sales within ~0.75 mi
| Address | Dist | Beds/Ba | Sqft | Sold | Price | $/sf | Match |
|---|---|---|---|---|---|---|---|
| 5 Wyncrest Dr | 0.05mi | 3/1.0 | 1,188 (+3%) | 10mo | $220,000 | $185 | 84 |
| 7 Parkwood Dr | 0.24mi | 3/1.0 | 1,188 (+3%) | 4mo | $184,900 | $156 | 80 |
| 109 Cole Rd | 0.24mi | 3/2.0 | 1,128 (-2%) | 4mo | $256,000 | $227 | 78 |
| 809 Kinne St | 0.47mi | 3/1.0 | 1,133 (-2%) | 9mo | $199,900 | $176 | 68 |
| 901 Kinne St | 0.45mi | 3/1.0 | 1,080 (-6%) | 8mo | $149,900 | $139 | 62 |
| 103 Grover St | 0.40mi | 3/2.0 | 1,060 (-8%) | 6mo | $265,000 | $250 | 59 |
| 100 Nelson Ave | 0.57mi | 3/1.0 | 1,092 (-5%) | 8mo | $250,000 | $229 | 58 |
| 501 N Highland Ave | 0.41mi | 3/1.0 | 1,253 (+9%) | 11mo | $244,000 | $195 | 57 |
| 104 Lansdale Rd | 0.20mi | 2/1.0 (-1) | 1,301 (+13%) | 10mo | $193,000 | $148 | 55 |
| 301 Winchester Rd | 0.68mi | 3/1.0 | 1,210 (+5%) | 8mo | $148,000 | $122 | 53 |
| 316 Colfax Ave | 0.38mi | 4/2.0 (+1) | 1,302 (+13%) | 7mo | $201,400 | $155 | 46 |
| 815 Kinne St | 0.46mi | 4/2.0 (+1) | 1,312 (+14%) | 9mo | $172,000 | $131 | 39 |
Match score weights: distance 35% · size 25% · config 20% · recency 20%. Top-matched comps best support the ARV.
Projected returns pro-forma
-3.0% appreciation · 3.0% rent growth · sell at horizon
- IRR
- -16.3%
- Equity multiple
- 0.42×
- Total profit
- $-37,326
- Equity at exit
- $34,279
- IRR
- -7.9%
- Equity multiple
- 0.50×
- Total profit
- $-32,236
- Equity at exit
- $19,878
Cash invested: $64,372 (down + closing). Projections, not guarantees.
Landlord ↔ Tenant lean methodology
- Overall (STATE)
- 15 Strongly Tenant-Friendly
- State New York
- 15 Strongly Tenant-Friendly · D+10
- County
- — inherits STATE
- City
- — inherits STATE
ZIP-level market 13057
- Home prices YoY
- -11.1%
- Active inventory
- 59
- Price-to-rent
- 8.7×
Monthly cashflow live
- Estimated rent
- $2,206 medium interval (Pro) →
- Mortgage (P&I)
- −$1,206
- Tax from tax record
- −$444 /mo · $5,331/yr
- Insurance
- −$96
- HOA
- −$0
- Vacancy / Maint / Mgmt
- −$463
- Net cashflow
- $-3
Break-even live
Sensitivity live
| Price | -10% $127 | -5% $62 | +0% $-3 | +5% $-68 | +10% $-133 |
|---|---|---|---|---|---|
| Rent | -10% $-177 | -5% $-90 | +0% $-3 | +5% $84 | +10% $171 |
| Rate | -1.0pp $113 | -0.5pp $55 | base $-3 | +0.5pp $-63 | +1.0pp $-123 |
UW: 25.0% down · 7.5% · 30yr · 1.5% tax · 5.0% vac · 8.0% maint · 8.0% mgmt
Financing live
Cash to close
- Down payment
- $57,475
- Closing costs
- $6,897
- Reserves months
- —
- Total cash needed
- —
Loan-product check · same deal, 3 products live
Conventional
25% down · 7.5% · 30yr
- Down + closing
- —
- Monthly P&I
- —
- Monthly cashflow
- —
- DSCR
- —
- Eligible?
- —
Personal DTI + credit; lowest rate.
DSCR
20% down · 8.5% · 30yr
- Down + closing
- —
- Monthly P&I
- —
- Monthly cashflow
- —
- DSCR
- —
- Eligible?
- —
No personal income docs; deal must DSCR.
Hard money
10% down · 12.0% · 12mo
- Down + closing
- —
- Monthly P&I
- —
- Monthly cashflow
- —
- DSCR
- —
- Eligible?
- —
Short-term bridge; refi at stabilization.
Rent comps 2 comps
| Address | Beds | Baths | Sqft | Rent | $/sqft | DOM | Units | Dist |
|---|---|---|---|---|---|---|---|---|
| 297 Norwood Ave Syracuse, NY | 3.0 | 1.0 | 1188 | $2,050 | $1.73 | 22d | 1 | 1.25mi |
| 225 Marlborough Rd Syracuse, NY | 2.0 | 1.0 | 1040 | $1,800 | $1.73 | 15d | 1 | 1.40mi |
Listing history 6 events
-
2026-06-02status $229,900 Pending 10 DOM
-
2026-06-01days on market $229,900 Active 10 DOM
-
2026-05-31days on market $229,900 Active 9 DOM
-
2026-05-30days on market $229,900 Active 8 DOM
-
2026-05-22$229,900 Active
-
2015-01-16soldstatus $40,000
ⓘ Source: listings_history table (triggers on properties + properties_extension) + one-shot
backfill from property_details.listing_events for pre-trigger history.
Tax reassessment forecast NY · Partial reset (capped growth)
- Current annual tax
- $5,331 · $444/mo
- Projected year-2 tax
- $5,331 · $444/mo
- Expected delta
- $0/yr ($0/mo · 0.0%)
ⓘ Screening estimate from a state-policy table — verify with the county assessor before closing.
Climate risk First Street
- Flood 1/10 Low FEMA zone X (unshaded) · 0% chance over 30 yrs
- Wildfire 1/10 Low
- Heat 3/10 Moderate 7 d/yr ≥95°F today · 16 d/yr by 30 yrs out
- Wind 1/10 Low 0% chance of damaging wind over 30 yrs
- Air quality 2/10 Low 0 unhealthy d/yr today · 1 by 30 yrs out
Nearby sold comps map
Loading sold comps map…
Walkable amenities ~0.75 mi
Loading nearby amenities…
Taxation est. · year 1
- Rental income
- $26,468
- − Mortgage interest
- −$12,878
- − Property taxes
- −$5,331
- − Insurance
- −$1,150
- − Repairs & maintenance
- −$2,117
- − Management
- −$2,117
- − Depreciation
- −$6,688
- Taxable loss
- −$3,813
- Est. tax savings @ 24.0%
- +$915
- After-tax cash flow
- $877/yr
For passive investors: Depreciation is non-cash, so a rental often shows a tax loss while cash-flowing — sheltering income. Rental losses are passive: they offset passive income freely, and up to $25,000/yr can offset ordinary (W-2) income if you actively participate and your MAGI is under $100k (phasing out to $0 by $150k); unused losses carry forward. On sale, claimed depreciation is recaptured at up to 25%, and gains may owe capital-gains tax (a 1031 exchange can defer both). Figures are a year-1 estimate at your 24.0% rate — not tax advice; consult a CPA.
Schools (NCES district)
- District
- East Syracuse Minoa Central School District
- NCES district ID
- 3609990
- Math proficiency
- 46% ▼ -6.00%
- Reading proficiency
- 53% ▲ 9.00%
- Median HH income
- $55,801
- Composite
- 42.9/100
- National rank
- #3122
- State rank
- #379 of 590 in NY
Livability — East Syracuse
- Score
- 90/100
- State rank
- #4
- US rank
- #81
Category grades
Schools grade is shown separately in the Schools card above.
Census & demographics
- County
- Onondaga County · 247,257 people
- City population
- 14,253
- Metro
- Syracuse, NY
- Population (ZIP)
- 14,253
- Household income
- $80,900
- Rent vs Own
- Severe rent burden
- 250.0
Population outlook (Onondaga County) Hauer SSP2
- Today (2025)
- 467,894 people
- By 2030
- 463,381 · -1.0%
- By 2040
- 447,697 · -4.3%
- By 2050
- 426,399 · -8.9%
- By 2075
- 373,661 · -20.1%
- By 2100
- 307,967 · -34.2%
Race, ethnicity, and origin ACS 2023
- Neighborhood character
- Predominantly White (88%)
- Race & ethnicity
- White 88% Two or more races 5% Hispanic / Latino 3% Asian 2% Black 2%
- Common ancestry
- Romanian 5% Lithuanian 4% American 3%
- Foreign-born
- 6% · Canada, Vietnam
- Languages at home
- 92% English-only · Russian/Polish/Slavic 3% Spanish 1% Other Indo-European 1%
Political lean MEDSL · Onondaga
- 2024 margin
- D (+17.3) · D 58.6% · R 41.4%
- 2008→2024 swing
- -3.0pp toward R · 2008: 20.3pp · 2024: 17.3pp
- All cycles
- 2024: D+17.3 2020: D+20.6 2016: D+12.8 2012: D+21.1 2008: D+20.3
Not yet ingested
- Civics
- —
Market trends
- HPI YoY
- ▼ -39.50%
- Current HPI
- 316.8595
- Rent YoY
- —
- Metro
- Syracuse, NY
- State GDP YoY
- ▲ 2.60%
- F500 in state
- 92
Industry mix (Fortune 500 HQ in NY)
| Industry | F500 HQs | Revenue |
|---|---|---|
| Financial Services | 10 | $950B |
|
||
| Consumer Goods | 9 | $162B |
|
||
| Insurance | 4 | $225B |
|
||
| Telecommunications | 2 | $144B |
|
||
| Pharmaceuticals | 2 | $112B |
|
||
| Media / Entertainment | 2 | $69B |
|
||
Price history
+474.7% since first listed2 events — show timeline
- 2026-05-22 Listed $229,900 CNYIS
- 2015-01-16 Sold (Public Records) $40,000 Public Records
Property tax history
+3.5%/yrLatest (2025): $5,331 · +3.0% YoY. Source: county tax records.
Cash-flow waterfall
monthlySold comps — $/sqft
last 12 mo · ≤1 miLoading sold comps…