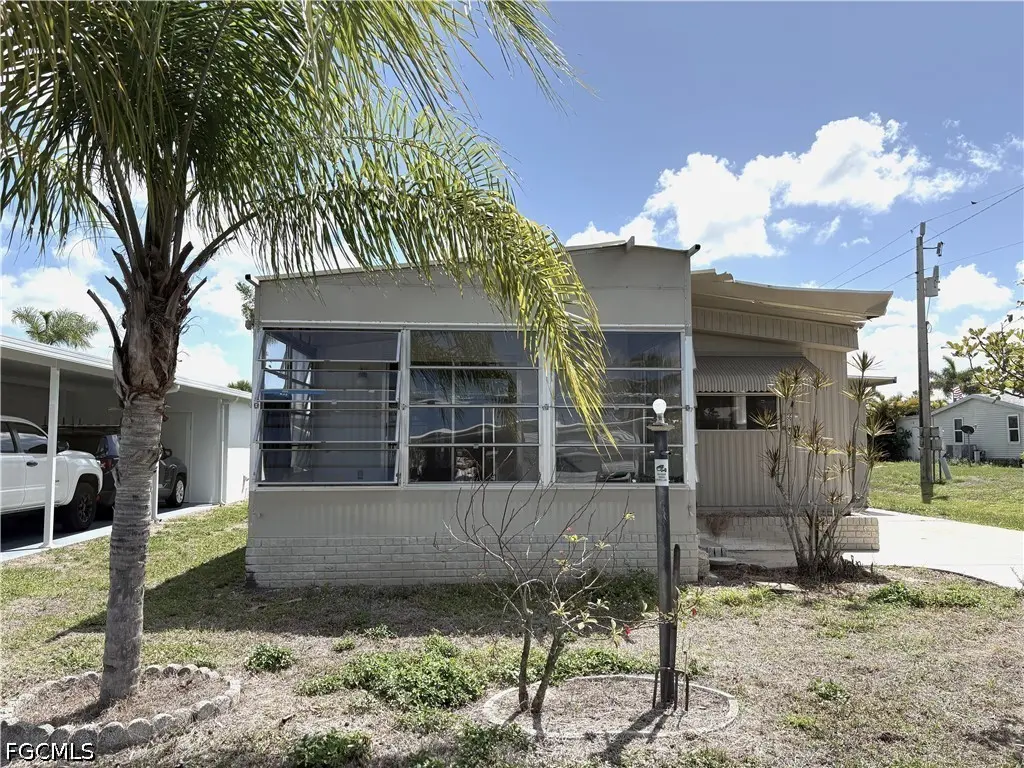
661 Coral Ln · North Fort Myers, FL
Flood risk 6/10 · Moderate
- FEMA flood zone
- AE
- Chance of flooding over 30 yrs
- 0.7%
- Est. flood insurance / yr
- $1,737 – $8,500
Fire risk 2/10 · Minimal
- Est. fire insurance / yr
- $947 – $1,759
Heat risk 10/10 · Severe
- Hot days now (above 107°F)
- 7 days/yr
- Hot days in 30 yrs
- 29 days/yr
Wind risk 10/10 · Severe
- Chance of severe wind over 30 yrs
- 99.0%
Air-quality risk 2/10 · Minimal
- Unhealthy air days now
- 1 days/yr
- Unhealthy air days in 30 yrs
- 1 days/yr
Risk factors via First Street. Map © Google.
Why this score? — see what drove the B grade
The composite is a weighted blend of 9 inputs, each scored 0–100. Each bar is that input's sub-score; the figure is the points it added to the 100-point composite (weight × sub-score).
- Cash flow +30.0/30.0
- 1% rule +10.0/10.0
- DSCR +10.0/10.0
- ARV discount +7.5/15.0
- Schools +4.1/10.0
- Livability +3.7/5.0
- Rent growth +3.2/5.0
- Condition / age +2.5/5.0
- Appreciation +0.0/10.0
$44,750
🖨 Deal sheet (PDF) 📄 Offer letter ✓ Due diligence
Listing remarks
Own this home AND YOUR LAND while you Enjoy AFFORDABLE LIVING in the Sunshine State! INVESTOR OPPORTUNITY! This is a DIAMOND IN THE ROUGH and potentially your getaway in Paradise. Make this 2 Bedroom/2 Bath unit exactly how you want it —your taste, your timeline, and your budget! The property is offered AS-IS and the List Price reflects needed repairs. (Note that you must commence work on a new carport within 60 days of purchase. ) Lazy Days is a pet-friendly, people friendly, well-kept neighborhood with a LOW monthly fee of $185. Walk to the pool & enjoy a friendly 55+ community with an array of well-maintained amenities including two meeting hallls, a heated community swimmin
Key facts
- 4,835 sq ft lot
- Parking
- Community pool
Property features AI
Finance
- Other: Pets allowed conditionally (up to 2 dogs or cats, max 25 lbs; no vicious breeds)
- HOA & community: Homeowners association with a $185 monthly fee; Association covers legal/accounting, recreation facilities, reserve fund, and street lights; Community amenities include clubhouse, pool, bocce, pickleball, shuffleboard, picnic/barbecue areas, library, laundry, storage, RV/boat storage, and management; Street lights in community; Senior community
Exterior
- Parking: Driveway; Paved parking; Attached carport (1 covered space)
- Security: Smoke detectors
- Utilities: Public water; Public sewer; Cable available
- Home design: Manufactured home with vinyl siding; Single-story; Entry level: 1; Faces west; Known damage noted
- Construction: Metal roof; Manufactured construction with vinyl siding
- Exterior features: Storage; Community pool; Rectangular, paved lot on a public maintained road; East exposure
Interior
- Flooring: Laminate flooring
- Bathrooms: 2 full bathrooms; 2 half bathrooms
- Heating & cooling: Central heating (electric); Central air conditioning (electric); Ceiling fans
- Interior features: Separate/formal dining room; Shower-only bathrooms with separate showers; High-speed internet; Single hung and sliding windows with shutters; Unfurnished
- Laundry & utility: Washer and dryer (appliances included); Laundry in common area
Neighborhood map
What this means for you Summary
Snapshot
- This is a 2-bed/2.0-bath manufactured listed at $45k.
Deal economics
- At list price, monthly cash flow is $213 ($3k/yr) — positive.
- The deal already cash-flows at list — no discount required.
- Meets the 1% rule at list price ($1k rent vs $45k).
- Recommended offer: $42k (6.0% below list) — sets the bar for market timing.
- Cap rate 23.4% vs local median 3.6% in North Fort Myers — top-decile yield for the area; either an underpriced asset or a hidden risk that comps aren't pricing in. Stress-test before assuming the spread holds.
Location & tenants
- Location reads 74/100 on livability (#269 in FL, #4,409 nationally) — a middle-class / working-renter tenant base. Strengths: cost of living A+, housing A+, health & safety A+; Watch: employment C-, amenities F, commute F.
- Lee (suburban): math 47% / reading 50% proficiency, ranked #42 of 73 in FL (top 58%) — families likely to look elsewhere, expect single-tenant / working-renter base with shorter leases.
- Market conditions: Rents rising (+2.6%/yr); 841 active listings in the ZIP; 24 comparable units currently listed for rent nearby; rentals at typical pace (median 25d on market — plan ~3-4 weeks tenant-placement turnaround); 15,411 units permitted in Lee County in 2024 (4,686 in 5+ unit buildings).
- This rent runs 32% of the median local income ($55k/yr) — at the standard rent-burdened threshold; future hikes will face affordability resistance.
Forward outlook
- Local home prices are declining (-3.0%/yr); year-one equity from $310 of loan paydown is wiped out by about $1k of value loss. Plan a longer hold.
- Lee County population projected at +44% by 2050 — long-run rental-demand tailwind backs the buy-and-hold thesis.
- At projected returns (-3.0% appreciation + 2.6% rent growth), your $13k cash investment doubles in ~7 years — after that, you're playing with house money.
Negotiation context
- It's been on market 65 days — a 6% lower offer ($42k) is reasonable based on typical stale-listing flexibility.
- Current owner paid $30k; list at $45k implies a 52% gain — meaningful room to come down on a strong offer.
Risks & watch-outs
- Watch-outs: flood insurance adds $427/mo.
- Climate carrying-cost: in FEMA flood zone AE (mandatory federal flood insurance); severe wind risk, 99% chance of damaging wind over 30y; extreme-heat days projected 7→29/yr by 2055 (HVAC capex compounding) — expect insurance premiums to compound above CPI over the hold.
Questions for the listing agent
- It's been on market 65 days. Have you received any prior offers? Is the seller open to a 6% concession, seller financing, or rate buy-down credit?
- Built in 1976 — when were the roof, HVAC, electrical panel, plumbing, and water heater last replaced?
- What's the actual annual flood-insurance premium (NFIP or private), and is the property in a SFHA with mandatory coverage?
- What does the HOA fee cover, when was the last increase, and are there any pending special assessments or reserve-fund shortfalls?
- Why hasn't it sold? Are there any deal-killer items the seller is aware of (foundation, flood, title, zoning, code violations)?
- Is there a deadline driving the sale (1031 exchange, divorce, estate, relocation)? That informs how much negotiation room exists.
- What's the average days-on-market for RENTAL listings here right now (not sales)? A rising rental-DOM trend means longer vacancies and softer asking-rent achievability than the comps imply.
- What's the recent tenant-quality profile in this submarket — average credit score on applications, eviction rate, late-payment / NSF rate, and stable-employment percentage? A property-management company in the area should have these aggregated.
- How much new for-sale + rental construction is in the pipeline within 1–3 miles? Heavy new supply typically softens prices + rents 12–24 months out; constrained supply supports both.
Investment metrics
- 1% rule
- 3.29% ✓
- Cap rate
- 23.44%
- Cash-on-cash
- 61.23%
- DSCR
- 3.72
- GRM
- 2.5
CMA / ARV
- ARV (on-the-fly)
- $135,360
- Comps found
- 2
Show comp detail 2 sales within ~0.75 mi
| Address | Dist | Beds/Ba | Sqft | Sold | Price | $/sf | Match |
|---|---|---|---|---|---|---|---|
| 974 Restful Rd | 0.37mi | 2/2.0 | 960 (0%) | 3mo | $109,575 | $114 | 80 |
| 786 Roses Ln | 0.18mi | 2/2.0 | 1,056 (+10%) | 4mo | $149,000 | $141 | 72 |
Match score weights: distance 35% · size 25% · config 20% · recency 20%. Top-matched comps best support the ARV.
Projected returns pro-forma
-3.0% appreciation · 2.63% rent growth · sell at horizon
- IRR
- 12.4%
- Equity multiple
- 1.49×
- Total profit
- $6,169
- Equity at exit
- $6,672
- IRR
- 21.2%
- Equity multiple
- 2.78×
- Total profit
- $22,288
- Equity at exit
- $3,869
Cash invested: $12,530 (down + closing). Projections, not guarantees.
Landlord ↔ Tenant lean methodology
- Overall (STATE)
- 87 Strongly Landlord-Friendly
- State Florida
- 87 Strongly Landlord-Friendly · R+3
- County
- — inherits STATE
- City
- — inherits STATE
ZIP-level market 33917
- Home prices YoY
- -30.2%
- Rents YoY
- 2.6%
- Active inventory
- 841
- Price-to-rent
- 2.5×
Monthly cashflow live
- Estimated rent
- $1,473 high interval (Pro) →
- Mortgage (P&I)
- −$235
- Tax from tax record
- −$86 /mo · $1,037/yr
- Insurance
- −$19
- Flood insurance flood zone
- −$427 /mo · $5,118/yr
- HOA
- −$185
- Vacancy / Maint / Mgmt
- −$309
- Net cashflow
- $213
Break-even live
Sensitivity live
| Price | -10% $238 | -5% $225 | +0% $213 | +5% $200 | +10% $187 |
|---|---|---|---|---|---|
| Rent | -10% $96 | -5% $155 | +0% $213 | +5% $271 | +10% $329 |
| Rate | -1.0pp $235 | -0.5pp $224 | base $213 | +0.5pp $201 | +1.0pp $189 |
UW: 25.0% down · 7.5% · 30yr · 1.5% tax · 5.0% vac · 8.0% maint · 8.0% mgmt
Financing live
Cash to close
- Down payment
- $11,188
- Closing costs
- $1,342
- Reserves months
- —
- Total cash needed
- —
Loan-product check · same deal, 3 products live
Conventional
25% down · 7.5% · 30yr
- Down + closing
- —
- Monthly P&I
- —
- Monthly cashflow
- —
- DSCR
- —
- Eligible?
- —
Personal DTI + credit; lowest rate.
DSCR
20% down · 8.5% · 30yr
- Down + closing
- —
- Monthly P&I
- —
- Monthly cashflow
- —
- DSCR
- —
- Eligible?
- —
No personal income docs; deal must DSCR.
Hard money
10% down · 12.0% · 12mo
- Down + closing
- —
- Monthly P&I
- —
- Monthly cashflow
- —
- DSCR
- —
- Eligible?
- —
Short-term bridge; refi at stabilization.
Rent comps 24 comps
| Address | Beds | Baths | Sqft | Rent | $/sqft | DOM | Units | Dist |
|---|---|---|---|---|---|---|---|---|
| 16363 Teresa Ln North Fort Myers, FL | 2.0 | 1.0 | 1000 | $1,000 | $1.00 | 24d | 1 | 0.31mi |
| 4120 Pine Drop Ln North Fort Myers, FL | 3.0 | 2.0 | 957 | $1,895 | $1.98 | 24d | 1 | 0.56mi |
| 947 Strongbox Ln North Fort Myers, FL | 2.0 | 2.0 | 1000 | $1,300 | $1.30 | 24d | 1 | 0.62mi |
| 2774 Wedgewood Dr North Fort Myers, FL | 2.0 | 2.0 | 880 | $1,300 | $1.48 | 24d | 1 | 0.67mi |
| 2027 Eloise Cir North Fort Myers, FL | 2.0 | 1.0 | 822 | $1,300 | $1.58 | 4d | 1 | 0.68mi |
| 2095 Eloise Cir North Fort Myers, FL | 2.0 | 1.0 | 840 | $1,295 | $1.54 | 24d | 1 | 0.71mi |
| 248 Stockton St North Fort Myers, FL | 3.0 | 2.0 | 924 | $1,300 | $1.41 | 24d | 1 | 0.90mi |
| 260 Stockton St North Fort Myers, FL | 2.0 | 2.0 | 924 | $1,200 | $1.30 | 4d | 1 | 0.93mi |
| 247 Stockton St North Fort Myers, FL | 3.0 | 2.0 | 924 | $1,325 | $1.43 | 24d | 1 | 0.93mi |
| 1846 Powell Dr Unit 28 North Fort Myers, FL | 1.0 | 1.0 | 850 | $1,500 | $1.76 | 4d | 1 | 0.94mi |
| 7535 McDaniel Dr North Fort Myers, FL | 2.0 | 1.0 | 644 | $850 | $1.32 | 24d | 1 | 1.02mi |
| 7535 McDaniel Dr North Fort Myers, FL | 2.0 | 1.0 | 644 | $850 | $1.32 | 15d | 1 | 1.02mi |
| 28 Nyborg Ave North Fort Myers, FL | 3.0 | 2.0 | 1042 | $1,299 | $1.25 | 15d | 1 | 1.05mi |
| 538 State St North Fort Myers, FL | 3.0 | 1.5 | 1000 | $1,199 | $1.20 | 24d | 1 | 1.18mi |
| 8086 Heck Dr Unit 6 North Fort Myers, FL | 2.0 | 1.0 | 600 | $800 | $1.33 | 24d | 1 | 1.19mi |
| 8791 Littleton Rd North Fort Myers, FL | 2.0 | 2.0 | 1074 | $1,549 | $1.44 | 24d | 1 | 1.22mi |
| 446 San Bernardino St North Fort Myers, FL | 2.0 | 1.0 | 1104 | $1,590 | $1.44 | 11d | 1 | 1.24mi |
| 3404 Rainbow Ln North Fort Myers, FL | 2.0 | 2.0 | 1056 | $1,800 | $1.70 | 4d | 1 | 1.27mi |
| 3260 Stockton St North Fort Myers, FL | 3.0 | 1.0–2.0 | 976 | $2,371 | $2.43 | 2d | 27 | 1.28mi |
| 7869 Suncoast Dr North Fort Myers, FL | 2.0 | 1.0 | 564 | $850 | $1.51 | 3d | 1 | 1.29mi |
| 2211 Cantor Ln North Fort Myers, FL | 2.0 | 2.0 | 672 | $850 | $1.26 | 3d | 1 | 1.30mi |
| 240 W Mariana Ave Apt B North Fort Myers, FL | 1.0 | 1.0 | 600 | $1,295 | $2.16 | 24d | 1 | 1.41mi |
| 112 Crescent Lake Dr North Fort Myers, FL | 2.0 | 1.0 | 980 | $1,700 | $1.73 | 24d | 1 | 1.45mi |
| 69 E Mariana Ave Unit B North Fort Myers, FL | 3.0 | 1.0 | 1000 | $1,795 | $1.79 | 4d | 1 | 1.48mi |
HOA detail
- Monthly dues
- $185 · $2,220/yr
- Likely covers
- pool
Listing history 14 events
-
2026-06-17days on market $44,750 Active 65 DOM
-
2026-06-16days on market $44,750 Active 64 DOM
-
2026-06-15days on market $44,750 Active 63 DOM
-
2026-06-13days on market $44,750 Active 61 DOM
-
2026-06-10days on market $44,750 Active 58 DOM
-
2026-06-09days on market $44,750 Active 57 DOM
-
2026-06-07days on market $44,750 Active 55 DOM
-
2026-06-03days on market $44,750 Active 51 DOM
-
2026-06-02days on market $44,750 Active 50 DOM
-
2026-06-01days on market $44,750 Active 49 DOM
-
2026-05-31days on market $44,750 Active 48 DOM
-
2026-04-09$44,750 Active
-
1999-04-14soldstatus $29,500
-
1997-05-28soldstatus $38,500
ⓘ Source: listings_history table (triggers on properties + properties_extension) + one-shot
backfill from property_details.listing_events for pre-trigger history.
Tax reassessment forecast FL · Resets to sale price
- Current annual tax
- $1,037 · $86/mo
- Projected year-2 tax
- $1,037 · $86/mo
- Expected delta
- $0/yr ($0/mo · 0.0%)
ⓘ Screening estimate from a state-policy table — verify with the county assessor before closing.
Climate risk First Street
- Flood 6/10 Major FEMA zone AE · 70% chance over 30 yrs
- Wildfire 2/10 Low
- Heat 10/10 Extreme 7 d/yr ≥107°F today · 29 d/yr by 30 yrs out
- Wind 10/10 Extreme 99% chance of damaging wind over 30 yrs
- Air quality 2/10 Low 1 unhealthy d/yr today · 1 by 30 yrs out
Nearby sold comps map
Loading sold comps map…
Walkable amenities ~0.75 mi
Loading nearby amenities…
Taxation est. · year 1
- Rental income
- $17,682
- − Mortgage interest
- −$2,507
- − Property taxes
- −$1,037
- − Insurance
- −$5,342
- − Repairs & maintenance
- −$1,415
- − Management
- −$1,415
- − HOA
- −$2,220
- − Depreciation
- −$1,302
- Taxable income
- $2,445
- Est. tax owed @ 24.0%
- −$587
- After-tax cash flow
- $1,966/yr
For passive investors: Depreciation is non-cash, so a rental often shows a tax loss while cash-flowing — sheltering income. Rental losses are passive: they offset passive income freely, and up to $25,000/yr can offset ordinary (W-2) income if you actively participate and your MAGI is under $100k (phasing out to $0 by $150k); unused losses carry forward. On sale, claimed depreciation is recaptured at up to 25%, and gains may owe capital-gains tax (a 1031 exchange can defer both). Figures are a year-1 estimate at your 24.0% rate — not tax advice; consult a CPA.
Schools (NCES district)
- District
- Lee
- NCES district ID
- 1201080
- Math proficiency
- 47% ▼ -11.00%
- Reading proficiency
- 50% ▼ -4.00%
- Median HH income
- $49,518
- Composite
- 41.49/100
- National rank
- #3458
- State rank
- #42 of 73 in FL
Livability — North Fort Myers
- Score
- 74/100
- State rank
- #269
- US rank
- #4409
Category grades
Schools grade is shown separately in the Schools card above.
Census & demographics
- Census place
- North Fort Myers, FL
- County
- Lee County · 788,662 people
- City population
- 57,035
- Metro
- Cape Coral-Fort Myers, FL
- Population (ZIP)
- 33,380
- Household income
- $55,000
- Rent vs Own
- Severe rent burden
- 775.0
Population outlook (Lee County) Hauer SSP2
- Today (2025)
- 871,946 people
- By 2030
- 955,468 · +9.6%
- By 2040
- 1,113,587 · +27.7%
- By 2050
- 1,256,891 · +44.1%
- By 2075
- 1,560,270 · +78.9%
- By 2100
- 1,726,848 · +98.0%
Race, ethnicity, and origin ACS 2023
- Neighborhood character
- Predominantly White (85%)
- Race & ethnicity
- White 85% Hispanic / Latino 10% Two or more races 7% Asian 1% Black 1%
- Hispanic origin (detail)
- Mexican 2% Puerto Rican 1% Cuban 3%
- Common ancestry
- Lithuanian 3% Romanian 3% Slovak 2%
- Foreign-born
- 10% · Canada
- Languages at home
- 88% English-only · Spanish 9% Other Indo-European 1% Russian/Polish/Slavic 1%
Political lean MEDSL · Lee
- 2024 margin
- Strong R (+28.4) · D 35.5% · R 63.9%
- 2008→2024 swing
- -18.0pp toward R · 2008: -10.4pp · 2024: -28.4pp
- All cycles
- 2024: R+28.4 2020: R+19.2 2016: R+20.4 2012: R+16.6 2008: R+10.4
Not yet ingested
- Civics
- —
Market trends
- HPI YoY
- ▼ -122.28%
- Current HPI
- 282.2895
- Rent YoY
- ▲ 2.63%
- Metro
- Cape Coral-Fort Myers, FL
- State GDP YoY
- ▲ 3.28%
- F500 in state
- 36
Industry mix (Fortune 500 HQ in FL)
| Industry | F500 HQs | Revenue |
|---|---|---|
| Industrial Technology | 2 | $29B |
|
||
| Insurance | 2 | $17B |
|
||
| Retail | 1 | $60B |
|
||
| Technology Distribution | 1 | $58B |
|
||
| Homebuilding | 1 | $35B |
|
||
| Technology Manufacturing | 1 | $35B |
|
||
Price history
+16.2% since first listed3 events — show timeline
- 2026-04-09 Listed $44,750 FORTMLS
- 1999-04-14 Sold (Public Records) $29,500 Public Records
- 1997-05-28 Sold (Public Records) $38,500 Public Records
Property tax history
+20.9%/yrLatest (2025): $1,037 · -26.2% YoY. Source: county tax records.
Cash-flow waterfall
monthlySold comps — $/sqft
last 12 mo · ≤1 miLoading sold comps…