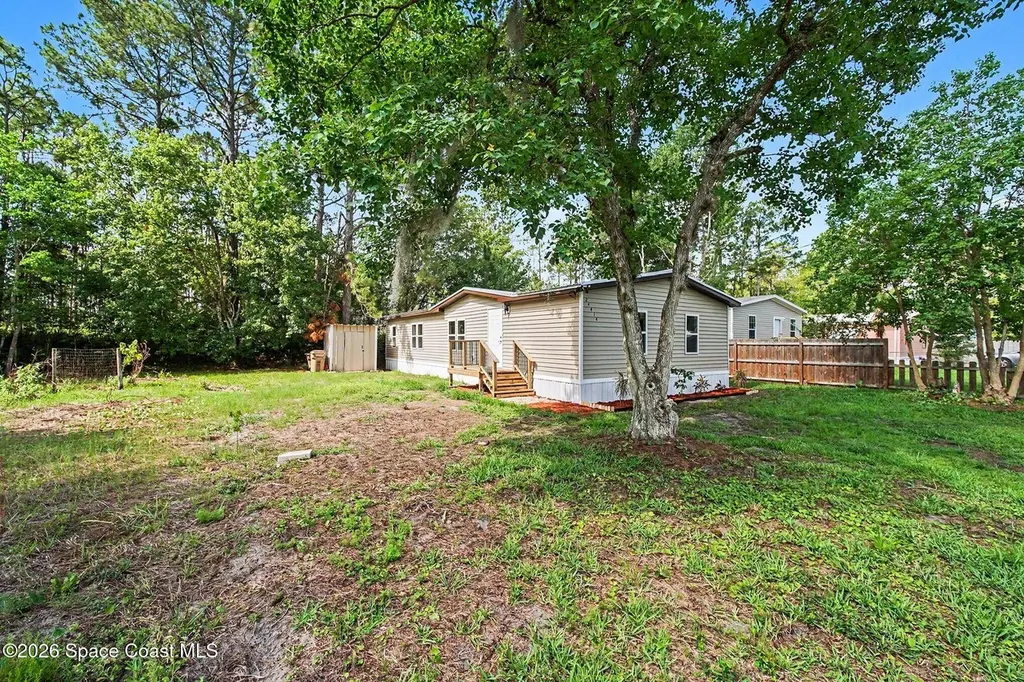
24414 Maxwell St · Astor, FL
Flood risk 1/10 · Minimal
- FEMA flood zone
- X (unshaded)
- Chance of flooding over 30 yrs
- 0.0%
- Est. flood insurance / yr
- $507 – $1,088
Fire risk 5/10 · Moderate
- Est. fire insurance / yr
- $947 – $1,759
Heat risk 9/10 · Severe
- Hot days now (above 107°F)
- 7 days/yr
- Hot days in 30 yrs
- 21 days/yr
Wind risk 9/10 · Severe
- Chance of severe wind over 30 yrs
- 99.0%
Air-quality risk 3/10 · Minor
- Unhealthy air days now
- 2 days/yr
- Unhealthy air days in 30 yrs
- 3 days/yr
Risk factors via First Street. Map © Google.
Why this score? — see what drove the C+ grade
The composite is a weighted blend of 9 inputs, each scored 0–100. Each bar is that input's sub-score; the figure is the points it added to the 100-point composite (weight × sub-score).
- Cash flow +26.8/30.0
- DSCR +9.2/10.0
- 1% rule +6.2/10.0
- Appreciation +6.0/10.0
- Schools +4.2/10.0
- Livability +3.3/5.0
- ARV discount +3.1/15.0
- Rent growth +2.5/5.0
- Condition / age +2.5/5.0
$199,000
🖨 Deal sheet (PDF) 📄 Offer letter ✓ Due diligence
Listing remarks
Completely remodeled 4-bedroom home in Astor offering modern upgrades and exceptional craftsmanship. This move-in-ready property features hurricane-impact windows, luxury vinyl plank flooring, a tankless water heater, an updated electrical panel, and an A/C system less than one year old. The roof has been replaced recently. The stunning kitchen showcases custom solid-wood cabinetry, a hidden microwave, quartz countertops, and a butcher-block island, perfect for entertaining and everyday living. The spacious primary suite includes two walk-in closets and a beautifully updated bath with a large tiled walk-in shower, double vanity, and designer finishes. The guest bathroom offers a large vanit
Key facts
- 4,976 sq ft lot
- Built 1986
- Listed 8 days
Property features AI
Finance
- Other: Pets allowed (cats and dogs)
Exterior
- Parking: Off-street parking; On-street parking
- Security: Carbon monoxide detector(s); Smoke detector(s)
- Utilities: 150 Amp electric service; Public sewer; Water available and connected; Sewer available and connected; Electricity available; Cable available
- Home design: Double wide mobile home; Single-story (entry level 1); Faces east; Used as manufactured residential single-family
- Construction: Vinyl siding; Metal roof
- Exterior features: Porch; Shed(s); Zero lot line; County road frontage; Asphalt / paved road
Interior
- Kitchen: Dishwasher; Electric cooktop; Microwave; Refrigerator; Plumbed for ice maker; Tankless water heater; Electric water heater
- Bedrooms: 4 bedrooms
- Flooring: Tile flooring
- Bathrooms: 2 full bathrooms; Primary bathroom with shower (no tub) and also tub with shower
- Heating & cooling: Central heating (electric); Central air (electric)
- Interior features: Ceiling fans; His and hers closets; Kitchen island; Open floor plan; Split bedrooms; Vaulted ceilings; Walk-in closets; Wood-burning fireplace (1)
- Laundry & utility: In-unit laundry; Washer hookup; Electric dryer hookup
Neighborhood map
What this means for you Summary
Snapshot
- This is a 3-bed/2.0-bath manufactured listed at $199k.
Deal economics
- At list price, monthly cash flow is $546 ($7k/yr) — positive.
- The deal already cash-flows at list — no discount required.
- Meets the 1% rule at list price ($2k rent vs $199k).
Location & tenants
- Location reads 66/100 on livability (#613 in FL) — a middle-class / working-renter tenant base. Strengths: crime A+, cost of living A+, housing A+; Watch: schools F, amenities F, commute F.
- Lake (suburban): math 49% / reading 50% proficiency, ranked #37 of 73 in FL (top 51%) — families likely to look elsewhere, expect single-tenant / working-renter base with shorter leases.
- Market conditions: 77 active listings in the ZIP; 1 comparable units currently listed for rent nearby; 4,799 units permitted in Lake County in 2024 (814 in 5+ unit buildings).
Forward outlook
- In year one you build about $5k of equity ($1k loan paydown + $4k appreciation (1.9% local appreciation)).
- Lake County population projected at +37% by 2050 — long-run rental-demand tailwind backs the buy-and-hold thesis.
- At projected returns (1.9% appreciation + 3.0% rent growth), your $56k cash investment doubles in ~5 years — after that, you're playing with house money.
- By year 7, paydown + projected appreciation supports a ~$34k cash-out refi (75% LTV) — recoverable capital for the next deal without selling this one.
Negotiation context
- Only 8 days on market — expect competitive offers; lowballing is unlikely to land.
Risks & watch-outs
- Climate carrying-cost: severe wind risk, 99% chance of damaging wind over 30y; moderate wildfire risk; extreme-heat days projected 7→21/yr by 2055 (HVAC capex compounding) — expect insurance premiums to compound above CPI over the hold.
Questions for the listing agent
- Is there a deadline driving the sale (1031 exchange, divorce, estate, relocation)? That informs how much negotiation room exists.
- Schools are F-rated, which usually means shorter tenancies and higher turnover. Who's the typical renter profile here, and what's been the actual vacancy rate?
- What's the average days-on-market for RENTAL listings here right now (not sales)? A rising rental-DOM trend means longer vacancies and softer asking-rent achievability than the comps imply.
- What's the recent tenant-quality profile in this submarket — average credit score on applications, eviction rate, late-payment / NSF rate, and stable-employment percentage? A property-management company in the area should have these aggregated.
- How much new for-sale + rental construction is in the pipeline within 1–3 miles? Heavy new supply typically softens prices + rents 12–24 months out; constrained supply supports both.
Investment metrics
- 1% rule
- 1.12% ✓
- Cap rate
- 9.58%
- Cash-on-cash
- 11.75%
- DSCR
- 1.52
- GRM
- 7.5
CMA / ARV
- ARV (on-the-fly)
- $181,440
- Comps found
- 1
Show comp detail 1 sale within ~0.75 mi
| Address | Dist | Beds/Ba | Sqft | Sold | Price | $/sf | Match |
|---|---|---|---|---|---|---|---|
| 55045 6th St | 0.39mi | 3/2.0 | 1,188 (-12%) | 1mo | $160,000 | $135 | 62 |
Match score weights: distance 35% · size 25% · config 20% · recency 20%. Top-matched comps best support the ARV.
Projected returns pro-forma
1.95% appreciation · 3.0% rent growth · sell at horizon
- IRR
- 16.0%
- Equity multiple
- 1.86×
- Total profit
- $47,845
- Equity at exit
- $77,964
- IRR
- 18.4%
- Equity multiple
- 3.43×
- Total profit
- $135,607
- Equity at exit
- $111,866
Cash invested: $55,720 (down + closing). Projections, not guarantees.
Landlord ↔ Tenant lean methodology
- Overall (STATE)
- 87 Strongly Landlord-Friendly
- State Florida
- 87 Strongly Landlord-Friendly · R+3
- County
- — inherits STATE
- City
- — inherits STATE
ZIP-level market 32102
- Home prices YoY
- 0.8%
- Active inventory
- 77
- Price-to-rent
- 7.5×
Monthly cashflow live
- Estimated rent
- $2,225 medium interval (Pro) →
- Mortgage (P&I)
- −$1,044
- Tax from tax record
- −$85 /mo · $1,025/yr
- Insurance
- −$83
- HOA
- −$0
- Vacancy / Maint / Mgmt
- −$467
- Net cashflow
- $546
Break-even live
Sensitivity live
| Price | -10% $658 | -5% $602 | +0% $546 | +5% $489 | +10% $433 |
|---|---|---|---|---|---|
| Rent | -10% $370 | -5% $458 | +0% $546 | +5% $634 | +10% $722 |
| Rate | -1.0pp $646 | -0.5pp $596 | base $546 | +0.5pp $494 | +1.0pp $442 |
UW: 25.0% down · 7.5% · 30yr · 1.5% tax · 5.0% vac · 8.0% maint · 8.0% mgmt
Financing live
Cash to close
- Down payment
- $49,750
- Closing costs
- $5,970
- Reserves months
- —
- Total cash needed
- —
Loan-product check · same deal, 3 products live
Conventional
25% down · 7.5% · 30yr
- Down + closing
- —
- Monthly P&I
- —
- Monthly cashflow
- —
- DSCR
- —
- Eligible?
- —
Personal DTI + credit; lowest rate.
DSCR
20% down · 8.5% · 30yr
- Down + closing
- —
- Monthly P&I
- —
- Monthly cashflow
- —
- DSCR
- —
- Eligible?
- —
No personal income docs; deal must DSCR.
Hard money
10% down · 12.0% · 12mo
- Down + closing
- —
- Monthly P&I
- —
- Monthly cashflow
- —
- DSCR
- —
- Eligible?
- —
Short-term bridge; refi at stabilization.
Rent comps 1 comps
| Address | Beds | Baths | Sqft | Rent | $/sqft | DOM | Units | Dist |
|---|---|---|---|---|---|---|---|---|
| 55624 Sam St Astor, FL | 2.0 | 2.0 | 1792 | $2,225 | $1.24 | 11d | 1 | 0.95mi |
Listing history 9 events
-
2026-06-18days on market $199,000 Active 8 DOM
-
2026-06-17days on market $199,000 Active 7 DOM
-
2026-06-16days on market $199,000 Active 6 DOM
-
2026-06-15days on market $199,000 Active 5 DOM
-
2026-06-13statusdays on market $199,000 Active 3 DOM
-
2026-06-08statusdays on market $199,000 Pending 1 DOM
-
2026-06-07days on market $199,000 Active 4 DOM
-
2026-06-04remarks 699-char remark
-
2026-06-04$199,000 Active 1 DOM
ⓘ Source: listings_history table (triggers on properties + properties_extension) + one-shot
backfill from property_details.listing_events for pre-trigger history.
Tax reassessment forecast FL · Resets to sale price
- Current annual tax
- $1,025 · $85/mo
- Projected year-2 tax
- $1,652 · $138/mo
- Expected delta
- +$626/yr (+$52/mo · 61.1%)
ⓘ Screening estimate from a state-policy table — verify with the county assessor before closing.
Climate risk First Street
- Flood 1/10 Low FEMA zone X (unshaded) · 0% chance over 30 yrs
- Wildfire 5/10 Major
- Heat 9/10 Extreme 7 d/yr ≥107°F today · 21 d/yr by 30 yrs out
- Wind 9/10 Extreme 99% chance of damaging wind over 30 yrs
- Air quality 3/10 Moderate 2 unhealthy d/yr today · 3 by 30 yrs out
Nearby sold comps map
Loading sold comps map…
Walkable amenities ~0.75 mi
Loading nearby amenities…
Taxation est. · year 1
- Rental income
- $26,700
- − Mortgage interest
- −$11,147
- − Property taxes
- −$1,025
- − Insurance
- −$995
- − Repairs & maintenance
- −$2,136
- − Management
- −$2,136
- − Depreciation
- −$5,789
- Taxable income
- $3,472
- Est. tax owed @ 24.0%
- −$833
- After-tax cash flow
- $5,717/yr
For passive investors: Depreciation is non-cash, so a rental often shows a tax loss while cash-flowing — sheltering income. Rental losses are passive: they offset passive income freely, and up to $25,000/yr can offset ordinary (W-2) income if you actively participate and your MAGI is under $100k (phasing out to $0 by $150k); unused losses carry forward. On sale, claimed depreciation is recaptured at up to 25%, and gains may owe capital-gains tax (a 1031 exchange can defer both). Figures are a year-1 estimate at your 24.0% rate — not tax advice; consult a CPA.
Schools (NCES district)
- District
- Lake
- NCES district ID
- 1201050
- Math proficiency
- 49% ▼ -7.00%
- Reading proficiency
- 50% ▼ -4.00%
- Median HH income
- $46,632
- Composite
- 42.05/100
- National rank
- #3327
- State rank
- #37 of 73 in FL
Livability — Astor
- Score
- 66/100
- State rank
- #613
- US rank
- #11822
Category grades
Schools grade is shown separately in the Schools card above.
Census & demographics
- Census place
- Astor, FL
- Population (ZIP)
- 2,401
Population outlook (Lake County) Hauer SSP2
- Today (2025)
- 386,640 people
- By 2030
- 417,107 · +7.9%
- By 2040
- 476,676 · +23.3%
- By 2050
- 531,296 · +37.4%
- By 2075
- 648,303 · +67.7%
- By 2100
- 698,530 · +80.7%
Race, ethnicity, and origin ACS 2023
- Neighborhood character
- Predominantly White (89%)
- Race & ethnicity
- White 89% Two or more races 7% Hispanic / Latino 3%
- Common ancestry
- Lithuanian 9% Portuguese 8% Slovak 2%
- Foreign-born
- 2% · Canada
- Languages at home
- 95% English-only · Spanish 3% German/W. Germanic 1% Russian/Polish/Slavic 1%
Political lean MEDSL · Lake
- 2024 margin
- Strong R (+24.7) · D 37.3% · R 62.0%
- 2008→2024 swing
- -11.2pp toward R · 2008: -13.5pp · 2024: -24.7pp
- All cycles
- 2024: R+24.7 2020: R+20.0 2016: R+23.1 2012: R+17.1 2008: R+13.5
Not yet ingested
- Civics
- —
Market trends
- HPI YoY
- ▲ 1.95%
- Current HPI
- 232.7974
- Rent YoY
- —
- Metro
- —
- State GDP YoY
- ▲ 3.28%
- F500 in state
- 36
Industry mix (Fortune 500 HQ in FL)
| Industry | F500 HQs | Revenue |
|---|---|---|
| Industrial Technology | 2 | $29B |
|
||
| Insurance | 2 | $17B |
|
||
| Retail | 1 | $60B |
|
||
| Technology Distribution | 1 | $58B |
|
||
| Homebuilding | 1 | $35B |
|
||
| Technology Manufacturing | 1 | $35B |
|
||
Price history
1 event — show timeline
- 2026-06-03 Listed $199,000 SCMLS
Property tax history
+8.0%/yrLatest (2025): $1,025 · +3.8% YoY. Source: county tax records.
Cash-flow waterfall
monthlySold comps — $/sqft
last 12 mo · ≤1 miLoading sold comps…