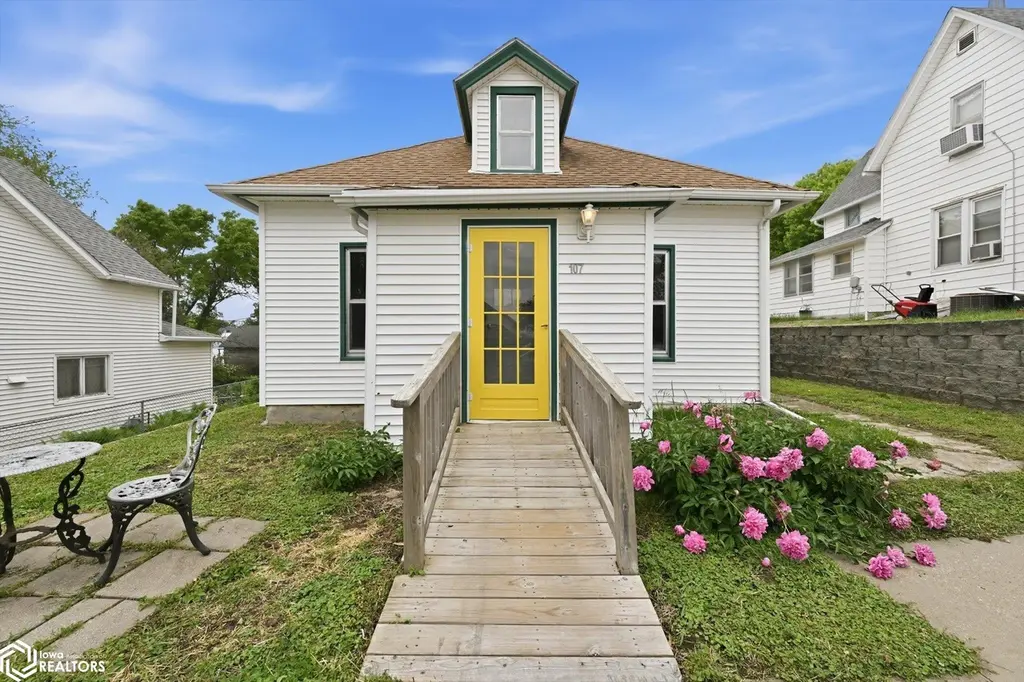
107 2nd Ave · Earling, IA
Flood risk 1/10 · Minimal
- FEMA flood zone
- X (unshaded)
- Chance of flooding over 30 yrs
- 0.0%
- Est. flood insurance / yr
- $507 – $1,088
Fire risk 1/10 · Minimal
- Est. fire insurance / yr
- $902 – $1,676
Heat risk 3/10 · Minor
- Hot days now (above 101°F)
- 7 days/yr
- Hot days in 30 yrs
- 15 days/yr
Wind risk 2/10 · Minimal
- Chance of severe wind over 30 yrs
- —
Air-quality risk 1/10 · Minimal
- Unhealthy air days now
- 0 days/yr
- Unhealthy air days in 30 yrs
- 0 days/yr
Risk factors via First Street. Map © Google.
Why this score? — see what drove the B+ grade
The composite is a weighted blend of 9 inputs, each scored 0–100. Each bar is that input's sub-score; the figure is the points it added to the 100-point composite (weight × sub-score).
- Cash flow +30.0/30.0
- 1% rule +10.0/10.0
- DSCR +10.0/10.0
- ARV discount +7.5/15.0
- Appreciation +6.4/10.0
- Schools +6.3/10.0
- Livability +3.0/5.0
- Rent growth +2.5/5.0
- Condition / age +2.5/5.0
$72,500
🖨 Deal sheet (PDF) 📄 Offer letter ✓ Due diligence
Listing remarks
Here's a great starter home for those just beginning home ownership. This one story home offers 2 bedrooms, living/dining room, full bath, eat in kitchen, enclosed back porch, and main floor laundry room. There is an attic space that could be finished and used as additional living space. There is also alley access to the nice back yard that could accommodate a detached garage. Come join this small community that offers banking, medical clinic, and eating places! There is a nice town park for family get togethers and a Freedom Rock. This home is being sold through an estate, and only in as is condition!
Key facts
- Alley access
- Enclosed back porch
- Attic space
Tags
Property features AI
Exterior
- Parking: Concrete parking; Other parking type
- Utilities: Public water; Public sewer
- Home design: Single-family residential property
- Construction: Vinyl siding
- Exterior features: 50 x 142 lot (0.16 acres)
Interior
- Bathrooms: 1 full bathroom
- Heating & cooling: Window air conditioning unit(s); Has heating (type not specified)
- Interior features: Basement
Neighborhood map
What this means for you Summary
Snapshot
- This is a 3-bed/1.0-bath single-family listed at $72k.
Deal economics
- At list price, monthly cash flow is $470 ($6k/yr) — positive.
- The deal already cash-flows at list — no discount required.
- Meets the 1% rule at list price ($1k rent vs $72k).
- Recommended offer: $71k (1.5% below list) — sets the bar for market timing.
Location & tenants
- Location reads 60/100 on livability (#812 in IA) — a middle-class / working-renter tenant base. Strengths: cost of living A+, housing A-, crime B; Watch: schools F, amenities F, commute F.
- Harlan Community School District (town): math 72% / reading 77% proficiency, ranked #81 of 289 in IA (top 28%) — strong family-tenant draw, lease renewals of 3-5y typical.
- Market conditions: 2 active listings in the ZIP; 8 units permitted in Shelby County in 2024 (0 in 5+ unit buildings).
Forward outlook
- In year one you build about $2k of equity ($501 loan paydown + $2k appreciation (2.7% local appreciation)).
- Shelby County population projected to shrink 7% by 2050 — rents likely to lag national; underwrite the cash flow, not the appreciation.
- At projected returns (2.7% appreciation + 3.0% rent growth), your $20k cash investment doubles in ~3 years — after that, you're playing with house money.
Negotiation context
- It's been on market 28 days — a 2% lower offer ($71k) is reasonable based on typical stale-listing flexibility.
Risks & watch-outs
- Watch-outs: built in 1895 — expect roof / HVAC / electrical / plumbing capex.
Questions for the listing agent
- Built in 1895 — when were the roof, HVAC, electrical panel, plumbing, and water heater last replaced?
- Is there a deadline driving the sale (1031 exchange, divorce, estate, relocation)? That informs how much negotiation room exists.
- Schools are F-rated, which usually means shorter tenancies and higher turnover. Who's the typical renter profile here, and what's been the actual vacancy rate?
- What's the average days-on-market for RENTAL listings here right now (not sales)? A rising rental-DOM trend means longer vacancies and softer asking-rent achievability than the comps imply.
- What's the recent tenant-quality profile in this submarket — average credit score on applications, eviction rate, late-payment / NSF rate, and stable-employment percentage? A property-management company in the area should have these aggregated.
- How much new for-sale + rental construction is in the pipeline within 1–3 miles? Heavy new supply typically softens prices + rents 12–24 months out; constrained supply supports both.
Investment metrics
- 1% rule
- 1.61% ✓
- Cap rate
- 14.08%
- Cash-on-cash
- 27.80%
- DSCR
- 2.24
- GRM
- 5.2
CMA / ARV
- ARV (on-the-fly)
- $171,875
- Comps found
- 1
Show comp detail 1 sale within ~0.75 mi
| Address | Dist | Beds/Ba | Sqft | Sold | Price | $/sf | Match |
|---|---|---|---|---|---|---|---|
| 308 Ltc Paul Finken St | 0.17mi | 2/2.0 (-1) | 1,324 (-4%) | 2mo | $165,000 | $125 | 75 |
Match score weights: distance 35% · size 25% · config 20% · recency 20%. Top-matched comps best support the ARV.
Projected returns pro-forma
2.74% appreciation · 3.0% rent growth · sell at horizon
- IRR
- 33.3%
- Equity multiple
- 2.86×
- Total profit
- $37,693
- Equity at exit
- $31,561
- IRR
- 33.8%
- Equity multiple
- 5.60×
- Total profit
- $93,428
- Equity at exit
- $47,846
Cash invested: $20,300 (down + closing). Projections, not guarantees.
Landlord ↔ Tenant lean methodology
- Overall (STATE)
- 83 Strongly Landlord-Friendly
- State Iowa
- 83 Strongly Landlord-Friendly · R+6
- County
- — inherits STATE
- City
- — inherits STATE
ZIP-level market 51530
- Home prices YoY
- 1.6%
- Active inventory
- 2
- Price-to-rent
- 5.2×
Monthly cashflow live
- Estimated rent
- $1,165 medium interval (Pro) →
- Mortgage (P&I)
- −$380
- Tax from tax record
- −$40 /mo · $474/yr
- Insurance
- −$30
- HOA
- −$0
- Vacancy / Maint / Mgmt
- −$245
- Net cashflow
- $470
Break-even live
Sensitivity live
| Price | -10% $511 | -5% $491 | +0% $470 | +5% $450 | +10% $429 |
|---|---|---|---|---|---|
| Rent | -10% $378 | -5% $424 | +0% $470 | +5% $516 | +10% $562 |
| Rate | -1.0pp $507 | -0.5pp $489 | base $470 | +0.5pp $451 | +1.0pp $432 |
UW: 25.0% down · 7.5% · 30yr · 1.5% tax · 5.0% vac · 8.0% maint · 8.0% mgmt
Financing live
Cash to close
- Down payment
- $18,125
- Closing costs
- $2,175
- Reserves months
- —
- Total cash needed
- —
Loan-product check · same deal, 3 products live
Conventional
25% down · 7.5% · 30yr
- Down + closing
- —
- Monthly P&I
- —
- Monthly cashflow
- —
- DSCR
- —
- Eligible?
- —
Personal DTI + credit; lowest rate.
DSCR
20% down · 8.5% · 30yr
- Down + closing
- —
- Monthly P&I
- —
- Monthly cashflow
- —
- DSCR
- —
- Eligible?
- —
No personal income docs; deal must DSCR.
Hard money
10% down · 12.0% · 12mo
- Down + closing
- —
- Monthly P&I
- —
- Monthly cashflow
- —
- DSCR
- —
- Eligible?
- —
Short-term bridge; refi at stabilization.
Listing history 17 events
-
2026-06-21days on market $72,500 Active 28 DOM
-
2026-06-18days on market $72,500 Active 26 DOM
-
2026-06-17days on market $72,500 Active 25 DOM
-
2026-06-16days on market $72,500 Active 24 DOM
-
2026-06-15days on market $72,500 Active 23 DOM
-
2026-06-13days on market $72,500 Active 21 DOM
-
2026-06-12days on market $72,500 Active 20 DOM
-
2026-06-09days on market $72,500 Active 17 DOM
-
2026-06-08days on market $72,500 Active 16 DOM
-
2026-06-07days on market $72,500 Active 15 DOM
-
2026-06-05days on market $72,500 Active 13 DOM
-
2026-06-04days on market $72,500 Active 11 DOM
-
2026-06-02days on market $72,500 Active 10 DOM
-
2026-06-01days on market $72,500 Active 9 DOM
-
2026-05-31days on market $72,500 Active 8 DOM
-
2026-05-31days on market $72,500 Active 7 DOM
-
2026-05-22$72,500 Active
ⓘ Source: listings_history table (triggers on properties + properties_extension) + one-shot
backfill from property_details.listing_events for pre-trigger history.
Tax reassessment forecast IA · Partial reset (capped growth)
- Current annual tax
- $474 · $40/mo
- Projected year-2 tax
- $806 · $67/mo
- Expected delta
- +$332/yr (+$28/mo · 70.1%)
ⓘ Screening estimate from a state-policy table — verify with the county assessor before closing.
Climate risk First Street
- Flood 1/10 Low FEMA zone X (unshaded) · 0% chance over 30 yrs
- Wildfire 1/10 Low
- Heat 3/10 Moderate 7 d/yr ≥101°F today · 15 d/yr by 30 yrs out
- Wind 2/10 Low
- Air quality 1/10 Low 0 unhealthy d/yr today · 0 by 30 yrs out
Nearby sold comps map
Loading sold comps map…
Walkable amenities ~0.75 mi
Loading nearby amenities…
Taxation est. · year 1
- Rental income
- $13,977
- − Mortgage interest
- −$4,061
- − Property taxes
- −$474
- − Insurance
- −$362
- − Repairs & maintenance
- −$1,118
- − Management
- −$1,118
- − Depreciation
- −$2,109
- Taxable income
- $4,734
- Est. tax owed @ 24.0%
- −$1,136
- After-tax cash flow
- $4,507/yr
For passive investors: Depreciation is non-cash, so a rental often shows a tax loss while cash-flowing — sheltering income. Rental losses are passive: they offset passive income freely, and up to $25,000/yr can offset ordinary (W-2) income if you actively participate and your MAGI is under $100k (phasing out to $0 by $150k); unused losses carry forward. On sale, claimed depreciation is recaptured at up to 25%, and gains may owe capital-gains tax (a 1031 exchange can defer both). Figures are a year-1 estimate at your 24.0% rate — not tax advice; consult a CPA.
Schools (NCES district)
- District
- Harlan Community School District
- NCES district ID
- 1913500
- Math proficiency
- 72% ▼ -7.00%
- Reading proficiency
- 77% ▼ -3.00%
- Median HH income
- $48,557
- Composite
- 62.95/100
- National rank
- #656
- State rank
- #81 of 289 in IA
Livability — Earling
- Score
- 60/100
- State rank
- #812
- US rank
- #18658
Category grades
Schools grade is shown separately in the Schools card above.
Census & demographics
- Census place
- Earling, IA
- Population (ZIP)
- 710
Population outlook (Shelby County) Hauer SSP2
- Today (2025)
- 11,637 people
- By 2030
- 11,472 · -1.4%
- By 2040
- 11,146 · -4.2%
- By 2050
- 10,791 · -7.3%
- By 2075
- 10,601 · -8.9%
- By 2100
- 10,338 · -11.2%
Race, ethnicity, and origin ACS 2023
- Neighborhood character
- Predominantly White (90%)
- Race & ethnicity
- White 90% Hispanic / Latino 8% Two or more races 6% Black 1%
- Hispanic origin (detail)
- Mexican 7%
- Common ancestry
- Portuguese 1% Iranian 1%
Political lean MEDSL · Shelby
- 2024 margin
- Solid R (+43.0) · D 27.9% · R 70.9% · Other 1.2%
- 2008→2024 swing
- -33.3pp toward R · 2008: -9.7pp · 2024: -43.0pp
- All cycles
- 2024: R+43.0 2020: R+40.3 2016: R+42.9 2012: R+22.2 2008: R+9.7
Not yet ingested
- Civics
- —
Market trends
- HPI YoY
- ▲ 2.74%
- Current HPI
- 175.0835
- Rent YoY
- —
- Metro
- —
- State GDP YoY
- ▲ 2.48%
- F500 in state
- 4
Industry mix (Fortune 500 HQ in IA)
| Industry | F500 HQs | Revenue |
|---|---|---|
| Financial Services | 1 | $16B |
|
||
| Retail / Convenience | 1 | $15B |
|
||
Price history
1 event — show timeline
- 2026-05-22 Listed $72,500 IAR
Property tax history
+8.7%/yrLatest (2025): $474 · -32.5% YoY. Source: county tax records.
Cash-flow waterfall
monthlySold comps — $/sqft
last 12 mo · ≤1 miLoading sold comps…