9040 Palmas Grandes Blvd · Bonita Springs, FL
Flood risk 5/10 · Moderate
- FEMA flood zone
- X (unshaded)
- Chance of flooding over 30 yrs
- 0.23%
- Est. flood insurance / yr
- $507 – $1,088
Fire risk 1/10 · Minimal
- Est. fire insurance / yr
- $947 – $1,759
Heat risk 10/10 · Severe
- Hot days now (above 107°F)
- 7 days/yr
- Hot days in 30 yrs
- 30 days/yr
Wind risk 10/10 · Severe
- Chance of severe wind over 30 yrs
- 99.0%
Air-quality risk 2/10 · Minimal
- Unhealthy air days now
- 1 days/yr
- Unhealthy air days in 30 yrs
- 1 days/yr
Risk factors via First Street. Map © Google.
Why this score? — see what drove the C- grade
The composite is a weighted blend of 9 inputs, each scored 0–100. Each bar is that input's sub-score; the figure is the points it added to the 100-point composite (weight × sub-score).
- Cash flow +21.7/30.0
- ARV discount +7.5/15.0
- DSCR +6.9/10.0
- 1% rule +5.7/10.0
- Schools +4.1/10.0
- Livability +3.5/5.0
- Rent growth +2.3/5.0
- Condition / age +2.2/5.0
- Appreciation +0.0/10.0
$550,000
🖨 Deal sheet 📄 Offer letter ✓ Due diligence
Listing remarks
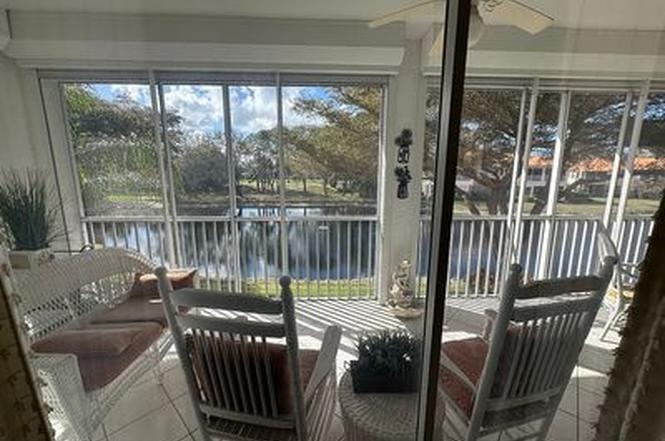
Beautiful view. 3/3 with office, utility room, 2 car garage & amp; elevator. Rarely available upstairs unit with elevator. Being sold turnkey & acirc; & euro; & brvbar; bring your toothbrush!!
Key facts
- Built 2001
- Listed 8 days
Neighborhood map
What this means for you Summary
Snapshot
- This is a 3-bed/3.0-bath other listed at $550k. Condition is rated fair.
Deal economics
- At list price, monthly cash flow is $849 ($10k/yr) — positive.
- The deal already cash-flows at list — no discount required.
- Meets the 1% rule at list price ($6k rent vs $550k).
- Cap rate 8.1% vs local median 1.7% in Bonita Springs — top-decile yield for the area; either an underpriced asset or a hidden risk that comps aren't pricing in. Stress-test before assuming the spread holds.
Location & tenants
- Location reads 70/100 on livability (#428 in FL) — a middle-class / working-renter tenant base. Strengths: crime A+, housing A+, employment A; Watch: schools C-, cost of living C-, health & safety D.
- Lee (suburban): math 47% / reading 50% proficiency, ranked #42 of 73 in FL (top 58%) — families likely to look elsewhere, expect single-tenant / working-renter base with shorter leases.
- Market conditions: Rents soft (-0.6%/yr); 835 active listings in the ZIP; 40 comparable units currently listed for rent nearby; rentals at typical pace (median 24d on market — plan ~3-4 weeks tenant-placement turnaround); solid renter incomes; 15,411 units permitted in Lee County in 2024 (4,686 in 5+ unit buildings).
- At $5,886/mo this rent would consume 77% of the median local household income ($91k/yr) (locally 976% of renters already pay >50% of income on rent) — very limited rent-growth headroom before tenants either downsize or default.
Forward outlook
- Local home prices are declining (-3.0%/yr); year-one equity from $4k of loan paydown is wiped out by about $16k of value loss. Plan a longer hold.
- Lee County population projected at +44% by 2050 — long-run rental-demand tailwind backs the buy-and-hold thesis.
Negotiation context
- Only 8 days on market — expect competitive offers; lowballing is unlikely to land.
Risks & watch-outs
- Climate carrying-cost: moderate flood risk; severe wind risk, 99% chance of damaging wind over 30y; extreme-heat days projected 7→30/yr by 2055 (HVAC capex compounding) — expect insurance premiums to compound above CPI over the hold.
Questions for the listing agent
- Have any recent inspections been done? Can we get a copy of the seller's disclosures and any deferred-maintenance estimates?
- Is there a deadline driving the sale (1031 exchange, divorce, estate, relocation)? That informs how much negotiation room exists.
- What's the average days-on-market for RENTAL listings here right now (not sales)? A rising rental-DOM trend means longer vacancies and softer asking-rent achievability than the comps imply.
- What's the recent tenant-quality profile in this submarket — average credit score on applications, eviction rate, late-payment / NSF rate, and stable-employment percentage? A property-management company in the area should have these aggregated.
- How much new for-sale + rental construction is in the pipeline within 1–3 miles? Heavy new supply typically softens prices + rents 12–24 months out; constrained supply supports both.
Investment metrics
- 1% rule
- 1.07% ✓
- Cap rate
- 8.15%
- Cash-on-cash
- 6.62%
- DSCR
- 1.29
- GRM
- 7.8
CMA / ARV
No comps found within radius.
Projected returns pro-forma
-3.0% appreciation · 0.0% rent growth · sell at horizon
- IRR
- -9.6%
- Equity multiple
- 0.66×
- Total profit
- $-52,197
- Equity at exit
- $82,007
- IRR
- -4.8%
- Equity multiple
- 0.73×
- Total profit
- $-42,111
- Equity at exit
- $47,554
Cash invested: $154,000 (down + closing). Projections, not guarantees.
Landlord ↔ Tenant lean methodology
- Overall (STATE)
- 87 Strongly Landlord-Friendly
- State Florida
- 87 Strongly Landlord-Friendly · R+3
- County
- — inherits STATE
- City
- — inherits STATE
ZIP-level market 34135
- Rents YoY
- -0.6%
- Active inventory
- 835
- Price-to-rent
- 7.8×
Monthly cashflow live
- Estimated rent
- $5,886 high interval (Pro) →
- Mortgage (P&I)
- −$2,884
- Tax est. 1.5%
- −$688 /mo · $8,250/yr
- Insurance
- −$229
- HOA
- −$0
- Vacancy / Maint / Mgmt
- −$1,236
- Net cashflow
- $849
Break-even live
UW: 25.0% down · 7.5% · 30yr · 1.5% tax · 5.0% vac · 8.0% maint · 8.0% mgmt
Financing live
Cash to close
- Down payment
- $137,500
- Closing costs
- $16,500
- Reserves months
- —
- Total cash needed
- —
Loan-product check · same deal, 3 products live
Conventional
25% down · 7.5% · 30yr
- Down + closing
- —
- Monthly P&I
- —
- Monthly cashflow
- —
- DSCR
- —
- Eligible?
- —
Personal DTI + credit; lowest rate.
DSCR
20% down · 8.5% · 30yr
- Down + closing
- —
- Monthly P&I
- —
- Monthly cashflow
- —
- DSCR
- —
- Eligible?
- —
No personal income docs; deal must DSCR.
Hard money
10% down · 12.0% · 12mo
- Down + closing
- —
- Monthly P&I
- —
- Monthly cashflow
- —
- DSCR
- —
- Eligible?
- —
Short-term bridge; refi at stabilization.
Rent comps 40 comps
| Address | Beds | Baths | Sqft | Rent | $/sqft | DOM | Units | Dist |
|---|---|---|---|---|---|---|---|---|
| 8990 Palmas Grandes Blvd #201 Bonita Springs, FL | 2.0 | 2.0 | 1797 | $5,000 | $2.78 | 23d | 1 | 0.04mi |
| 28052 Palmas Grandes Ln #101 Bonita Springs, FL | 2.0 | 2.0 | 1500 | $7,200 | $4.80 | 23d | 1 | 0.07mi |
| 8981 Palmas Grandes Blvd #102 Bonita Springs, FL | 2.0 | 2.0 | 1791 | $7,500 | $4.19 | 23d | 1 | 0.08mi |
| 9030 Las Maderas Dr #101 Bonita Springs, FL | 2.0 | 2.0 | 1432 | $2,500 | $1.75 | 23d | 1 | 0.14mi |
| 9111 Las Maderas Dr #102 Bonita Springs, FL | 2.0 | 2.0 | 1624 | $7,500 | $4.62 | 23d | 1 | 0.17mi |
| 9021 Las Maderas Dr #202 Bonita Springs, FL | 2.0 | 2.0 | 1674 | $7,500 | $4.48 | 23d | 1 | 0.17mi |
| 28105 Mandolin Ct #213 Bonita Springs, FL | 3.0 | 2.0 | 1500 | $2,600 | $1.73 | 23d | 1 | 0.26mi |
| 9040 Carolina St Unit 1073518P Bonita Springs, FL | 4.0 | 3.0 | 1915 | $7,937 | $4.14 | 15d | 1 | 0.36mi |
| 28399 Del Lago Way Bonita Springs, FL | 4.0 | 2.5 | 2326 | $10,000 | $4.30 | 23d | 1 | 0.41mi |
| 27500 Palmesta Cir Bonita Springs, FL | 3.0 | 2.0 | 1560 | $2,400 | $1.54 | 3d | 1 | 0.51mi |
| 27500 Palmesta Cir Unit 41 Bonita Springs, FL | 3.0 | 2.0 | 1900 | $2,400 | $1.26 | 23d | 1 | 0.52mi |
| 27490 Palmesta Cir Unit 37 Bonita Springs, FL | 3.0 | 2.0 | 1900 | $2,400 | $1.26 | 23d | 1 | 0.52mi |
| 27470 Palmesta Cir Unit 29 Bonita Springs, FL | 3.0 | 2.0 | 1900 | $2,400 | $1.26 | 23d | 1 | 0.53mi |
| 28790 Versol Dr Bonita Springs, FL | 1.0–3.0 | 1.0–2.0 | 1075 | $3,391 | $3.15 | 1d | 19 | 0.54mi |
| 3561 Imperial Crossing Dr Bonita Springs, FL | 1.0–3.0 | 1.0–2.0 | 1122 | $3,650 | $3.25 | 2d | 19 | 0.56mi |
| 27911 Hacienda East Blvd Unit 217B Bonita Springs, FL | 2.0 | 2.0 | 1500 | $2,100 | $1.40 | 3d | 1 | 0.58mi |
| 28119 Tamberine Ct #1412 Bonita Springs, FL | 3.0 | 2.0 | 1593 | $5,800 | $3.64 | 23d | 1 | 0.58mi |
| 27430 Palmesta Cir #16 Bonita Springs, FL | 3.0 | 2.0 | 1900 | $2,400 | $1.26 | 23d | 1 | 0.59mi |
| 27526 Los Amigos Ln Unit 1073491P Bonita Springs, FL | 3.0 | 2.0 | 1657 | $5,283 | $3.19 | 1d | 1 | 0.59mi |
| 27420 Palmesta Cir #12 Bonita Springs, FL | 3.0 | 2.0 | 1900 | $2,400 | $1.26 | 23d | 1 | 0.59mi |
| 9908 White Sands Pl Bonita Springs, FL | 3.0 | 2.0 | 1827 | $7,500 | $4.11 | 23d | 1 | 0.60mi |
| 27750 Hacienda East Blvd Unit 208B Bonita Springs, FL | 2.0 | 2.5 | 1528 | $3,800 | $2.49 | 23d | 1 | 0.61mi |
| 28452 Del Lago Way Bonita Springs, FL | 4.0 | 3.0 | 2201 | $7,700 | $3.50 | 23d | 1 | 0.64mi |
| 27414 Pollard Dr Unit 1073493P Bonita Springs, FL | 3.0 | 2.0 | 1593 | $5,065 | $3.18 | 3d | 1 | 0.64mi |
| 27791 Hacienda East Blvd Unit 222D Bonita Springs, FL | 2.0 | 2.5 | 1528 | $4,200 | $2.75 | 23d | 1 | 0.65mi |
| 27311 J C Ln Bonita Springs, FL | 3.0 | 2.0 | 1730 | $3,000 | $1.73 | 15d | 1 | 0.65mi |
| 27439 Pollard Dr Bonita Springs, FL | 3.0 | 2.0 | 1552 | $9,500 | $6.12 | 23d | 1 | 0.67mi |
| 3620 Bailes St Bonita Springs, FL | 3.0 | 3.0 | 1992 | $12,000 | $6.02 | 23d | 1 | 0.69mi |
| 28327 Hidden Lake Dr Bonita Springs, FL | 3.0 | 2.0 | 1567 | $8,950 | $5.71 | 23d | 1 | 0.71mi |
| 27681 Hacienda East Blvd Bonita Springs, FL | 2.0 | 2.5 | 1675 | $3,000 | $1.79 | 23d | 1 | 0.71mi |
| 9940 Treasure Cay Ln Bonita Springs, FL | 3.0 | 2.0 | 2108 | $8,500 | $4.03 | 23d | 1 | 0.73mi |
| 28700 Trails Edge Blvd Bonita Springs, FL | 3.0 | 2.0 | 1458 | $2,175 | $1.49 | 3d | 2 | 0.73mi |
| 28567 Clinton Ln Bonita Springs, FL | 3.0 | 3.5 | 2285 | $13,000 | $5.69 | 13d | 1 | 0.74mi |
| 28567 Clinton Ln Bonita Springs, FL | 3.0 | 3.5 | 2285 | $13,000 | $5.69 | 19d | 1 | 0.74mi |
| 28611 Carriage Home Dr #101 Bonita Springs, FL | 2.0 | 2.0 | 1433 | $2,550 | $1.78 | 23d | 1 | 0.75mi |
| 28460 Highgate Dr Bonita Springs, FL | 2.0 | 2.0 | 1871 | $10,500 | $5.61 | 23d | 1 | 0.78mi |
| 27581 Hacienda East Blvd Unit 1256822P Bonita Springs, FL | 2.0 | 2.5 | 1808 | $3,133 | $1.73 | 19d | 1 | 0.79mi |
| 28650 Carriage Home Dr Unit 1049692P Bonita Springs, FL | 3.0 | 2.0 | 1528 | $3,980 | $2.60 | 15d | 1 | 0.84mi |
| 28450 Winthrop Cir Unit 1546014P Bonita Springs, FL | 3.0 | 2.0 | 1894 | $7,804 | $4.12 | 13d | 1 | 0.88mi |
| 9977 Treasure Cay Ln Bonita Springs, FL | 3.0 | 2.0 | 2039 | $8,500 | $4.17 | 23d | 1 | 0.88mi |
Listing history 5 events
-
2026-06-17days on market $550,000 Active 8 DOM
-
2026-06-16days on market $550,000 Active 7 DOM
-
2026-06-16days on market $550,000 Active 6 DOM
-
2026-06-13remarks 192-char remark
-
2026-06-13$550,000 Active 4 DOM
ⓘ Source: listings_history table (triggers on properties + properties_extension) + one-shot
backfill from property_details.listing_events for pre-trigger history.
Climate risk First Street
- Flood 5/10 Major FEMA zone X (unshaded) · 23% chance over 30 yrs
- Wildfire 1/10 Low
- Heat 10/10 Extreme 7 d/yr ≥107°F today · 30 d/yr by 30 yrs out
- Wind 10/10 Extreme 99% chance of damaging wind over 30 yrs
- Air quality 2/10 Low 1 unhealthy d/yr today · 1 by 30 yrs out
Nearby sold comps map
Loading sold comps map…
Walkable amenities ~0.75 mi
Loading nearby amenities…
Taxation est. · year 1
- Rental income
- $70,635
- − Mortgage interest
- −$30,809
- − Property taxes
- −$8,250
- − Insurance
- −$2,750
- − Repairs & maintenance
- −$5,651
- − Management
- −$5,651
- − Depreciation
- −$16,000
- Taxable income
- $1,525
- Est. tax owed @ 24.0%
- −$366
- After-tax cash flow
- $9,825/yr
For passive investors: Depreciation is non-cash, so a rental often shows a tax loss while cash-flowing — sheltering income. Rental losses are passive: they offset passive income freely, and up to $25,000/yr can offset ordinary (W-2) income if you actively participate and your MAGI is under $100k (phasing out to $0 by $150k); unused losses carry forward. On sale, claimed depreciation is recaptured at up to 25%, and gains may owe capital-gains tax (a 1031 exchange can defer both). Figures are a year-1 estimate at your 24.0% rate — not tax advice; consult a CPA.
Condition & rehab AI · 1 photo
The home requires significant exterior repairs and maintenance, including repainting and landscaping, to improve its condition and value.
Repairs flagged
- Major roof — Signs of potential leakage and wear.
- Major exterior siding — Faded and in need of repainting.
- Minor landscaping — Overgrown and in need of trimming and maintenance.
Value-add opportunities
- Both painting the exterior — Fresh paint would improve the home's curb appeal and resale value.
- Both landscaping maintenance — A well-maintained yard enhances the home's overall appearance and can attract more potential buyers or renters.
Renovation cost estimate screening
| Repair item | Severity | Est. cost |
|---|---|---|
| roof · Signs of potential leakage and wear. | Major | $15,000–50,000 |
| exterior siding · Faded and in need of repainting. | Major | $15,000–50,000 |
| landscaping · Overgrown and in need of trimming and maintenance. | Minor | $500–3,000 |
| Total estimated repair cost · 3 items | $30,500–103,000 |
Value-add ROI direction
- Both painting the exterior — Fresh paint would improve the home's curb appeal and resale value. ↑
- Both landscaping maintenance — A well-maintained yard enhances the home's overall appearance and can attract more potential buyers or renters. ↑
ⓘ Cost ranges are severity-bucket heuristics (US national rule-of-thumb). Get contractor quotes + a written scope before underwriting a rehab budget.
Schools (NCES district)
- District
- Lee
- NCES district ID
- 1201080
- Math proficiency
- 47% ▼ -11.00%
- Reading proficiency
- 50% ▼ -4.00%
- Median HH income
- $49,518
- Composite
- 41.49/100
- National rank
- #3458
- State rank
- #42 of 73 in FL
Livability — Bonita Springs
- Score
- 70/100
- State rank
- #428
- US rank
- #7576
Category grades
Schools grade is shown separately in the Schools card above.
Census & demographics
- Census place
- Bonita Springs, FL
- County
- Lee County · 788,662 people
- City population
- 64,727
- Metro
- Cape Coral-Fort Myers, FL
- Population (ZIP)
- 48,252
- Household income
- $91,380
- Rent vs Own
- Severe rent burden
- 976.0
Population outlook (Lee County) Hauer SSP2
- Today (2025)
- 871,946 people
- By 2030
- 955,468 · +9.6%
- By 2040
- 1,113,587 · +27.7%
- By 2050
- 1,256,891 · +44.1%
- By 2075
- 1,560,270 · +78.9%
- By 2100
- 1,726,848 · +98.0%
Race, ethnicity, and origin ACS 2023
- Neighborhood character
- Predominantly White (69%)
- Race & ethnicity
- White 69% Hispanic / Latino 26% Two or more races 13% Native American 3% Black 2%
- Hispanic origin (detail)
- Mexican 8% Puerto Rican 4% Cuban 3%
- Common ancestry
- Romanian 5% Lithuanian 2% Slovak 2%
- Foreign-born
- 22% · Canada, Jamaica
- Languages at home
- 74% English-only · Spanish 21% French/Haitian/Cajun 1% Russian/Polish/Slavic 1%
Political lean MEDSL · Lee
- 2024 margin
- Strong R (+28.4) · D 35.5% · R 63.9%
- 2008→2024 swing
- -18.0pp toward R · 2008: -10.4pp · 2024: -28.4pp
- All cycles
- 2024: R+28.4 2020: R+19.2 2016: R+20.4 2012: R+16.6 2008: R+10.4
Not yet ingested
- Civics
- —
Market trends
- HPI YoY
- ▼ -188.86%
- Current HPI
- 243.4153
- Rent YoY
- ▼ -0.61%
- Metro
- Cape Coral-Fort Myers, FL
- State GDP YoY
- ▲ 3.28%
- F500 in state
- 36
Industry mix (Fortune 500 HQ in FL)
| Industry | F500 HQs | Revenue |
|---|---|---|
| Industrial Technology | 2 | $29B |
|
||
| Insurance | 2 | $17B |
|
||
| Retail | 1 | $60B |
|
||
| Technology Distribution | 1 | $58B |
|
||
| Homebuilding | 1 | $35B |
|
||
| Technology Manufacturing | 1 | $35B |
|
||
Price history
1 event — show timeline
- 2026-06-10 Listed $550,000 FSBO.com
Cash-flow waterfall
monthlySold comps — $/sqft
last 12 mo · ≤1 miLoading sold comps…