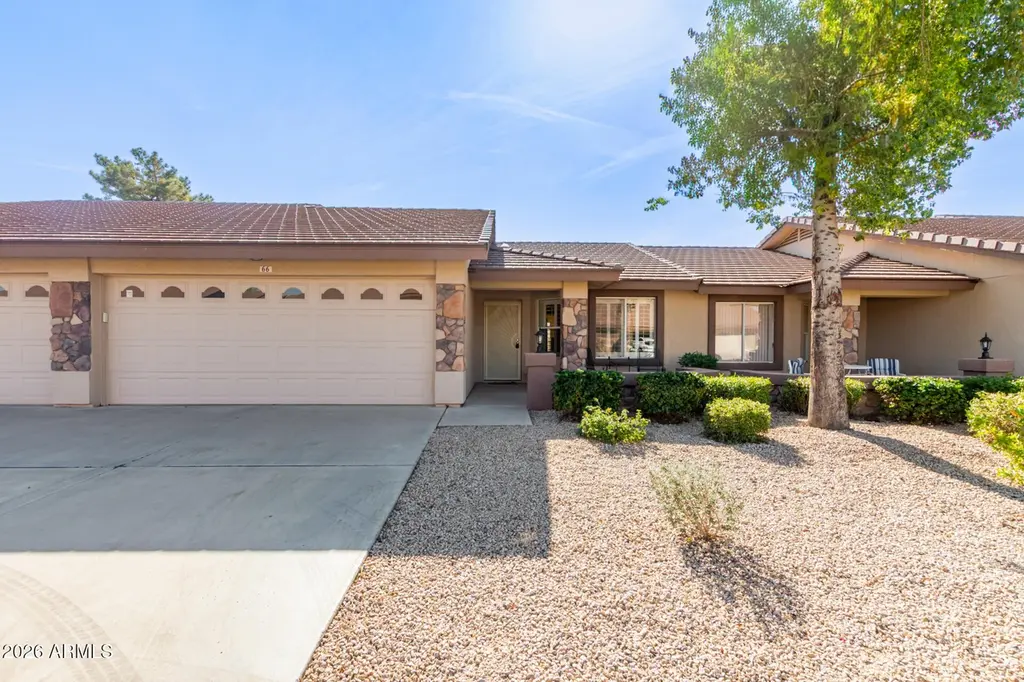
11360 E Keats Ave #66 · Mesa, AZ
Flood risk 1/10 · Minimal
- FEMA flood zone
- X (shaded)
- Chance of flooding over 30 yrs
- 0.0%
- Est. flood insurance / yr
- $507 – $1,088
Fire risk 4/10 · Minor
- Est. fire insurance / yr
- $610 – $1,132
Heat risk 9/10 · Severe
- Hot days now (above 111°F)
- 7 days/yr
- Hot days in 30 yrs
- 18 days/yr
Wind risk 1/10 · Minimal
- Chance of severe wind over 30 yrs
- —
Air-quality risk 3/10 · Minor
- Unhealthy air days now
- 2 days/yr
- Unhealthy air days in 30 yrs
- 3 days/yr
Risk factors via First Street. Map © Google.
Why this score? — see what drove the D- grade
The composite is a weighted blend of 9 inputs, each scored 0–100. Each bar is that input's sub-score; the figure is the points it added to the 100-point composite (weight × sub-score).
- ARV discount +11.1/15.0
- Cash flow +6.4/30.0
- Appreciation +5.7/10.0
- Schools +4.6/10.0
- Livability +4.0/5.0
- Rent growth +2.6/5.0
- Condition / age +2.5/5.0
- 1% rule +1.9/10.0
- DSCR +0.7/10.0
$315,000
🖨 Deal sheet 📄 Offer letter ✓ Due diligence
Listing remarks MLS
Discover this charming 2-bedroom townhome in the popular Sunland Springs Village! Inside, you'll find an open layout with wood-look flooring, carpet in all the right places, and a soothing palette that makes every area perfect for entertaining and relaxation. Whip up your signature dishes in the pristine kitchen, displaying cabinets adorned with crown molding, tile backsplash, a spacious peninsula with a breakfast bar, a pantry, and built-in appliances. The primary retreat promises a good night's sleep and boasts a walk-in closet and a private bathroom. The screened-in patio is perfect for casual dining. Enjoy your morning brew on the patio, and remember to visit the community's pool, spa, golf, workout facility, and tennis court, just to mention a few! Hurry up, this one won't last!
Key facts
- Wood look flooring
- Open layout
- Walk in closet
Tags
Neighborhood map
What this means for you Summary
Snapshot
- This is a 2-bed/2.0-bath condo listed at $315k.
Deal economics
- At list price, monthly cash flow is $-545 ($-7k/yr) — negative.
- To cash-flow at today's rent, offer at most $219k (30.6% below list).
- To meet the 1% rule (rent ≥ 1% of price), the offer needs to be $218k (30.7% below list).
- Recommended offer: $218k (30.7% below list) — sets the bar for 1% rule.
- Cap rate 4.2% vs local median 3.4% in Mesa — meaningfully above typical; check what's discounted (condition, days-on-market, listing class) to confirm the premium yield is real.
Location & tenants
- Location reads 79/100 on livability (#6 in AZ, #2,034 nationally) — a middle-class / working-renter tenant base. Strengths: amenities A+, commute A+, housing A+; Watch: health & safety C-, crime D.
- Gilbert Unified District (4239) (suburban): math 49% / reading 52% proficiency, ranked #38 of 249 in AZ (top 15%) — acceptable for families but not a draw, mixed tenant base, ~2y average lease; only 14% free/reduced lunch — higher-income household profile.
- Market conditions: Rents flat; 165 active listings in the ZIP; 12 comparable units currently listed for rent nearby; rentals at typical pace (median 24d on market — plan ~3-4 weeks tenant-placement turnaround); solid renter incomes; 36,011 units permitted in Maricopa County in 2024 (12,801 in 5+ unit buildings).
- This rent runs 31% of the median local income ($84k/yr) — at the standard rent-burdened threshold; future hikes will face affordability resistance.
Forward outlook
- In year one you build about $7k of equity ($2k loan paydown + $5k appreciation (1.4% local appreciation)).
- Maricopa County population projected at +38% by 2050 — long-run rental-demand tailwind backs the buy-and-hold thesis.
- By year 5, paydown + projected appreciation supports a ~$30k cash-out refi (75% LTV) — recoverable capital for the next deal without selling this one.
Negotiation context
- It's been on market 153 days — a 12% lower offer ($277k) is reasonable based on typical stale-listing flexibility.
- Current owner paid $141k; list at $315k implies a 123% gain — meaningful room to come down on a strong offer.
Risks & watch-outs
- Climate carrying-cost: extreme-heat days projected 7→18/yr by 2055 (HVAC capex compounding) — expect insurance premiums to compound above CPI over the hold.
Questions for the listing agent
- What do current leases actually rent for vs. the listed asking? Can we see a recent rent roll and the last 12 months of T-12 income?
- It's been on market 153 days. Have you received any prior offers? Is the seller open to a 31% concession, seller financing, or rate buy-down credit?
- What does the HOA fee cover, when was the last increase, and are there any pending special assessments or reserve-fund shortfalls?
- Any open or pending special assessments — roof, HVAC, plumbing, elevator, façade? What's the per-unit balance and payoff schedule, and is the seller paying it off at close or rolling it to the buyer?
- Why hasn't it sold? Are there any deal-killer items the seller is aware of (foundation, flood, title, zoning, code violations)?
- Is there a deadline driving the sale (1031 exchange, divorce, estate, relocation)? That informs how much negotiation room exists.
- Crime grade is D in this area — have there been break-ins, vandalism, or insurance claims at this property in the last 3 years? What carrier currently insures it and at what premium?
- The area grade is low — what's the realistic commute time and amenity access for the typical tenant pool here? Any planned neighborhood developments (good or bad) we should know about?
- What's the average days-on-market for RENTAL listings here right now (not sales)? A rising rental-DOM trend means longer vacancies and softer asking-rent achievability than the comps imply.
- What's the recent tenant-quality profile in this submarket — average credit score on applications, eviction rate, late-payment / NSF rate, and stable-employment percentage? A property-management company in the area should have these aggregated.
- How much new apartment / multifamily construction is in the pipeline within 1–3 miles? Heavy new supply (>2% of stock underway) typically softens rents 12–24 months out; light construction supports rent growth.
Investment metrics
- 1% rule
- 0.69% ✗
- Cap rate
- 4.22%
- Cash-on-cash
- -7.42%
- DSCR
- 0.67
- GRM
- 12.0
CMA / ARV
- ARV (median comp)
- $342,186
- List price
- $315,000
- Delta
- -7.94%
- Verdict
- FAIR
- Comps
- 20 within 1.0 mi
Projected returns pro-forma
1.44% appreciation · 0.54% rent growth · sell at horizon
- IRR
- -6.0%
- Equity multiple
- 0.69×
- Total profit
- $-27,169
- Equity at exit
- $114,812
- IRR
- -1.9%
- Equity multiple
- 0.76×
- Total profit
- $-20,855
- Equity at exit
- $158,369
Cash invested: $88,200 (down + closing). Projections, not guarantees.
Landlord ↔ Tenant lean methodology
- Overall (STATE)
- 87 Strongly Landlord-Friendly
- State Arizona
- 87 Strongly Landlord-Friendly · R+3
- County
- — inherits STATE
- City
- — inherits STATE
ZIP-level market 85209
- Home prices YoY
- 0.5%
- Rents YoY
- 0.5%
- Active inventory
- 165
- Price-to-rent
- 12.0×
Monthly cashflow live
- Estimated rent
- $2,181 high interval (Pro) →
- Mortgage (P&I)
- −$1,652
- Tax from tax record
- −$127 /mo · $1,528/yr
- Insurance
- −$131
- HOA
- −$358
- Vacancy / Maint / Mgmt
- −$458
- Net cashflow
- $-545
Break-even live
UW: 25.0% down · 7.5% · 30yr · 1.5% tax · 5.0% vac · 8.0% maint · 8.0% mgmt
Financing live
Cash to close
- Down payment
- $78,750
- Closing costs
- $9,450
- Reserves months
- —
- Total cash needed
- —
Loan-product check · same deal, 3 products live
Conventional
25% down · 7.5% · 30yr
- Down + closing
- —
- Monthly P&I
- —
- Monthly cashflow
- —
- DSCR
- —
- Eligible?
- —
Personal DTI + credit; lowest rate.
DSCR
20% down · 8.5% · 30yr
- Down + closing
- —
- Monthly P&I
- —
- Monthly cashflow
- —
- DSCR
- —
- Eligible?
- —
No personal income docs; deal must DSCR.
Hard money
10% down · 12.0% · 12mo
- Down + closing
- —
- Monthly P&I
- —
- Monthly cashflow
- —
- DSCR
- —
- Eligible?
- —
Short-term bridge; refi at stabilization.
Rent comps 12 comps
| Address | Beds | Baths | Sqft | Rent | $/sqft | DOM | Units | Dist |
|---|---|---|---|---|---|---|---|---|
| 2101 S Yellow Wood #60 Mesa, AZ | 2.0 | 2.0 | 1371 | $2,600 | $1.90 | 1d | 1 | 0.29mi |
| 2101 S Yellow Wood #45 Mesa, AZ | 2.0 | 2.0 | 1081 | $1,649 | $1.53 | 43d | 1 | 0.29mi |
| 10865 E Keats Ave Mesa, AZ | 2.0 | 2.0 | 1165 | $2,550 | $2.19 | 24d | 1 | 0.51mi |
| 2350 S Olivewood #106 Mesa, AZ | 2.0 | 2.0 | 1081 | $1,595 | $1.48 | 3d | 1 | 0.72mi |
| 3454 S Warner Dr Apache Junction, AZ | 3.0 | 2.0 | 1300 | $2,500 | $1.92 | 24d | 1 | 0.94mi |
| 10529 E Hampton Ave Mesa, AZ | 1.0–2.0 | 1.0–2.0 | 950 | $2,567 | $2.70 | 5d | 32 | 1.08mi |
| 3000 W Southern Ave Apache Junction, AZ | 1.0–2.0 | 1.0–2.0 | 836 | $1,719 | $2.05 | 1d | 12 | 1.21mi |
| 2026 S Boca Cir Mesa, AZ | 3.0 | 2.0 | 1456 | $2,165 | $1.49 | 43d | 1 | 1.21mi |
| 10560 E Nichols Ave Mesa, AZ | 3.0 | 2.0 | 1704 | $3,495 | $2.05 | 24d | 1 | 1.29mi |
| 10638 E Olla Ave Mesa, AZ | 3.0 | 2.5 | 1535 | $2,140 | $1.39 | 24d | 1 | 1.31mi |
| 11329 E Elena Ave Mesa, AZ | 3.0 | 2.0 | 1544 | $2,695 | $1.75 | 24d | 1 | 1.35mi |
| 3117 S Signal Butte Rd #587 Mesa, AZ | 2.0 | 2.0 | 1064 | $1,495 | $1.41 | 3d | 1 | 1.49mi |
HOA detail condo
- Monthly dues
- $358 · $4,296/yr
- Likely covers
- pool
- Assessments
- None detected in remarks — confirm with the listing agent.
Listing history 14 events
-
2026-06-15days on market $315,000 Active 153 DOM
-
2026-06-13days on market $315,000 Active 151 DOM
-
2026-06-09days on market $315,000 Active 147 DOM
-
2026-06-08days on market $315,000 Active 146 DOM
-
2026-06-07days on market $315,000 Active 145 DOM
-
2026-06-04days on market $315,000 Active 142 DOM
-
2026-06-03days on market $315,000 Active 141 DOM
-
2026-06-02days on market $315,000 Active 140 DOM
-
2026-06-01days on market $315,000 Active 139 DOM
-
2026-05-31days on market $315,000 Active 138 DOM
-
2026-03-16price $315,000 794-char remark
Show marketing remark (794 chars)
Discover this charming 2-bedroom townhome in the popular Sunland Springs Village! Inside, you'll find an open layout with wood-look flooring, carpet in all the right places, and a soothing palette that makes every area perfect for entertaining and relaxation. Whip up your signature dishes in the pristine kitchen, displaying cabinets adorned with crown molding, tile backsplash, a spacious peninsula with a breakfast bar, a pantry, and built-in appliances. The primary retreat promises a good night's sleep and boasts a walk-in closet and a private bathroom. The screened-in patio is perfect for casual dining. Enjoy your morning brew on the patio, and remember to visit the community's pool, spa, golf, workout facility, and tennis court, just to mention a few! Hurry up, this one won't last!
-
2026-01-13$325,000 Active 794-char remark
Show marketing remark (794 chars)
Discover this charming 2-bedroom townhome in the popular Sunland Springs Village! Inside, you'll find an open layout with wood-look flooring, carpet in all the right places, and a soothing palette that makes every area perfect for entertaining and relaxation. Whip up your signature dishes in the pristine kitchen, displaying cabinets adorned with crown molding, tile backsplash, a spacious peninsula with a breakfast bar, a pantry, and built-in appliances. The primary retreat promises a good night's sleep and boasts a walk-in closet and a private bathroom. The screened-in patio is perfect for casual dining. Enjoy your morning brew on the patio, and remember to visit the community's pool, spa, golf, workout facility, and tennis court, just to mention a few! Hurry up, this one won't last!
-
2003-03-07soldstatus $141,000
-
2001-07-11soldstatus $125,207
ⓘ Source: listings_history table (triggers on properties + properties_extension) + one-shot
backfill from property_details.listing_events for pre-trigger history.
Tax reassessment forecast AZ · Resets to sale price
- Current annual tax
- $1,528 · $127/mo
- Projected year-2 tax
- $2,079 · $173/mo
- Expected delta
- +$551/yr (+$46/mo · 36.1%)
ⓘ Screening estimate from a state-policy table — verify with the county assessor before closing.
Climate risk First Street
- Flood 1/10 Low FEMA zone X (shaded) · 0% chance over 30 yrs
- Wildfire 4/10 Moderate
- Heat 9/10 Extreme 7 d/yr ≥111°F today · 18 d/yr by 30 yrs out
- Wind 1/10 Low
- Air quality 3/10 Moderate 2 unhealthy d/yr today · 3 by 30 yrs out
Nearby sold comps map
Loading sold comps map…
Walkable amenities ~0.75 mi
Loading nearby amenities…
Taxation est. · year 1
- Rental income
- $26,177
- − Mortgage interest
- −$17,645
- − Property taxes
- −$1,528
- − Insurance
- −$1,575
- − Repairs & maintenance
- −$2,094
- − Management
- −$2,094
- − HOA
- −$4,296
- − Depreciation
- −$9,164
- Taxable loss
- −$12,218
- Est. tax savings @ 24.0%
- +$2,932
- After-tax cash flow
- $-3,609/yr
For passive investors: Depreciation is non-cash, so a rental often shows a tax loss while cash-flowing — sheltering income. Rental losses are passive: they offset passive income freely, and up to $25,000/yr can offset ordinary (W-2) income if you actively participate and your MAGI is under $100k (phasing out to $0 by $150k); unused losses carry forward. On sale, claimed depreciation is recaptured at up to 25%, and gains may owe capital-gains tax (a 1031 exchange can defer both). Figures are a year-1 estimate at your 24.0% rate — not tax advice; consult a CPA.
Schools (NCES district)
- District
- Gilbert Unified District (4239)
- NCES district ID
- 0403400
- Math proficiency
- 49% ▼ -8.00%
- Reading proficiency
- 52% ▼ -7.00%
- Median HH income
- $74,715
- Composite
- 45.55/100
- National rank
- #2600
- State rank
- #38 of 249 in AZ
Livability — Mesa
- Score
- 79/100
- State rank
- #6
- US rank
- #2034
Category grades
Schools grade is shown separately in the Schools card above.
Census & demographics
- Census place
- Mesa, AZ
- County
- Maricopa County · 4,537,380 people
- City population
- 555,266
- Metro
- Phoenix-Mesa-Chandler, AZ
- Population (ZIP)
- 43,150
- Household income
- $84,432
- Rent vs Own
- Severe rent burden
- 972.0
Population outlook (Maricopa County) Hauer SSP2
- Today (2025)
- 4,979,203 people
- By 2030
- 5,378,229 · +8.0%
- By 2040
- 6,156,598 · +23.6%
- By 2050
- 6,872,376 · +38.0%
- By 2075
- 8,401,270 · +68.7%
- By 2100
- 9,247,439 · +85.7%
Race, ethnicity, and origin ACS 2023
- Neighborhood character
- Predominantly White (72%)
- Race & ethnicity
- White 72% Hispanic / Latino 15% Two or more races 9% Black 4% Asian 3%
- Hispanic origin (detail)
- Mexican 11%
- Common ancestry
- Portuguese 4% Romanian 3% Lithuanian 3%
- Foreign-born
- 9% · Canada, China, Vietnam
- Languages at home
- 87% English-only · Spanish 9% Tagalog/Filipino 1% Chinese 1%
Political lean MEDSL · Maricopa
- 2024 margin
- Toss-up / Even · D 47.7% · R 51.2% · Other 1.1%
- 2008→2024 swing
- +7.1pp toward D · 2008: -10.6pp · 2024: -3.5pp
- All cycles
- 2024: R+3.5 2020: D+2.2 2016: R+3.5 2012: R+12.0 2008: R+10.6
Not yet ingested
- Civics
- —
Market trends
- HPI YoY
- ▲ 1.44%
- Current HPI
- 277.6198
- Rent YoY
- ▲ 0.54%
- Metro
- Phoenix-Mesa-Chandler, AZ
- State GDP YoY
- ▲ 4.54%
- F500 in state
- 20
Industry mix (Fortune 500 HQ in AZ)
| Industry | F500 HQs | Revenue |
|---|---|---|
| Technology | 2 | $13B |
|
||
| Mining / Metals | 1 | $23B |
|
||
| Environmental Services | 1 | $16B |
|
||
| Metals / Steel | 1 | $14B |
|
||
| Technology Distribution | 1 | $9B |
|
||
| Homebuilding | 1 | $8B |
|
||
Price history
+151.6% since first listed4 events — show timeline
- 2026-03-16 Price Changed $315,000 ARMLS
- 2026-01-13 Listed $325,000 ARMLS
- 2003-03-07 Sold (Public Records) $141,000 Public Records
- 2001-07-11 Sold (Public Records) $125,207 Public Records
Property tax history
+2.0%/yrLatest (2025): $1,528 · +4.0% YoY. Source: county tax records.
Cash-flow waterfall
monthlySold comps — $/sqft
last 12 mo · ≤1 miLoading sold comps…