 Duplex
85 E 91 State Highway 3 · Vernon, IN
Flood risk 1/10 · Minimal
- FEMA flood zone
- X (unshaded)
- Chance of flooding over 30 yrs
- 0.0%
- Est. flood insurance / yr
- $507 – $1,088
Fire risk 1/10 · Minimal
- Est. fire insurance / yr
- $717 – $1,331
Heat risk 4/10 · Minor
- Hot days now (above 105°F)
- 7 days/yr
- Hot days in 30 yrs
- 20 days/yr
Wind risk 2/10 · Minimal
- Chance of severe wind over 30 yrs
- 1.0%
Air-quality risk 2/10 · Minimal
- Unhealthy air days now
- 0 days/yr
- Unhealthy air days in 30 yrs
- 1 days/yr
Risk factors via First Street. Map © Google.
Why this score? — see what drove the A- grade
The composite is a weighted blend of 9 inputs, each scored 0–100. Each bar is that input's sub-score; the figure is the points it added to the 100-point composite (weight × sub-score).
- Cash flow +30.0/30.0
- ARV discount +15.0/15.0
- 1% rule +10.0/10.0
- DSCR +10.0/10.0
- Appreciation +9.9/10.0
- Livability +3.2/5.0
- Schools +3.0/10.0
- Rent growth +2.5/5.0
- Condition / age +1.0/5.0
$99,900
🖨 Deal sheet (PDF) 📄 Offer letter ✓ Due diligence
Multi-family units
County records classify this as Multi-Family (2-4 Unit). Listing-text estimate: 2 units. confirmed
Listing remarks MLS
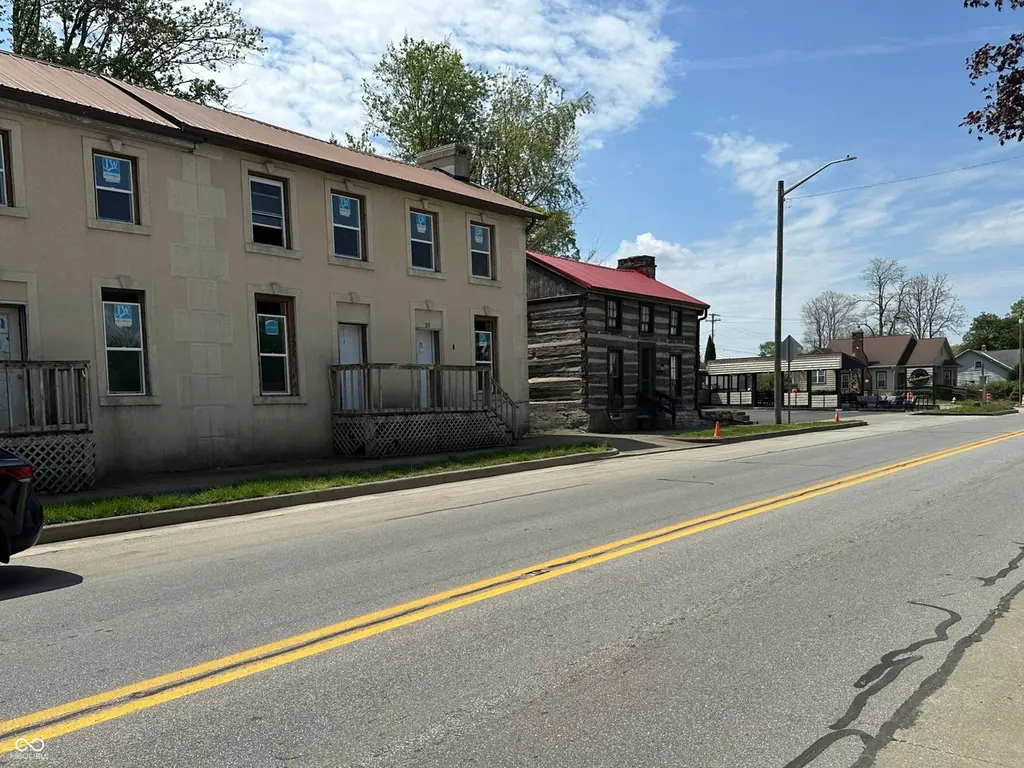
Own a piece of history with this circa 1830's building. This 3,630 sq. ft. building is currently a duplex. Each unit has been torn down to the studs and made structurally sound. All new windows throughout.
Key facts
- Circa 1830s building
- Structurally sound
- Duplex
Tags
Neighborhood map
What this means for you Summary
Snapshot
- This is a 2 × 2-bed/1-bath units multifamily listed at $100k. Condition is rated poor.
Deal economics
- At list price, monthly cash flow is $692 ($8k/yr) — positive. Per door: $346/mo.
- The deal already cash-flows at list — no discount required.
- Meets the 1% rule at list price ($2k rent vs $100k).
- Recommended offer: $88k (12.0% below list) — sets the bar for market timing.
Location & tenants
- Location reads 64/100 on livability (#368 in IN) — a middle-class / working-renter tenant base. Strengths: cost of living A+, health & safety A+; Watch: crime C-, housing D+, amenities D-.
- Jennings County School Corporation (rural): math 32% / reading 38% proficiency, ranked #194 of 301 in IN (top 64%) — families likely to look elsewhere, expect single-tenant / working-renter base with shorter leases.
- Zoned schools: North Vernon Elementary School (math 30% / reading 34%, grade F, #652 of 994 statewide, top 68%, 608 students, 71% FRL); Jennings County Middle School (math 28% / reading 36%, grade F, #190 of 330 statewide, top 59%, 626 students, 62% FRL); Jennings County High School (math 26% / reading 62%, grade F, #189 of 369 statewide, top 51%, 1,184 students, 52% FRL).
- Market conditions: 4 active listings in the ZIP; 2 comparable units currently listed for rent nearby; 84 units permitted in Jennings County in 2024 (0 in 5+ unit buildings).
Forward outlook
- In year one you build about $11k of equity ($691 loan paydown + $10k appreciation (9.9% local appreciation)).
- Jennings County population projected at -21% by 2050 — secular population decline; favor cash flow + early exit over multi-decade hold.
- At projected returns (9.9% appreciation + 3.0% rent growth), your $28k cash investment doubles in ~2 years — after that, you're playing with house money.
- By year 4, paydown + projected appreciation supports a ~$37k cash-out refi (75% LTV) — recoverable capital for the next deal without selling this one.
Negotiation context
- It's been on market 423 days — a 12% lower offer ($88k) is reasonable based on typical stale-listing flexibility.
Risks & watch-outs
- Watch-outs: built in 1840 — expect roof / HVAC / electrical / plumbing capex.
Questions for the listing agent
- It's been on market 423 days. Have you received any prior offers? Is the seller open to a 12% concession, seller financing, or rate buy-down credit?
- Can we see the unit-by-unit rent roll, current vacancy, and any below-market leases? What's the average tenancy length?
- What capital expenditures (roof, boiler, parking lot, exteriors) have been made in the last 5 years, and what's planned in the next 2?
- Have any recent inspections been done? Can we get a copy of the seller's disclosures and any deferred-maintenance estimates?
- Built in 1840 — when were the roof, HVAC, electrical panel, plumbing, and water heater last replaced?
- Why hasn't it sold? Are there any deal-killer items the seller is aware of (foundation, flood, title, zoning, code violations)?
- Is there a deadline driving the sale (1031 exchange, divorce, estate, relocation)? That informs how much negotiation room exists.
- Schools are F-rated, which usually means shorter tenancies and higher turnover. Who's the typical renter profile here, and what's been the actual vacancy rate?
- What's the average days-on-market for RENTAL listings here right now (not sales)? A rising rental-DOM trend means longer vacancies and softer asking-rent achievability than the comps imply.
- What's the recent tenant-quality profile in this submarket — average credit score on applications, eviction rate, late-payment / NSF rate, and stable-employment percentage? A property-management company in the area should have these aggregated.
- How much new apartment / multifamily construction is in the pipeline within 1–3 miles? Heavy new supply (>2% of stock underway) typically softens rents 12–24 months out; light construction supports rent growth.
Investment metrics
- 1% rule
- 1.75% ✓
- Cap rate
- 14.61%
- Cash-on-cash
- 29.69%
- DSCR
- 2.32
- GRM
- 4.8
CMA / ARV
- ARV (median comp)
- $184,862
- List price
- $99,900
- Delta
- -45.96%
- Verdict
- UNDERPRICED
- Comps
- 2 within 2.0 mi
Projected returns pro-forma
9.87% appreciation · 3.0% rent growth · sell at horizon
- IRR
- 46.6%
- Equity multiple
- 4.49×
- Total profit
- $97,611
- Equity at exit
- $89,036
- IRR
- 40.6%
- Equity multiple
- 10.03×
- Total profit
- $252,595
- Equity at exit
- $190,993
Cash invested: $27,972 (down + closing). Projections, not guarantees.
Landlord ↔ Tenant lean methodology
- Overall (STATE)
- 90 Strongly Landlord-Friendly
- State Indiana
- 90 Strongly Landlord-Friendly · R+11
- County
- — inherits STATE
- City
- — inherits STATE
ZIP-level market 47282
- Home prices YoY
- 4.0%
- Active inventory
- 4
- Price-to-rent
- 9.5×
Monthly cashflow live
- Estimated rent
- $1,750 medium interval (Pro) →
- Mortgage (P&I)
- −$524
- Tax est. 1.5%
- −$125 /mo · $1,498/yr
- Insurance
- −$42
- HOA
- −$0
- Vacancy / Maint / Mgmt
- −$368
- Net cashflow
- $692
Break-even live
Sensitivity live
| Price | -10% $761 | -5% $727 | +0% $692 | +5% $658 | +10% $623 |
|---|---|---|---|---|---|
| Rent | -10% $554 | -5% $623 | +0% $692 | +5% $761 | +10% $830 |
| Rate | -1.0pp $742 | -0.5pp $718 | base $692 | +0.5pp $666 | +1.0pp $640 |
2-unit breakdown (identical units grouped — click to expand)
| Units | Beds | Baths | Est. rent |
|---|---|---|---|
| 2× units | 2 | 1 | $1,750 |
| #1 | 2 | 1 | $875 |
| #2 | 2 | 1 | $875 |
| Total (2 units) | $1,750 | ||
UW: 25.0% down · 7.5% · 30yr · 1.5% tax · 5.0% vac · 8.0% maint · 8.0% mgmt
Financing live
Cash to close
- Down payment
- $24,975
- Closing costs
- $2,997
- Reserves months
- —
- Total cash needed
- —
Loan-product check · same deal, 3 products live
Conventional
25% down · 7.5% · 30yr
- Down + closing
- —
- Monthly P&I
- —
- Monthly cashflow
- —
- DSCR
- —
- Eligible?
- —
Personal DTI + credit; lowest rate.
DSCR
20% down · 8.5% · 30yr
- Down + closing
- —
- Monthly P&I
- —
- Monthly cashflow
- —
- DSCR
- —
- Eligible?
- —
No personal income docs; deal must DSCR.
Hard money
10% down · 12.0% · 12mo
- Down + closing
- —
- Monthly P&I
- —
- Monthly cashflow
- —
- DSCR
- —
- Eligible?
- —
Short-term bridge; refi at stabilization.
Rent comps 2 comps
| Address | Beds | Baths | Sqft | Rent | $/sqft | DOM | Units | Dist |
|---|---|---|---|---|---|---|---|---|
| 105 Greensburg St Unit 2 North Vernon, IN | 1.0 | 1.0 | 638 | $875 | $1.37 | 46d | 1 | 1.10mi |
| 450 N Greensburg St North Vernon, IN | 2.0 | 1.0 | 720 | $875 | $1.22 | 46d | 1 | 1.22mi |
Listing history 17 events
-
2026-06-22days on market $99,900 Active 423 DOM
-
2026-06-19days on market $99,900 Active 420 DOM
-
2026-06-18days on market $99,900 Active 419 DOM
-
2026-06-17days on market $99,900 Active 418 DOM
-
2026-06-16days on market $99,900 Active 417 DOM
-
2026-06-15days on market $99,900 Active 416 DOM
-
2026-06-14days on market $99,900 Active 414 DOM
-
2026-06-12days on market $99,900 Active 413 DOM
-
2026-06-09days on market $99,900 Active 410 DOM
-
2026-06-08days on market $99,900 Active 409 DOM
-
2026-06-07days on market $99,900 Active 408 DOM
-
2026-06-02days on market $99,900 Active 403 DOM
-
2026-06-01days on market $99,900 Active 402 DOM
-
2026-05-31days on market $99,900 Active 401 DOM
-
2026-05-30days on market $99,900 Active 400 DOM
-
2025-09-18price $99,900 205-char remark
Show marketing remark (205 chars)
Own a piece of history with this circa 1830's building. This 3,630 sq. ft. building is currently a duplex. Each unit has been torn down to the studs and made structurally sound. All new windows throughout.
-
2025-04-25$109,900 Active 205-char remark
Show marketing remark (205 chars)
Own a piece of history with this circa 1830's building. This 3,630 sq. ft. building is currently a duplex. Each unit has been torn down to the studs and made structurally sound. All new windows throughout.
ⓘ Source: listings_history table (triggers on properties + properties_extension) + one-shot
backfill from property_details.listing_events for pre-trigger history.
Climate risk First Street
- Flood 1/10 Low FEMA zone X (unshaded) · 0% chance over 30 yrs
- Wildfire 1/10 Low
- Heat 4/10 Moderate 7 d/yr ≥105°F today · 20 d/yr by 30 yrs out
- Wind 2/10 Low 100% chance of damaging wind over 30 yrs
- Air quality 2/10 Low 0 unhealthy d/yr today · 1 by 30 yrs out
Nearby sold comps map
Loading sold comps map…
Walkable amenities ~0.75 mi
Loading nearby amenities…
Taxation est. · year 1
- Rental income
- $21,000
- − Mortgage interest
- −$5,596
- − Property taxes
- −$1,498
- − Insurance
- −$500
- − Repairs & maintenance
- −$1,680
- − Management
- −$1,680
- − Depreciation
- −$2,906
- Taxable income
- $7,140
- Est. tax owed @ 24.0%
- −$1,714
- After-tax cash flow
- $6,592/yr
For passive investors: Depreciation is non-cash, so a rental often shows a tax loss while cash-flowing — sheltering income. Rental losses are passive: they offset passive income freely, and up to $25,000/yr can offset ordinary (W-2) income if you actively participate and your MAGI is under $100k (phasing out to $0 by $150k); unused losses carry forward. On sale, claimed depreciation is recaptured at up to 25%, and gains may owe capital-gains tax (a 1031 exchange can defer both). Figures are a year-1 estimate at your 24.0% rate — not tax advice; consult a CPA.
Condition & rehab AI · 5 photos
This historic building requires extensive repairs and maintenance to restore its structural integrity and curb appeal, significantly increasing its resale and rental value.
Repairs flagged
- Major siding — Severe weathering and peeling
- Major paint — Significant peeling and discoloration
- Major roof — Aged appearance, potential leaks
Value-add opportunities
- Both New siding and paint — Enhances curb appeal and structural integrity
- Both New roof — Prevents water damage and extends the building's lifespan
Renovation cost estimate screening
| Repair item | Severity | Est. cost |
|---|---|---|
| siding · Severe weathering and peeling | Major | $15,000–50,000 |
| paint · Significant peeling and discoloration | Major | $15,000–50,000 |
| roof · Aged appearance, potential leaks | Major | $15,000–50,000 |
| Total estimated repair cost · 3 items | $45,000–150,000 |
Value-add ROI direction
- Both New siding and paint — Enhances curb appeal and structural integrity ↑
- Both New roof — Prevents water damage and extends the building's lifespan ↑
ⓘ Cost ranges are severity-bucket heuristics (US national rule-of-thumb). Get contractor quotes + a written scope before underwriting a rehab budget.
Schools (NCES district)
- District
- Jennings County School Corporation
- NCES district ID
- 1805190
- Math proficiency
- 32% ▼ -11.00%
- Reading proficiency
- 38% ▼ -6.00%
- Median HH income
- $45,418
- Composite
- 29.89/100
- National rank
- #6394
- State rank
- #194 of 301 in IN
Livability — Vernon
- Score
- 64/100
- State rank
- #368
- US rank
- #13808
Category grades
Schools grade is shown separately in the Schools card above.
Census & demographics
- Census place
- Vernon, IN
- City population
- 224
- Population (ZIP)
- 224
Population outlook (Jennings County) Hauer SSP2
- Today (2025)
- 26,584 people
- By 2030
- 25,591 · -3.7%
- By 2040
- 23,423 · -11.9%
- By 2050
- 20,973 · -21.1%
- By 2075
- 15,445 · -41.9%
- By 2100
- 10,714 · -59.7%
Race, ethnicity, and origin ACS 2023
- Neighborhood character
- Predominantly White (93%)
- Race & ethnicity
- White 93% Hispanic / Latino 6% Two or more races 1%
- Hispanic origin (detail)
- Common ancestry
- Slovak 7% Iranian 4% Serbian 1%
- Foreign-born
- 6% · Canada
- Languages at home
- 94% English-only · Spanish 6%
Political lean MEDSL · Jennings
- 2024 margin
- Solid R (+58.8) · D 19.7% · R 78.5% · Other 1.8%
- 2008→2024 swing
- -50.8pp toward R · 2008: -8.0pp · 2024: -58.8pp
- All cycles
- 2024: R+58.8 2020: R+56.9 2016: R+52.7 2012: R+22.4 2008: R+8.0
Not yet ingested
- Civics
- —
Market trends
- HPI YoY
- ▲ 9.87%
- Current HPI
- 256.8626
- Rent YoY
- —
- Metro
- —
- State GDP YoY
- ▲ 2.90%
- F500 in state
- 18
Industry mix (Fortune 500 HQ in IN)
| Industry | F500 HQs | Revenue |
|---|---|---|
| Industrial Machinery | 2 | $37B |
|
||
| Healthcare | 1 | $177B |
|
||
| Pharmaceuticals | 1 | $45B |
|
||
| Metals / Steel | 1 | $18B |
|
||
| Agriculture | 1 | $17B |
|
||
| Packaging | 1 | $12B |
|
||
Price history
-9.1% since first listed2 events — show timeline
- 2025-09-18 Price Changed $99,900 MIBOR as Distributed by MLS Grid
- 2025-04-25 Listed $109,900 MIBOR as Distributed by MLS Grid
Cash-flow waterfall
monthlySold comps — $/sqft
last 12 mo · ≤1 miLoading sold comps…