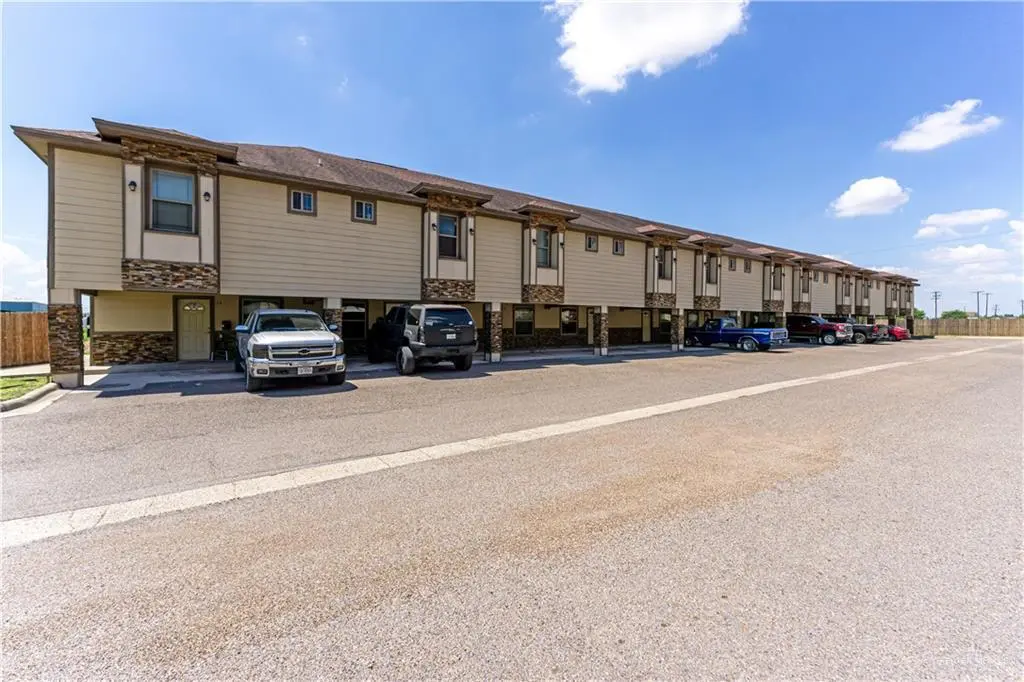
1500 Hummingbird Ct #16 · Pharr, TX
Flood risk 1/10 · Minimal
- FEMA flood zone
- X (shaded)
- Chance of flooding over 30 yrs
- 0.0%
- Est. flood insurance / yr
- $507 – $1,088
Fire risk 1/10 · Minimal
- Est. fire insurance / yr
- $1,222 – $2,270
Heat risk 9/10 · Severe
- Hot days now (above 111°F)
- 7 days/yr
- Hot days in 30 yrs
- 22 days/yr
Wind risk 8/10 · Major
- Chance of severe wind over 30 yrs
- 99.0%
Air-quality risk 3/10 · Minor
- Unhealthy air days now
- 1 days/yr
- Unhealthy air days in 30 yrs
- 4 days/yr
Risk factors via First Street. Map © Google.
Why this score? — see what drove the D- grade
The composite is a weighted blend of 9 inputs, each scored 0–100. Each bar is that input's sub-score; the figure is the points it added to the 100-point composite (weight × sub-score).
- Cash flow +11.9/30.0
- ARV discount +8.9/15.0
- Livability +3.6/5.0
- DSCR +3.5/10.0
- 1% rule +3.4/10.0
- Rent growth +2.4/5.0
- Condition / age +2.2/5.0
- Schools +2.0/10.0
- Appreciation +0.0/10.0
$145,000
🖨 Deal sheet 📄 Offer letter ✓ Due diligence
Listing remarks MLS
Lovely two story town-home in Pharr! OWNER FINANCE AVAILABLE! 10% down ,10% interest, 10 year balloon. Option for Remodel! Come check out these condos today! Well designed layout that maximizes every square foot; This 2 bedroom 2.5 bath town-home, open concept and spacious bedrooms! Great location near Hwy 281 and Expressway 83. Don't miss out on this opportunity.
Key facts
- Garage
- Built 2013
- Listed 295 days
Neighborhood map
What this means for you Summary
Snapshot
- This is a 2-bed/2.5-bath townhouse listed at $145k. Condition is rated fair.
Deal economics
- At list price, monthly cash flow is $-36 ($-432/yr) — negative.
- To cash-flow at today's rent, offer at most $140k (3.6% below list).
- To meet the 1% rule (rent ≥ 1% of price), the offer needs to be $122k (15.7% below list).
- Recommended offer: $122k (15.7% below list) — sets the bar for 1% rule.
- Cap rate 6.0% vs local median 3.4% in Pharr — top-decile yield for the area; either an underpriced asset or a hidden risk that comps aren't pricing in. Stress-test before assuming the spread holds.
Location & tenants
- Location reads 72/100 on livability (#245 in TX) — a middle-class / working-renter tenant base. Strengths: cost of living A+, housing A+, health & safety A+; Watch: schools D, amenities F, commute F.
- Pharr-San Juan-Alamo ISD (suburban): math 18% / reading 30% proficiency, ranked #740 of 826 in TX (top 90%) — low school quality limits family demand, transient renter base, plan for 1-2y turnover; 72% free/reduced lunch — lower-income household profile, screen leases tightly.
- Market conditions: Rents soft (-0.2%/yr); 451 active listings in the ZIP; 40 comparable units currently listed for rent nearby; rentals lingering (median 44d on market — plan ~5-8 weeks vacancy on turnover, expect pricing pressure); 65% of comp listings sitting > 30 days — soft ceiling on asking rent; 7,378 units permitted in Hidalgo County in 2024 (641 in 5+ unit buildings).
Forward outlook
- Local home prices are declining (-3.0%/yr); year-one equity from $1k of loan paydown is wiped out by about $4k of value loss. Plan a longer hold.
- Hidalgo County population projected at +28% by 2050 — long-run rental-demand tailwind backs the buy-and-hold thesis.
Negotiation context
- It's been on market 295 days — a 12% lower offer ($128k) is reasonable based on typical stale-listing flexibility.
- 2 sale attempts since 2y ago with the ask held roughly flat each time — persistent listings suggest the price (not the market) is what's stuck; bring a comps-based counter.
Risks & watch-outs
- Climate carrying-cost: severe wind risk, 99% chance of damaging wind over 30y; extreme-heat days projected 7→22/yr by 2055 (HVAC capex compounding) — expect insurance premiums to compound above CPI over the hold.
Questions for the listing agent
- What do current leases actually rent for vs. the listed asking? Can we see a recent rent roll and the last 12 months of T-12 income?
- It's been on market 295 days. Have you received any prior offers? Is the seller open to a 16% concession, seller financing, or rate buy-down credit?
- Have any recent inspections been done? Can we get a copy of the seller's disclosures and any deferred-maintenance estimates?
- Why hasn't it sold? Are there any deal-killer items the seller is aware of (foundation, flood, title, zoning, code violations)?
- Is there a deadline driving the sale (1031 exchange, divorce, estate, relocation)? That informs how much negotiation room exists.
- Schools are D-rated, which usually means shorter tenancies and higher turnover. Who's the typical renter profile here, and what's been the actual vacancy rate?
- The area grade is low — what's the realistic commute time and amenity access for the typical tenant pool here? Any planned neighborhood developments (good or bad) we should know about?
- What's the average days-on-market for RENTAL listings here right now (not sales)? A rising rental-DOM trend means longer vacancies and softer asking-rent achievability than the comps imply.
- What's the recent tenant-quality profile in this submarket — average credit score on applications, eviction rate, late-payment / NSF rate, and stable-employment percentage? A property-management company in the area should have these aggregated.
- How much new for-sale + rental construction is in the pipeline within 1–3 miles? Heavy new supply typically softens prices + rents 12–24 months out; constrained supply supports both.
Investment metrics
- 1% rule
- 0.84% ✗
- Cap rate
- 5.99%
- Cash-on-cash
- -1.06%
- DSCR
- 0.95
- GRM
- 9.9
CMA / ARV
- ARV (median comp)
- $149,699
- List price
- $145,000
- Delta
- -3.14%
- Verdict
- FAIR
- Comps
- 20 within 1.0 mi
Show comp detail 12 sales within ~0.75 mi
| Address | Dist | Beds/Ba | Sqft | Sold | Price | $/sf | Match |
|---|---|---|---|---|---|---|---|
| 1321 E Camellia Ave #3 | 0.40mi | 2/2.5 | 1,169 (-8%) | 5mo | $154,900 | $133 | 63 |
| 1305 E Daffodil Ave Unit A | 0.48mi | 2/2.5 | 1,360 (+6%) | 5mo | $195,000 | $143 | 63 |
| 1304 E Camellia Ave #2 | 0.47mi | 2/2.5 | 1,200 (-6%) | 11mo | $159,000 | $133 | 59 |
| 1208 E Camellia Ave #2 | 0.55mi | 2/2.5 | 1,181 (-8%) | 5mo | $165,000 | $140 | 57 |
| 1213 E Daffodil Ave Unit A | 0.55mi | 2/2.5 | 1,360 (+6%) | 8mo | $175,000 | $129 | 57 |
| 1300 E Daffodil Ave Unit A | 0.49mi | 2/2.5 | 1,182 (-8%) | 15mo | $169,000 | $143 | 52 |
| 1205 E Camellia Ave #4 | 0.56mi | 2/2.5 | 1,170 (-8%) | 10mo | $179,950 | $154 | 52 |
| 1300 E Daffodil Ave Unit C | 0.49mi | 2/2.5 | 1,182 (-8%) | 17mo | $165,000 | $140 | 51 |
| 1205 E Camellia Ave #3 | 0.56mi | 2/2.5 | 1,172 (-8%) | 22mo | $179,950 | $154 | 42 |
| 1205 E Camelia St | 0.57mi | 2/3.0 | 1,172 (-8%) | 20mo | $175,950 | $150 | 41 |
| 1309 E Daffodil Ave Unit B | 0.46mi | 3/2.5 (+1) | 1,440 (+13%) | 19mo | $175,000 | $122 | 36 |
| 1210 E Daffodil Ave #2 | 0.51mi | 3/2.5 (+1) | 1,407 (+10%) | 23mo | $197,500 | $140 | 35 |
Match score weights: distance 35% · size 25% · config 20% · recency 20%. Top-matched comps best support the ARV.
Projected returns pro-forma
-3.0% appreciation · 0.0% rent growth · sell at horizon
- IRR
- -21.5%
- Equity multiple
- 0.28×
- Total profit
- $-29,356
- Equity at exit
- $21,620
- IRR
- -24.4%
- Equity multiple
- -0.04×
- Total profit
- $-42,292
- Equity at exit
- $12,537
Cash invested: $40,600 (down + closing). Projections, not guarantees.
Landlord ↔ Tenant lean methodology
- Overall (STATE)
- 87 Strongly Landlord-Friendly
- State Texas
- 87 Strongly Landlord-Friendly · R+5
- County
- — inherits STATE
- City
- — inherits STATE
ZIP-level market 78577
- Home prices YoY
- -8.1%
- Rents YoY
- -0.2%
- Active inventory
- 451
- Price-to-rent
- 9.9×
Monthly cashflow live
- Estimated rent
- $1,223 high interval (Pro) →
- Mortgage (P&I)
- −$760
- Tax est. 1.5%
- −$181 /mo · $2,175/yr
- Insurance
- −$60
- HOA
- −$0
- Vacancy / Maint / Mgmt
- −$257
- Net cashflow
- $-36
Break-even live
UW: 25.0% down · 7.5% · 30yr · 1.5% tax · 5.0% vac · 8.0% maint · 8.0% mgmt
Financing live
Cash to close
- Down payment
- $36,250
- Closing costs
- $4,350
- Reserves months
- —
- Total cash needed
- —
Loan-product check · same deal, 3 products live
Conventional
25% down · 7.5% · 30yr
- Down + closing
- —
- Monthly P&I
- —
- Monthly cashflow
- —
- DSCR
- —
- Eligible?
- —
Personal DTI + credit; lowest rate.
DSCR
20% down · 8.5% · 30yr
- Down + closing
- —
- Monthly P&I
- —
- Monthly cashflow
- —
- DSCR
- —
- Eligible?
- —
No personal income docs; deal must DSCR.
Hard money
10% down · 12.0% · 12mo
- Down + closing
- —
- Monthly P&I
- —
- Monthly cashflow
- —
- DSCR
- —
- Eligible?
- —
Short-term bridge; refi at stabilization.
Rent comps 40 comps
| Address | Beds | Baths | Sqft | Rent | $/sqft | DOM | Units | Dist |
|---|---|---|---|---|---|---|---|---|
| 1500 W Heritage Dr #2 Pharr, TX | 3.0 | 2.0 | 1140 | $1,200 | $1.05 | 43d | 1 | 0.11mi |
| 1300 Humming Bird Ct Unit 9 Pharr, TX | 2.0 | 2.5 | 1114 | $1,250 | $1.12 | 43d | 1 | 0.13mi |
| 1300 Humming Bird Ct Unit 10 Pharr, TX | 2.0 | 2.5 | 1114 | $1,250 | $1.12 | 43d | 1 | 0.13mi |
| 1321 E Camelia AVE #4 McAllen, TX | 2.0 | 2.5 | 1283 | $1,700 | $1.33 | 43d | 1 | 0.37mi |
| 1320 E Camellia Ave Unit C McAllen, TX | 2.0 | 2.5 | 1360 | $1,300 | $0.96 | 43d | 1 | 0.38mi |
| 1320 E Camellia Ave Unit A McAllen, TX | 2.0 | 2.5 | 1185 | $1,600 | $1.35 | 43d | 1 | 0.38mi |
| 1701 W Sioux Rd Unit 12305 Pharr, TX | 2.0 | 2.0 | 990 | $1,250 | $1.26 | 43d | 1 | 0.38mi |
| 1701 W Sioux Rd Unit 4204 Pharr, TX | 3.0 | 2.0 | 1187 | $1,499 | $1.26 | 23d | 1 | 0.38mi |
| 1701 W Sioux Rd Unit 5305 Pharr, TX | 2.0 | 2.0 | 990 | $1,250 | $1.26 | 23d | 1 | 0.38mi |
| 1701 W Sioux Rd Unit 4202 Pharr, TX | 3.0 | 2.0 | 1187 | $1,499 | $1.26 | 43d | 1 | 0.38mi |
| 1321 E Daffodil Ave Unit D McAllen, TX | 2.0 | 2.5 | 1187 | $1,100 | $0.93 | 43d | 1 | 0.39mi |
| 1316 E Camellia Ave Unit 1 McAllen, TX | 2.0 | 2.5 | 1185 | $1,100 | $0.93 | 23d | 1 | 0.39mi |
| 1001 Sugar Garden Dr Unit 1 Pharr, TX | 3.0 | 2.0 | 1000 | $1,250 | $1.25 | 43d | 1 | 0.40mi |
| 1006 Sugar Garden Dr Unit 4 Pharr, TX | 3.0 | 2.0 | 1000 | $1,250 | $1.25 | 21d | 1 | 0.40mi |
| 1004 Sugar Garden Dr Unit 2 Pharr, TX | 3.0 | 2.0 | 1000 | $1,250 | $1.25 | 43d | 1 | 0.41mi |
| 1312 E Daffodil Ave Unit B McAllen, TX | 2.0 | 2.5 | 1185 | $1,100 | $0.93 | 43d | 1 | 0.41mi |
| 1105 Sugar Garden Ave Pharr, TX | 3.0 | 2.0 | 1050 | $1,250 | $1.19 | 19d | 1 | 0.41mi |
| 1309 E Camellia Ave McAllen, TX | 2.0 | 2.5 | 1200 | $1,100 | $0.92 | 43d | 1 | 0.42mi |
| 1706 W Bronze St Pharr, TX | 3.0 | 2.0 | 1200 | $875 | $0.73 | 44d | 1 | 0.42mi |
| 1308 E Daffodil Ave Unit c McAllen, TX | 2.0 | 2.5 | 1300 | $1,200 | $0.92 | 43d | 1 | 0.43mi |
| 1301 E Camellia Ave Unit D Pharr, TX | 2.0 | 2.5 | 1300 | $1,250 | $0.96 | 43d | 1 | 0.46mi |
| 4008 Parkplace Ave Unit 4 Pharr, TX | 3.0 | 2.0 | 1078 | $995 | $0.92 | 43d | 1 | 0.47mi |
| 4008 Parkplace Ave Unit 1 Pharr, TX | 3.0 | 2.0 | 1078 | $1,800 | $1.67 | 43d | 1 | 0.47mi |
| 3402 Robin Pharr, TX | 3.0 | 2.0 | 1428 | $1,800 | $1.26 | 14d | 1 | 0.48mi |
| 813 W Bronze Dr Unit 8134 Pharr, TX | 2.0 | 2.0 | 891 | $875 | $0.98 | 23d | 1 | 0.48mi |
| 1221 E Daffodil Ave Unit C McAllen, TX | 2.0 | 2.5 | 1148 | $1,000 | $0.87 | 23d | 1 | 0.48mi |
| 1424 E Hibiscus Ave Unit 1 McAllen, TX | 2.0 | 2.0 | 978 | $1,200 | $1.23 | 23d | 1 | 0.49mi |
| 906 Sugar Garden Ave Pharr, TX | 3.0 | 2.0 | 1106 | $1,195 | $1.08 | 43d | 1 | 0.50mi |
| 1902 W Violet Dr #4 Pharr, TX | 3.0 | 2.0 | 950 | $1,350 | $1.42 | 23d | 1 | 0.50mi |
| 705 W Emerald Dr Unit B Pharr, TX | 2.0 | 2.0 | 1000 | $895 | $0.90 | 43d | 1 | 0.51mi |
| 801 W Bronze Dr Pharr, TX | 2.0 | 2.0 | 910 | $825 | $0.91 | 19d | 1 | 0.51mi |
| 901 Sugar Garden Dr Unit 4 Pharr, TX | 3.0 | 2.0 | 1100 | $1,200 | $1.09 | 43d | 1 | 0.52mi |
| 1907 W Violet Dr Unit 2 Pharr, TX | 2.0 | 2.0 | 940 | $1,350 | $1.44 | 43d | 1 | 0.52mi |
| 1907 W Violet Dr Unit 3 Pharr, TX | 2.0 | 2.0 | 1140 | $1,350 | $1.18 | 23d | 1 | 0.52mi |
| 902 Sugar Garden Dr Unit 4 Pharr, TX | 3.0 | 2.0 | 1106 | $1,195 | $1.08 | 43d | 1 | 0.53mi |
| 1408 E Hibiscus Ave Unit 2 McAllen, TX | 3.0 | 2.0 | 1100 | $1,350 | $1.23 | 14d | 1 | 0.53mi |
| 1204 E Daffodil McAllen, TX | 2.0 | 2.5 | 1170 | $1,200 | $1.03 | 43d | 1 | 0.53mi |
| 801 Sugar Garden Dr Unit 3 Pharr, TX | 3.0 | 2.0 | 1040 | $1,250 | $1.20 | 14d | 1 | 0.54mi |
| 900 Sugar Garden Ave Pharr, TX | 3.0 | 2.0 | 1106 | $1,195 | $1.08 | 43d | 1 | 0.54mi |
| 1205 E Daffodil Ave Unit B McAllen, TX | 2.0 | 2.5 | 1250 | $1,050 | $0.84 | 43d | 1 | 0.54mi |
Listing history 18 events
-
2026-06-18days on market $145,000 Active 295 DOM
-
2026-06-17days on market $145,000 Active 294 DOM
-
2026-06-16days on market $145,000 Active 293 DOM
-
2026-06-15days on market $145,000 Active 292 DOM
-
2026-06-14days on market $145,000 Active 290 DOM
-
2026-06-13days on market $145,000 Active 289 DOM
-
2026-06-10days on market $145,000 Active 287 DOM
-
2026-06-09days on market $145,000 Active 286 DOM
-
2026-06-08days on market $145,000 Active 285 DOM
-
2026-06-07days on market $145,000 Active 284 DOM
-
2026-06-03days on market $145,000 Active 280 DOM
-
2026-06-02days on market $145,000 Active 279 DOM
-
2026-06-01days on market $145,000 Active 278 DOM
-
2026-05-31days on market $145,000 Active 277 DOM
-
2026-05-31days on market $145,000 Active 276 DOM
-
2025-08-27$145,000 Active 370-char remark
Show marketing remark (370 chars)
Lovely two story town-home in Pharr! OWNER FINANCE AVAILABLE! 10% down ,10% interest, 10 year balloon. Option for Remodel! Come check out these condos today! Well designed layout that maximizes every square foot; This 2 bedroom 2.5 bath town-home, open concept and spacious bedrooms! Great location near Hwy 281 and Expressway 83. Don't miss out on this opportunity.
-
2024-11-11historical $950
-
2024-09-26$950
ⓘ Source: listings_history table (triggers on properties + properties_extension) + one-shot
backfill from property_details.listing_events for pre-trigger history.
Climate risk First Street
- Flood 1/10 Low FEMA zone X (shaded) · 0% chance over 30 yrs
- Wildfire 1/10 Low
- Heat 9/10 Extreme 7 d/yr ≥111°F today · 22 d/yr by 30 yrs out
- Wind 8/10 Severe 99% chance of damaging wind over 30 yrs
- Air quality 3/10 Moderate 1 unhealthy d/yr today · 4 by 30 yrs out
Nearby sold comps map
Loading sold comps map…
Walkable amenities ~0.75 mi
Loading nearby amenities…
Taxation est. · year 1
- Rental income
- $14,674
- − Mortgage interest
- −$8,122
- − Property taxes
- −$2,175
- − Insurance
- −$725
- − Repairs & maintenance
- −$1,174
- − Management
- −$1,174
- − Depreciation
- −$4,218
- Taxable loss
- −$2,914
- Est. tax savings @ 24.0%
- +$699
- After-tax cash flow
- $267/yr
For passive investors: Depreciation is non-cash, so a rental often shows a tax loss while cash-flowing — sheltering income. Rental losses are passive: they offset passive income freely, and up to $25,000/yr can offset ordinary (W-2) income if you actively participate and your MAGI is under $100k (phasing out to $0 by $150k); unused losses carry forward. On sale, claimed depreciation is recaptured at up to 25%, and gains may owe capital-gains tax (a 1031 exchange can defer both). Figures are a year-1 estimate at your 24.0% rate — not tax advice; consult a CPA.
Condition & rehab AI · 12 photos
This two-story townhome requires moderate repairs and updates to its kitchen and bathrooms, as well as exterior siding. These improvements would significantly increase its resale and rental value.
Repairs flagged
- Moderate kitchen cabinets — dated and worn
- Moderate bathroom cabinets — dated and worn
- Moderate exterior siding — moderate wear
Value-add opportunities
- Both update kitchen cabinets — modernizing the kitchen would appeal to buyers and renters
- Both update bathroom cabinets — modernizing the bathrooms would appeal to buyers and renters
- Both repair exterior siding — repairing the siding would improve the home's curb appeal and value
Renovation cost estimate screening
| Repair item | Severity | Est. cost |
|---|---|---|
| kitchen cabinets · dated and worn | Moderate | $3,000–15,000 |
| bathroom cabinets · dated and worn | Moderate | $3,000–15,000 |
| exterior siding · moderate wear | Moderate | $3,000–15,000 |
| Total estimated repair cost · 3 items | $9,000–45,000 |
Value-add ROI direction
- Both update kitchen cabinets — modernizing the kitchen would appeal to buyers and renters ↑
- Both update bathroom cabinets — modernizing the bathrooms would appeal to buyers and renters ↑
- Both repair exterior siding — repairing the siding would improve the home's curb appeal and value ↑
ⓘ Cost ranges are severity-bucket heuristics (US national rule-of-thumb). Get contractor quotes + a written scope before underwriting a rehab budget.
Schools (NCES district)
- District
- Pharr-San Juan-Alamo ISD
- NCES district ID
- 4834860
- Math proficiency
- 18% ▼ -34.00%
- Reading proficiency
- 30% ▼ -11.00%
- Median HH income
- $33,757
- Composite
- 19.63/100
- National rank
- #8744
- State rank
- #740 of 826 in TX
Livability — Pharr
- Score
- 72/100
- State rank
- #245
- US rank
- #5852
Category grades
Schools grade is shown separately in the Schools card above.
Census & demographics
- Census place
- Pharr, TX
- County
- Hidalgo County · 623,128 people
- City population
- 80,540
- Metro
- McAllen-Edinburg-Mission, TX
- Population (ZIP)
- 80,540
- Household income
- $52,770
- Rent vs Own
- Severe rent burden
- 2161.0
Population outlook (Hidalgo County) Hauer SSP2
- Today (2025)
- 955,232 people
- By 2030
- 1,009,774 · +5.7%
- By 2040
- 1,120,332 · +17.3%
- By 2050
- 1,225,036 · +28.2%
- By 2075
- 1,439,189 · +50.7%
- By 2100
- 1,533,429 · +60.5%
Race, ethnicity, and origin ACS 2023
- Neighborhood character
- Predominantly Hispanic (95%)
- Race & ethnicity
- Hispanic / Latino 95% Two or more races 45% White 5%
- Hispanic origin (detail)
- Mexican 92%
- Foreign-born
- 29% · Canada
- Languages at home
- 18% English-only · Spanish 81%
Political lean MEDSL · Hidalgo
- 2024 margin
- Toss-up / Even · D 48.1% · R 51.0%
- 2008→2024 swing
- -41.6pp toward R · 2008: 38.7pp · 2024: -2.9pp
- All cycles
- 2024: R+2.9 2020: D+17.1 2016: D+40.5 2012: D+41.8 2008: D+38.7
Not yet ingested
- Civics
- —
Market trends
- HPI YoY
- ▼ -23.00%
- Current HPI
- 261.1606
- Rent YoY
- ▼ -0.24%
- Metro
- McAllen-Edinburg-Mission, TX
- State GDP YoY
- ▲ 3.95%
- F500 in state
- 110
Industry mix (Fortune 500 HQ in TX)
| Industry | F500 HQs | Revenue |
|---|---|---|
| Energy | 16 | $1,198B |
|
||
| Technology | 5 | $198B |
|
||
| Engineering / Construction | 4 | $72B |
|
||
| Energy Services | 3 | $60B |
|
||
| Utilities | 3 | $41B |
|
||
| Healthcare | 2 | $330B |
|
||
Price history
3 events — show timeline
- 2025-08-27 Listed $145,000 MCALLENMLS
- 2024-11-11 Rental Removed $950 MCALLENMLS
- 2024-09-26 Listed for Rent $950 MCALLENMLS
Cash-flow waterfall
monthlySold comps — $/sqft
last 12 mo · ≤1 miLoading sold comps…