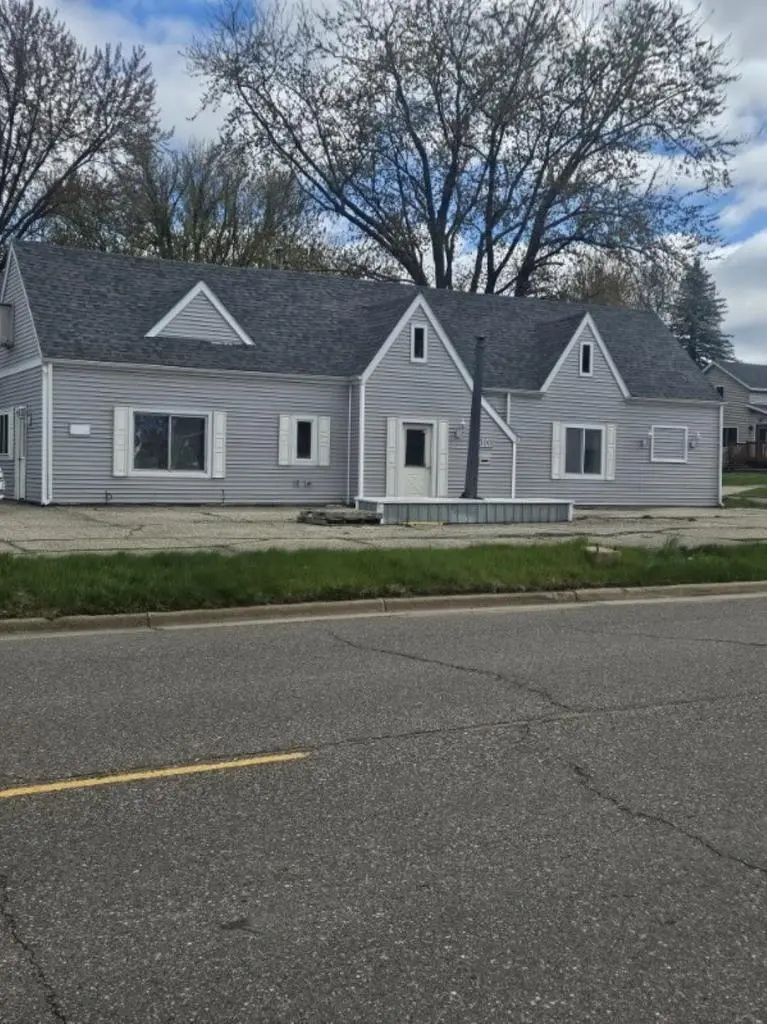
300 W Stanley St · Thorp, WI
Flood risk No data
- FEMA flood zone
- —
- Chance of flooding over 30 yrs
- —
- Est. flood insurance / yr
- —
Fire risk No data
- Est. fire insurance / yr
- —
Heat risk No data
- Hot days now (above threshold)
- —
- Hot days in 30 yrs
- —
Wind risk No data
- Chance of severe wind over 30 yrs
- —
Air-quality risk No data
- Unhealthy air days now
- —
- Unhealthy air days in 30 yrs
- —
Risk factors via First Street. Map © Google.
Why this score? — see what drove the C- grade
The composite is a weighted blend of 9 inputs, each scored 0–100. Each bar is that input's sub-score; the figure is the points it added to the 100-point composite (weight × sub-score).
- Cash flow +21.7/30.0
- ARV discount +7.5/15.0
- DSCR +6.9/10.0
- 1% rule +5.7/10.0
- Livability +3.4/5.0
- Schools +3.3/10.0
- Rent growth +2.5/5.0
- Condition / age +2.2/5.0
- Appreciation +0.0/10.0
$85,000
🖨 Deal sheet (PDF) 📄 Offer letter ✓ Due diligence
Listing remarks
Investor opportunity in Thorp! This 2 bed, 2 bath home offers 1,878 sq ft of living space on a 7,405 sq ft lot and is ideal for a light cosmetic rehab. Property features vinyl siding, spacious layout, and strong value-add potential for investors or handy buyers. Home would benefit from interior updates including paint, flooring, and cosmetic modernization. Great opportunity for a flip, rental, or owner-occupant renovation project. Sold as-is.
Key facts
- 7,405 sq ft lot
- 3 garage spots
- Listed 34 days
Property features AI
Exterior
- Parking: Detached 3-car garage
- Utilities: Municipal water; Municipal sewer
- Home design: Two-story single-family home
- Construction: Composition/fiberglass roof; Approximately 1,589 finished above-grade square feet; About 289 finished below-grade square feet; Approximately 750 below-grade unfinished square feet
- Exterior features: Vinyl exterior; Lot size about 0.17 acres; Less than 1/2 acre
Interior
- Kitchen: Kitchen on main level, approximately 10 x 15
- Bedrooms: Master bedroom (upper level), approximately 15 x 9; Second bedroom (main level), approximately 10 x 10
- Bathrooms: One full bathroom
- Heating & cooling: Forced air heating; No central cooling; Natural gas heat
- Interior features: Partial, partially finished basement; Living room on main level
Neighborhood map
What this means for you Summary
Snapshot
- This is a 2-bed/1.0-bath single-family listed at $85k. Condition is rated fair.
Deal economics
- At list price, monthly cash flow is $131 ($2k/yr) — positive.
- The deal already cash-flows at list — no discount required.
- Meets the 1% rule at list price ($910 rent vs $85k).
- Recommended offer: $82k (3.0% below list) — sets the bar for market timing.
Location & tenants
- Location reads 68/100 on livability (#382 in WI) — a middle-class / working-renter tenant base. Strengths: crime A+, cost of living A+, housing A+; Watch: health & safety D, amenities F, commute F.
- Thorp School District (rural): math 42% / reading 37% proficiency, ranked #174 of 342 in WI (top 51%) — families likely to look elsewhere, expect single-tenant / working-renter base with shorter leases.
- Zoned schools: Thorp Elementary (math 48% / reading 40%, grade F, #421 of 1,041 statewide, top 41%, 362 students, 52% FRL); Thorp High (math 15% / reading 15%, grade F, #414 of 483 statewide, top 87%, 165 students, 47% FRL).
- Market conditions: 24 active listings in the ZIP; 76 units permitted in Clark County in 2024 (0 in 5+ unit buildings).
Forward outlook
- Local home prices are declining (-3.0%/yr); year-one equity from $588 of loan paydown is wiped out by about $3k of value loss. Plan a longer hold.
- Clark County population projected at -21% by 2050 — secular population decline; favor cash flow + early exit over multi-decade hold.
Negotiation context
- It's been on market 34 days — a 3% lower offer ($82k) is reasonable based on typical stale-listing flexibility.
Questions for the listing agent
- It's been on market 34 days. Have you received any prior offers? Is the seller open to a 3% concession, seller financing, or rate buy-down credit?
- Have any recent inspections been done? Can we get a copy of the seller's disclosures and any deferred-maintenance estimates?
- Is there a deadline driving the sale (1031 exchange, divorce, estate, relocation)? That informs how much negotiation room exists.
- Schools are D-rated, which usually means shorter tenancies and higher turnover. Who's the typical renter profile here, and what's been the actual vacancy rate?
- What's the average days-on-market for RENTAL listings here right now (not sales)? A rising rental-DOM trend means longer vacancies and softer asking-rent achievability than the comps imply.
- What's the recent tenant-quality profile in this submarket — average credit score on applications, eviction rate, late-payment / NSF rate, and stable-employment percentage? A property-management company in the area should have these aggregated.
- How much new for-sale + rental construction is in the pipeline within 1–3 miles? Heavy new supply typically softens prices + rents 12–24 months out; constrained supply supports both.
Investment metrics
- 1% rule
- 1.07% ✓
- Cap rate
- 8.15%
- Cash-on-cash
- 6.62%
- DSCR
- 1.29
- GRM
- 7.8
CMA / ARV
- ARV (on-the-fly)
- $199,068
- Comps found
- 7
Show comp detail 7 sales within ~0.75 mi
| Address | Dist | Beds/Ba | Sqft | Sold | Price | $/sf | Match |
|---|---|---|---|---|---|---|---|
| 300 W Stanley St | 0.00mi | 2/1.0 | 1,878 (0%) | 13mo | $75,000 | $40 | 89 |
| 200 N Jackson St | 0.08mi | 3/2.0 (+1) | 1,900 (+1%) | 20mo | $143,000 | $75 | 69 |
| 401 S Clark St | 0.45mi | 3/1.5 (+1) | 1,848 (-2%) | 8mo | $256,000 | $139 | 63 |
| 310 W Elm St | 0.23mi | 3/2.5 (+1) | 1,852 (-1%) | 20mo | $165,000 | $89 | 60 |
| 203 E Maple St | 0.43mi | 3/1.5 (+1) | 1,787 (-5%) | 10mo | $249,900 | $140 | 56 |
| 302 W Elm St | 0.21mi | 3/2.5 (+1) | 2,069 (+10%) | 9mo | $347,500 | $168 | 55 |
| 403 E Main St | 0.44mi | 3/1.5 (+1) | 1,752 (-7%) | 22mo | $186,000 | $106 | 43 |
Match score weights: distance 35% · size 25% · config 20% · recency 20%. Top-matched comps best support the ARV.
Projected returns pro-forma
-3.0% appreciation · 3.0% rent growth · sell at horizon
- IRR
- -6.1%
- Equity multiple
- 0.77×
- Total profit
- $-5,401
- Equity at exit
- $12,674
- IRR
- 3.5%
- Equity multiple
- 1.26×
- Total profit
- $6,117
- Equity at exit
- $7,349
Cash invested: $23,800 (down + closing). Projections, not guarantees.
Landlord ↔ Tenant lean methodology
- Overall (STATE)
- 73 Landlord-Friendly
- State Wisconsin
- 73 Landlord-Friendly · R+2
- County
- — inherits STATE
- City
- — inherits STATE
ZIP-level market 54771
- Home prices YoY
- -17.2%
- Active inventory
- 24
- Price-to-rent
- 7.8×
Monthly cashflow live
- Estimated rent
- $910 medium interval (Pro) →
- Mortgage (P&I)
- −$446
- Tax est. 1.5%
- −$106 /mo · $1,275/yr
- Insurance
- −$35
- HOA
- −$0
- Vacancy / Maint / Mgmt
- −$191
- Net cashflow
- $131
Break-even live
Sensitivity live
| Price | -10% $190 | -5% $161 | +0% $131 | +5% $102 | +10% $73 |
|---|---|---|---|---|---|
| Rent | -10% $59 | -5% $95 | +0% $131 | +5% $167 | +10% $203 |
| Rate | -1.0pp $174 | -0.5pp $153 | base $131 | +0.5pp $109 | +1.0pp $87 |
UW: 25.0% down · 7.5% · 30yr · 1.5% tax · 5.0% vac · 8.0% maint · 8.0% mgmt
Financing live
Cash to close
- Down payment
- $21,250
- Closing costs
- $2,550
- Reserves months
- —
- Total cash needed
- —
Loan-product check · same deal, 3 products live
Conventional
25% down · 7.5% · 30yr
- Down + closing
- —
- Monthly P&I
- —
- Monthly cashflow
- —
- DSCR
- —
- Eligible?
- —
Personal DTI + credit; lowest rate.
DSCR
20% down · 8.5% · 30yr
- Down + closing
- —
- Monthly P&I
- —
- Monthly cashflow
- —
- DSCR
- —
- Eligible?
- —
No personal income docs; deal must DSCR.
Hard money
10% down · 12.0% · 12mo
- Down + closing
- —
- Monthly P&I
- —
- Monthly cashflow
- —
- DSCR
- —
- Eligible?
- —
Short-term bridge; refi at stabilization.
Listing history 19 events
-
2026-06-21days on market $85,000 Active 34 DOM
-
2026-06-21days on market $85,000 Active 33 DOM
-
2026-06-18days on market $85,000 Active 31 DOM
-
2026-06-17days on market $85,000 Active 30 DOM
-
2026-06-16days on market $85,000 Active 29 DOM
-
2026-06-15days on market $85,000 Active 28 DOM
-
2026-06-15days on market $85,000 Active 27 DOM
-
2026-06-13days on market $85,000 Active 26 DOM
-
2026-06-12days on market $85,000 Active 25 DOM
-
2026-06-09days on market $85,000 Active 22 DOM
-
2026-06-08days on market $85,000 Active 21 DOM
-
2026-06-08days on market $85,000 Active 20 DOM
-
2026-06-05days on market $85,000 Active 18 DOM
-
2026-06-04days on market $85,000 Active 17 DOM
-
2026-06-03days on market $85,000 Active 16 DOM
-
2026-06-02days on market $85,000 Active 15 DOM
-
2026-06-01days on market $85,000 Active 14 DOM
-
2026-05-31days on market $85,000 Active 13 DOM
-
2026-05-18$85,000 Active
ⓘ Source: listings_history table (triggers on properties + properties_extension) + one-shot
backfill from property_details.listing_events for pre-trigger history.
Nearby sold comps map
Loading sold comps map…
Walkable amenities ~0.75 mi
Loading nearby amenities…
Taxation est. · year 1
- Rental income
- $10,916
- − Mortgage interest
- −$4,761
- − Property taxes
- −$1,275
- − Insurance
- −$425
- − Repairs & maintenance
- −$873
- − Management
- −$873
- − Depreciation
- −$2,473
- Taxable income
- $236
- Est. tax owed @ 24.0%
- −$57
- After-tax cash flow
- $1,518/yr
For passive investors: Depreciation is non-cash, so a rental often shows a tax loss while cash-flowing — sheltering income. Rental losses are passive: they offset passive income freely, and up to $25,000/yr can offset ordinary (W-2) income if you actively participate and your MAGI is under $100k (phasing out to $0 by $150k); unused losses carry forward. On sale, claimed depreciation is recaptured at up to 25%, and gains may owe capital-gains tax (a 1031 exchange can defer both). Figures are a year-1 estimate at your 24.0% rate — not tax advice; consult a CPA.
Condition & rehab AI · 12 photos
This 2-bedroom, 1-bathroom home requires moderate renovations, including painting, flooring updates, and system repairs, to improve its condition and value.
Repairs flagged
- Major Exposed plumbing and electrical components in kitchen and bath — Safety hazard
- Major Exposed HVAC components — Safety hazard
- Major Painted walls with visible wear — Aesthetic issue
Value-add opportunities
- Both Painting and updating flooring — Improves aesthetics and value
- Both Rehabilitating plumbing and electrical systems — Ensures safety and functionality
- Both Upgrading HVAC system — Enhances comfort and energy efficiency
Renovation cost estimate screening
| Repair item | Severity | Est. cost |
|---|---|---|
| Exposed plumbing and electrical components in kitchen and bath · Safety hazard | Major | $15,000–50,000 |
| Exposed HVAC components · Safety hazard | Major | $15,000–50,000 |
| Painted walls with visible wear · Aesthetic issue | Major | $15,000–50,000 |
| Total estimated repair cost · 3 items | $45,000–150,000 |
Value-add ROI direction
- Both Painting and updating flooring — Improves aesthetics and value ↑
- Both Rehabilitating plumbing and electrical systems — Ensures safety and functionality ↑
- Both Upgrading HVAC system — Enhances comfort and energy efficiency ↑
ⓘ Cost ranges are severity-bucket heuristics (US national rule-of-thumb). Get contractor quotes + a written scope before underwriting a rehab budget.
Schools (NCES district)
- District
- Thorp School District
- NCES district ID
- 5514820
- Math proficiency
- 42% ▲ 7.00%
- Reading proficiency
- 37% ▲ 1.00%
- Median HH income
- $43,254
- Composite
- 33.46/100
- National rank
- #5459
- State rank
- #174 of 342 in WI
Livability — Thorp
- Score
- 68/100
- State rank
- #382
- US rank
- #9668
Category grades
Schools grade is shown separately in the Schools card above.
Census & demographics
- Census place
- Thorp, WI
- Population (ZIP)
- 4,291
Population outlook (Clark County) Hauer SSP2
- Today (2025)
- 32,111 people
- By 2030
- 30,727 · -4.3%
- By 2040
- 28,092 · -12.5%
- By 2050
- 25,512 · -20.6%
- By 2075
- 20,054 · -37.5%
- By 2100
- 15,753 · -50.9%
Race, ethnicity, and origin ACS 2023
- Neighborhood character
- Predominantly White (95%)
- Race & ethnicity
- White 95% Two or more races 3% Hispanic / Latino 2%
- Common ancestry
- Romanian 21% Portuguese 6% Lithuanian 3%
- Foreign-born
- 1% · Canada
- Languages at home
- 82% English-only · German/W. Germanic 16% Spanish 1%
Political lean MEDSL · Clark
- 2024 margin
- Solid R (+39.0) · D 29.4% · R 68.4% · Other 2.1%
- 2008→2024 swing
- -46.5pp toward R · 2008: 7.5pp · 2024: -39.0pp
- All cycles
- 2024: R+39.0 2020: R+36.8 2016: R+32.6 2012: R+8.9 2008: D+7.5
Not yet ingested
- Civics
- —
Market trends
- HPI YoY
- ▼ -46.55%
- Current HPI
- 223.5038
- Rent YoY
- —
- Metro
- —
- State GDP YoY
- ▲ 2.10%
- F500 in state
- 20
Industry mix (Fortune 500 HQ in WI)
| Industry | F500 HQs | Revenue |
|---|---|---|
| Industrial Machinery | 4 | $23B |
|
||
| Industrial Technology | 2 | $36B |
|
||
| Insurance | 1 | $36B |
|
||
| Professional Services | 1 | $19B |
|
||
| Utilities | 1 | $9B |
|
||
| Consumer Goods | 1 | $3B |
|
||
Price history
1 event — show timeline
- 2026-05-18 Listed $85,000 CWMLS
Cash-flow waterfall
monthlySold comps — $/sqft
last 12 mo · ≤1 miLoading sold comps…