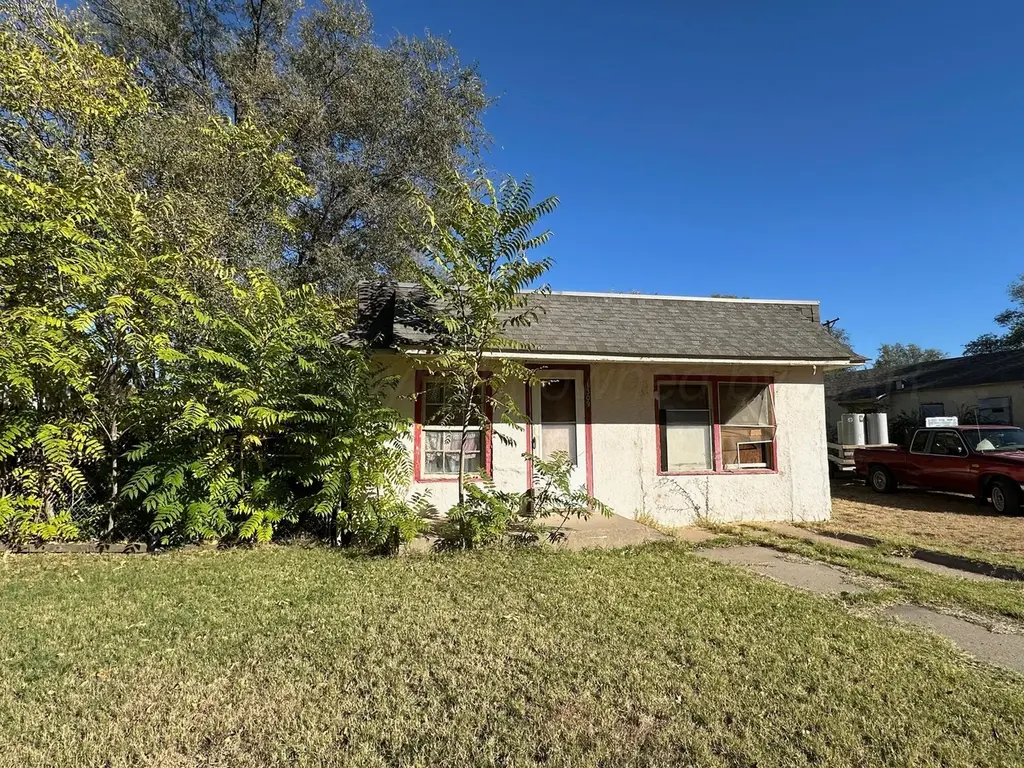
1309 Herman St · Amarillo, TX
Flood risk 1/10 · Minimal
- FEMA flood zone
- X (unshaded)
- Chance of flooding over 30 yrs
- 0.0%
- Est. flood insurance / yr
- $507 – $1,088
Fire risk 2/10 · Minimal
- Est. fire insurance / yr
- $1,222 – $2,270
Heat risk 4/10 · Minor
- Hot days now (above 97°F)
- 6 days/yr
- Hot days in 30 yrs
- 17 days/yr
Wind risk 2/10 · Minimal
- Chance of severe wind over 30 yrs
- —
Air-quality risk 2/10 · Minimal
- Unhealthy air days now
- 1 days/yr
- Unhealthy air days in 30 yrs
- 1 days/yr
Risk factors via First Street. Map © Google.
Why this score? — see what drove the C grade
The composite is a weighted blend of 9 inputs, each scored 0–100. Each bar is that input's sub-score; the figure is the points it added to the 100-point composite (weight × sub-score).
- Cash flow +23.5/30.0
- DSCR +7.6/10.0
- ARV discount +7.5/15.0
- 1% rule +5.1/10.0
- Schools +3.6/10.0
- Livability +3.3/5.0
- Rent growth +2.5/5.0
- Condition / age +2.5/5.0
- Appreciation +0.0/10.0
$79,000
🖨 Deal sheet (PDF) 📄 Offer letter ✓ Due diligence
Listing remarks MLS
Quiet living near downtown! This 2 bedroom, 1 bath home located on a short street in Bivins is ready for your touch! Per seller - gas line and water line replaced around 2006. Affordably priced for quick possession!
Key facts
- 5,876 sq ft lot
- Built 1929
- Listed 231 days
Neighborhood map
What this means for you Summary
Snapshot
- This is a 2-bed/1.0-bath single-family listed at $79k.
Deal economics
- At list price, monthly cash flow is $148 ($2k/yr) — positive.
- The deal already cash-flows at list — no discount required.
- Meets the 1% rule at list price ($799 rent vs $79k).
- Recommended offer: $70k (12.0% below list) — sets the bar for market timing.
Location & tenants
- Location reads 66/100 on livability (#624 in TX) — a middle-class / working-renter tenant base. Strengths: cost of living A+, housing A+; Watch: amenities C-, crime F, commute F.
- Amarillo ISD (urban): math 44% / reading 41% proficiency, ranked #336 of 826 in TX (top 41%) — families likely to look elsewhere, expect single-tenant / working-renter base with shorter leases.
- Zoned schools: Bivins El (math 49% / reading 48%, grade D, #950 of 4,322 statewide, top 22%, 439 students, 76% FRL); Austin Middle (math 47% / reading 43%, grade D, #479 of 1,662 statewide, top 29%, 677 students, 63% FRL); Tascosa H S (math 36% / reading 45%, grade F, #798 of 1,632 statewide, top 49%, 2,187 students, 57% FRL).
- Market conditions: 37 active listings in the ZIP; 20 comparable units currently listed for rent nearby; rentals at typical pace (median 24d on market — plan ~3-4 weeks tenant-placement turnaround); 1,214 units permitted in Potter County in 2024 (650 in 5+ unit buildings).
Forward outlook
- Local home prices are declining (-3.0%/yr); year-one equity from $546 of loan paydown is wiped out by about $2k of value loss. Plan a longer hold.
Negotiation context
- It's been on market 231 days — a 12% lower offer ($70k) is reasonable based on typical stale-listing flexibility.
Risks & watch-outs
- Watch-outs: built in 1929 — expect roof / HVAC / electrical / plumbing capex.
Questions for the listing agent
- It's been on market 231 days. Have you received any prior offers? Is the seller open to a 12% concession, seller financing, or rate buy-down credit?
- Built in 1929 — when were the roof, HVAC, electrical panel, plumbing, and water heater last replaced?
- Why hasn't it sold? Are there any deal-killer items the seller is aware of (foundation, flood, title, zoning, code violations)?
- Is there a deadline driving the sale (1031 exchange, divorce, estate, relocation)? That informs how much negotiation room exists.
- Schools are D-rated, which usually means shorter tenancies and higher turnover. Who's the typical renter profile here, and what's been the actual vacancy rate?
- Crime grade is F in this area — have there been break-ins, vandalism, or insurance claims at this property in the last 3 years? What carrier currently insures it and at what premium?
- What's the average days-on-market for RENTAL listings here right now (not sales)? A rising rental-DOM trend means longer vacancies and softer asking-rent achievability than the comps imply.
- What's the recent tenant-quality profile in this submarket — average credit score on applications, eviction rate, late-payment / NSF rate, and stable-employment percentage? A property-management company in the area should have these aggregated.
- How much new for-sale + rental construction is in the pipeline within 1–3 miles? Heavy new supply typically softens prices + rents 12–24 months out; constrained supply supports both.
Investment metrics
- 1% rule
- 1.01% ✓
- Cap rate
- 8.54%
- Cash-on-cash
- 8.02%
- DSCR
- 1.36
- GRM
- 8.2
CMA / ARV
No comps found within radius.
Projected returns pro-forma
-3.0% appreciation · 3.0% rent growth · sell at horizon
- IRR
- -4.1%
- Equity multiple
- 0.85×
- Total profit
- $-3,414
- Equity at exit
- $11,779
- IRR
- 5.5%
- Equity multiple
- 1.41×
- Total profit
- $9,043
- Equity at exit
- $6,830
Cash invested: $22,120 (down + closing). Projections, not guarantees.
Landlord ↔ Tenant lean methodology
- Overall (STATE)
- 87 Strongly Landlord-Friendly
- State Texas
- 87 Strongly Landlord-Friendly · R+5
- County
- — inherits STATE
- City
- — inherits STATE
ZIP-level market 79102
- Home prices YoY
- -33.0%
- Active inventory
- 37
- Price-to-rent
- 8.2×
Monthly cashflow live
- Estimated rent
- $799 high interval (Pro) →
- Mortgage (P&I)
- −$414
- Tax from tax record
- −$36 /mo · $437/yr
- Insurance
- −$33
- HOA
- −$0
- Lot rent
- −$0
- Vacancy / Maint / Mgmt
- −$168
- Net cashflow
- $148
Break-even live
Sensitivity live
| Price | -10% $193 | -5% $170 | +0% $148 | +5% $125 | +10% $103 |
|---|---|---|---|---|---|
| Rent | -10% $85 | -5% $116 | +0% $148 | +5% $179 | +10% $211 |
| Rate | -1.0pp $188 | -0.5pp $168 | base $148 | +0.5pp $127 | +1.0pp $107 |
UW: 25.0% down · 7.5% · 30yr · 1.5% tax · 5.0% vac · 8.0% maint · 8.0% mgmt
Financing live
Cash to close
- Down payment
- $19,750
- Closing costs
- $2,370
- Reserves months
- —
- Total cash needed
- —
Loan-product check · same deal, 3 products live
Conventional
25% down · 7.5% · 30yr
- Down + closing
- —
- Monthly P&I
- —
- Monthly cashflow
- —
- DSCR
- —
- Eligible?
- —
Personal DTI + credit; lowest rate.
DSCR
20% down · 8.5% · 30yr
- Down + closing
- —
- Monthly P&I
- —
- Monthly cashflow
- —
- DSCR
- —
- Eligible?
- —
No personal income docs; deal must DSCR.
Hard money
10% down · 12.0% · 12mo
- Down + closing
- —
- Monthly P&I
- —
- Monthly cashflow
- —
- DSCR
- —
- Eligible?
- —
Short-term bridge; refi at stabilization.
Rent comps 20 comps
| Address | Beds | Baths | Sqft | Rent | $/sqft | DOM | Units | Dist |
|---|---|---|---|---|---|---|---|---|
| 1506 SW 11th Ave Unit A Amarillo, TX | 1.0 | 1.0 | 608 | $650 | $1.07 | 46d | 1 | 0.21mi |
| 1212 SW 9th Ave Unit A Amarillo, TX | 1.0 | 1.0 | 550 | $770 | $1.40 | 23d | 1 | 0.40mi |
| 709 SW 14th Ave Unit 4 Amarillo, TX | 1.0 | 1.0 | 700 | $695 | $0.99 | 23d | 1 | 0.47mi |
| 612 SW 17th Ave Amarillo, TX | 1.0 | 1.0 | 1008 | $650 | $0.64 | 23d | 1 | 0.57mi |
| 2030 S Hayden St Amarillo, TX | 1.0 | 1.0 | 630 | $650 | $1.03 | 15d | 1 | 0.63mi |
| 2306 SW 8th Ave Unit 2 Amarillo, TX | 2.0 | 1.0 | 700 | $950 | $1.36 | 46d | 1 | 0.75mi |
| 2306 SW 8th Ave Amarillo, TX | 2.0 | 1.0 | 553 | $950 | $1.72 | 23d | 1 | 0.75mi |
| 2700 W 16th Ave Amarillo, TX | 1.0 | 1.0 | 693 | $830 | $1.20 | 15d | 1 | 0.75mi |
| 3118 SW 15th Ave Amarillo, TX | 2.0–3.0 | 1.0–2.0 | 1015 | $640 | $0.63 | 15d | 17 | 0.91mi |
| 705 S Florida St Amarillo, TX | 2.0 | 1.0 | 1014 | $850 | $0.84 | 23d | 1 | 0.93mi |
| 1616 1 S Polk St Unit 1 Amarillo, TX | 1.0 | 1.0 | 530 | $525 | $0.99 | 46d | 1 | 0.93mi |
| 802 S Kentucky St Amarillo, TX | 2.0 | 1.0 | 970 | $899 | $0.93 | 46d | 1 | 0.97mi |
| 1008 S Mississippi St Amarillo, TX | 3.0 | 2.0 | 1061 | $1,275 | $1.20 | 23d | 1 | 1.08mi |
| 2216 S Polk St Apt D Amarillo, TX | 1.0 | 1.0 | 544 | $575 | $1.06 | 46d | 1 | 1.17mi |
| 2400 S Polk St #204 Amarillo, TX | 1.0 | 1.0 | 549 | $1,300 | $2.37 | 46d | 1 | 1.23mi |
| 9 S Polk St Unit 9 Amarillo, TX | 1.0 | 1.0 | 530 | $525 | $0.99 | 15d | 1 | 1.38mi |
| 108 N Florida St Amarillo, TX | 2.0 | 1.0 | 960 | $800 | $0.83 | 23d | 1 | 1.38mi |
| 406 S Tennessee St Amarillo, TX | 2.0 | 1.0 | 837 | $895 | $1.07 | 23d | 1 | 1.43mi |
| 211 S Carolina St Unit A Amarillo, TX | 1.0 | 1.0 | 600 | $993 | $1.66 | 46d | 1 | 1.45mi |
| 3003 SW 27th Ave Amarillo, TX | 2.0 | 1.5 | 808 | $895 | $1.11 | 15d | 1 | 1.47mi |
Listing history 19 events
-
2026-06-21days on market $79,000 Active 231 DOM
-
2026-06-18days on market $79,000 Active 228 DOM
-
2026-06-17days on market $79,000 Active 227 DOM
-
2026-06-16days on market $79,000 Active 226 DOM
-
2026-06-15days on market $79,000 Active 225 DOM
-
2026-06-14days on market $79,000 Active 223 DOM
-
2026-06-13days on market $79,000 Active 222 DOM
-
2026-06-10days on market $79,000 Active 220 DOM
-
2026-06-09days on market $79,000 Active 219 DOM
-
2026-06-08days on market $79,000 Active 218 DOM
-
2026-06-07days on market $79,000 Active 217 DOM
-
2026-06-03days on market $79,000 Active 213 DOM
-
2026-06-02days on market $79,000 Active 212 DOM
-
2026-06-01days on market $79,000 Active 211 DOM
-
2026-05-31days on market $79,000 Active 210 DOM
-
2026-05-30days on market $79,000 Active 209 DOM
-
2025-11-03$79,000 Active 219-char remark
Show marketing remark (219 chars)
Quiet living near downtown! This 2 bedroom, 1 bath home located on a short street in Bivins is ready for your touch! Per seller - gas line and water line replaced around 2006. Affordably priced for quick possession!
-
2006-07-10soldstatus
-
2004-06-23soldstatus 101-char remark
Show marketing remark (101 chars)
3 UNIT APARTMENT PLUS DETACHED EFFICIENCY & 2 BEDROOM HOUSE. SOLD ONLY 'AS IS' AND AS ONE UNIT.
ⓘ Source: listings_history table (triggers on properties + properties_extension) + one-shot
backfill from property_details.listing_events for pre-trigger history.
Tax reassessment forecast TX · Resets to sale price
- Current annual tax
- $437 · $36/mo
- Projected year-2 tax
- $1,446 · $120/mo
- Expected delta
- +$1,009/yr (+$84/mo · 230.8%)
ⓘ Screening estimate from a state-policy table — verify with the county assessor before closing.
Climate risk First Street
- Flood 1/10 Low FEMA zone X (unshaded) · 0% chance over 30 yrs
- Wildfire 2/10 Low
- Heat 4/10 Moderate 6 d/yr ≥97°F today · 17 d/yr by 30 yrs out
- Wind 2/10 Low
- Air quality 2/10 Low 1 unhealthy d/yr today · 1 by 30 yrs out
Nearby sold comps map
Loading sold comps map…
Walkable amenities ~0.75 mi
Loading nearby amenities…
Taxation est. · year 1
- Rental income
- $9,591
- − Mortgage interest
- −$4,425
- − Property taxes
- −$437
- − Insurance
- −$395
- − Repairs & maintenance
- −$767
- − Management
- −$767
- − Depreciation
- −$2,298
- Taxable income
- $501
- Est. tax owed @ 24.0%
- −$120
- After-tax cash flow
- $1,653/yr
For passive investors: Depreciation is non-cash, so a rental often shows a tax loss while cash-flowing — sheltering income. Rental losses are passive: they offset passive income freely, and up to $25,000/yr can offset ordinary (W-2) income if you actively participate and your MAGI is under $100k (phasing out to $0 by $150k); unused losses carry forward. On sale, claimed depreciation is recaptured at up to 25%, and gains may owe capital-gains tax (a 1031 exchange can defer both). Figures are a year-1 estimate at your 24.0% rate — not tax advice; consult a CPA.
Schools (NCES district)
- District
- Amarillo ISD
- NCES district ID
- 4808130
- Math proficiency
- 44% ▼ -9.00%
- Reading proficiency
- 41% ▼ -3.00%
- Median HH income
- $43,478
- Composite
- 35.96/100
- National rank
- #4798
- State rank
- #336 of 826 in TX
Livability — Amarillo
- Score
- 66/100
- State rank
- #624
- US rank
- #11876
Category grades
Schools grade is shown separately in the Schools card above.
Census & demographics
- Census place
- Amarillo, TX
- County
- Potter County · 72,216 people
- City population
- 185,802
- Metro
- Amarillo, TX
- Population (ZIP)
- 9,393
- Household income
- $51,125
- Rent vs Own
- Severe rent burden
- 487.0
Population outlook (Potter County) Hauer SSP2
- Today (2025)
- 121,296 people
- By 2030
- 120,883 · -0.3%
- By 2040
- 119,668 · -1.3%
- By 2050
- 117,788 · -2.9%
- By 2075
- 110,250 · -9.1%
- By 2100
- 92,923 · -23.4%
Race, ethnicity, and origin ACS 2023
- Neighborhood character
- Diverse neighborhood (Simpson 0.58)
- Race & ethnicity
- White 50% Hispanic / Latino 40% Two or more races 15% Asian 4% Black 3% Native American 1%
- Hispanic origin (detail)
- Mexican 31%
- Common ancestry
- Italian 3% Slovak 1% Lithuanian 1%
- Foreign-born
- 10% · Canada, Philippines
- Languages at home
- 77% English-only · Spanish 21% Other Asian/Pacific 2%
Political lean MEDSL · Potter
- 2024 margin
- Solid R (+44.4) · D 27.3% · R 71.7% · Other 1.1%
- 2008→2024 swing
- -5.0pp toward R · 2008: -39.4pp · 2024: -44.4pp
- All cycles
- 2024: R+44.4 2020: R+38.7 2016: R+41.9 2012: R+44.6 2008: R+39.4
Not yet ingested
- Civics
- —
Market trends
- HPI YoY
- ▼ -86.43%
- Current HPI
- 175.582
- Rent YoY
- —
- Metro
- Amarillo, TX
- State GDP YoY
- ▲ 3.95%
- F500 in state
- 110
Industry mix (Fortune 500 HQ in TX)
| Industry | F500 HQs | Revenue |
|---|---|---|
| Energy | 16 | $1,198B |
|
||
| Technology | 5 | $198B |
|
||
| Engineering / Construction | 4 | $72B |
|
||
| Energy Services | 3 | $60B |
|
||
| Utilities | 3 | $41B |
|
||
| Healthcare | 2 | $330B |
|
||
Price history
3 events — show timeline
- 2025-11-03 Listed $79,000 AARMLS
- 2006-07-10 Sold (Public Records) — Public Records
- 2004-06-23 Sold (MLS) — AARMLS
Property tax history
-0.3%/yrLatest (2025): $437 · +5.1% YoY. Source: county tax records.
Cash-flow waterfall
monthlySold comps — $/sqft
last 12 mo · ≤1 miLoading sold comps…