1215 Paradise · Canyon Lake, TX
Flood risk 1/10 · Minimal
- FEMA flood zone
- X (unshaded)
- Chance of flooding over 30 yrs
- 0.0%
- Est. flood insurance / yr
- $507 – $1,088
Fire risk 4/10 · Minor
- Est. fire insurance / yr
- $1,222 – $2,270
Heat risk 7/10 · Major
- Hot days now (above 107°F)
- 7 days/yr
- Hot days in 30 yrs
- 20 days/yr
Wind risk 6/10 · Moderate
- Chance of severe wind over 30 yrs
- 73.0%
Air-quality risk 2/10 · Minimal
- Unhealthy air days now
- 0 days/yr
- Unhealthy air days in 30 yrs
- 1 days/yr
Risk factors via First Street. Map © Google.
Why this score? — see what drove the D grade
The composite is a weighted blend of 9 inputs, each scored 0–100. Each bar is that input's sub-score; the figure is the points it added to the 100-point composite (weight × sub-score).
- ARV discount +13.2/15.0
- Cash flow +9.9/30.0
- Schools +5.2/10.0
- Livability +3.4/5.0
- DSCR +2.8/10.0
- 1% rule +2.7/10.0
- Condition / age +2.5/5.0
- Rent growth +2.2/5.0
- Appreciation +0.0/10.0
$300,000
🖨 Deal sheet (PDF) 📄 Offer letter ✓ Due diligence
Listing remarks MLS
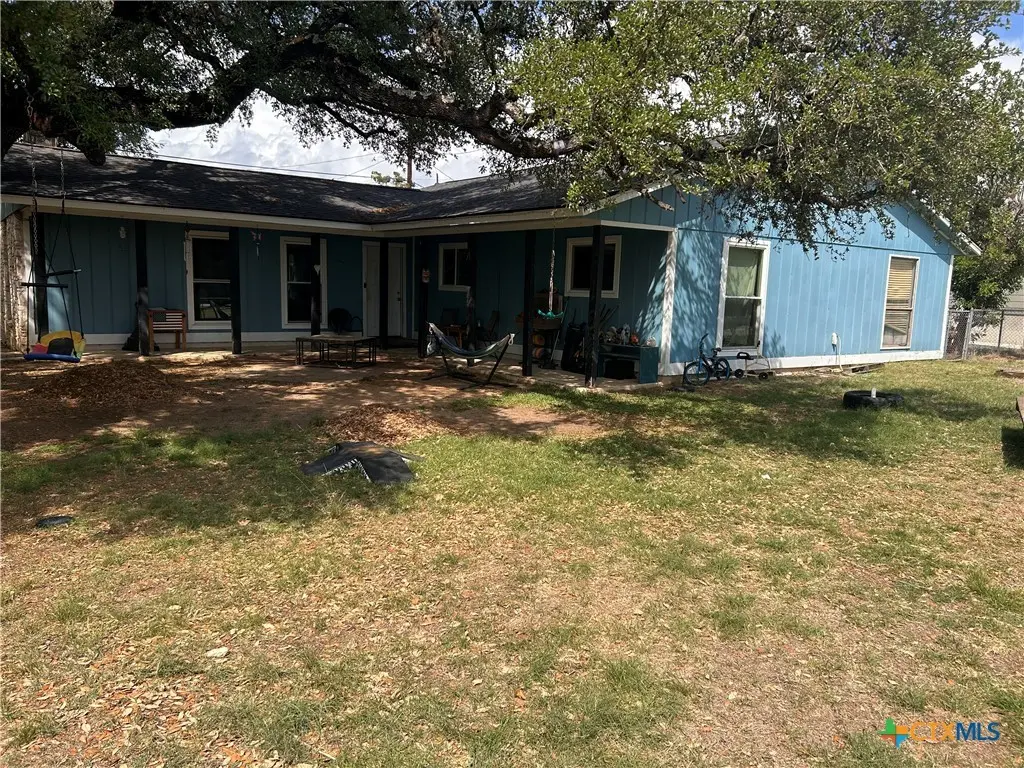
well maintained 3 bedroom 2 bath home in Canyon Lake Hills sits on a large lot with a stand of hugh oak trees in the front yard that provide shade for almost half the yard, roof replaced in 2022 AC replaced in 2019, overall it would be a perfect fit for a new family or a family ready to down size.
Key facts
- Ac replaced
- Large lot
- Huge oak trees
Tags
Neighborhood map
What this means for you Summary
Snapshot
- This is a 3-bed/2.0-bath single-family listed at $300k.
Deal economics
- At list price, monthly cash flow is $-188 ($-2k/yr) — negative.
- To cash-flow at today's rent, offer at most $267k (11.1% below list).
- To meet the 1% rule (rent ≥ 1% of price), the offer needs to be $232k (22.7% below list).
- Recommended offer: $232k (22.7% below list) — sets the bar for 1% rule.
- Cap rate 5.5% vs local median 2.2% in Canyon Lake — top-decile yield for the area; either an underpriced asset or a hidden risk that comps aren't pricing in. Stress-test before assuming the spread holds.
Location & tenants
- Location reads 67/100 on livability (#534 in TX) — a middle-class / working-renter tenant base. Strengths: employment A+, housing A+, cost of living A; Watch: amenities F, commute F, health & safety F.
- Comal ISD (rural): math 57% / reading 59% proficiency, ranked #58 of 826 in TX (top 7%) — acceptable for families but not a draw, mixed tenant base, ~2y average lease.
- Zoned schools: Startzville El (math 42% / reading 52%, grade D-, #1,006 of 4,322 statewide, top 25%, 465 students, 68% FRL); Mt Valley Middle (math 55% / reading 51%, grade C+, #281 of 1,662 statewide, top 18%, 808 students, 49% FRL); Canyon Lake H S (math 46% / reading 56%, grade D+, #482 of 1,632 statewide, top 30%, 1,038 students, 37% FRL) — zoned schools average 51% FRL vs 31% district-wide (21 pts higher); higher-poverty schools than district average — tighter screening recommended.
- Market conditions: Rents soft (-1.2%/yr); 1029 active listings in the ZIP; 16 comparable units currently listed for rent nearby; rentals at typical pace (median 23d on market — plan ~3-4 weeks tenant-placement turnaround); solid renter incomes; 3,420 units permitted in Comal County in 2024 (1,164 in 5+ unit buildings).
- This rent runs 33% of the median local income ($84k/yr) — at the standard rent-burdened threshold; future hikes will face affordability resistance.
Forward outlook
- Local home prices are declining (-3.0%/yr); year-one equity from $2k of loan paydown is wiped out by about $9k of value loss. Plan a longer hold.
- Comal County population projected at +70% by 2050 — long-run rental-demand tailwind backs the buy-and-hold thesis.
Negotiation context
- It's been on market 72 days — a 6% lower offer ($282k) is reasonable based on typical stale-listing flexibility.
- 4 sale attempts since 19y ago with the ask held roughly flat each time — persistent listings suggest the price (not the market) is what's stuck; bring a comps-based counter.
Risks & watch-outs
- Climate carrying-cost: major wind risk, 73% chance of damaging wind over 30y; extreme-heat days projected 7→20/yr by 2055 (HVAC capex compounding) — expect insurance premiums to compound above CPI over the hold.
Questions for the listing agent
- What do current leases actually rent for vs. the listed asking? Can we see a recent rent roll and the last 12 months of T-12 income?
- It's been on market 72 days. Have you received any prior offers? Is the seller open to a 23% concession, seller financing, or rate buy-down credit?
- Built in 1979 — when were the roof, HVAC, electrical panel, plumbing, and water heater last replaced?
- What does the HOA fee cover, when was the last increase, and are there any pending special assessments or reserve-fund shortfalls?
- Why hasn't it sold? Are there any deal-killer items the seller is aware of (foundation, flood, title, zoning, code violations)?
- Is there a deadline driving the sale (1031 exchange, divorce, estate, relocation)? That informs how much negotiation room exists.
- The area grade is low — what's the realistic commute time and amenity access for the typical tenant pool here? Any planned neighborhood developments (good or bad) we should know about?
- What's the average days-on-market for RENTAL listings here right now (not sales)? A rising rental-DOM trend means longer vacancies and softer asking-rent achievability than the comps imply.
- What's the recent tenant-quality profile in this submarket — average credit score on applications, eviction rate, late-payment / NSF rate, and stable-employment percentage? A property-management company in the area should have these aggregated.
- How much new for-sale + rental construction is in the pipeline within 1–3 miles? Heavy new supply typically softens prices + rents 12–24 months out; constrained supply supports both.
Investment metrics
- 1% rule
- 0.77% ✗
- Cap rate
- 5.54%
- Cash-on-cash
- -2.69%
- DSCR
- 0.88
- GRM
- 10.8
CMA / ARV
- ARV (median comp)
- $343,604
- List price
- $300,000
- Delta
- -12.69%
- Verdict
- UNDERPRICED
- Comps
- 20 within 1.0 mi
Show comp detail 12 sales within ~0.75 mi
| Address | Dist | Beds/Ba | Sqft | Sold | Price | $/sf | Match |
|---|---|---|---|---|---|---|---|
| 596 Riviera Dr | 0.04mi | 3/2.0 | 1,477 (-6%) | 10mo | $349,900 | $237 | 81 |
| 3187 Lakeview Dr | 0.45mi | 3/2.0 | 1,620 (+4%) | 0mo | $649,885 | $401 | 73 |
| 817 Scenic Dr | 0.71mi | 3/2.0 | 1,557 (-0%) | 1mo | $389,000 | $250 | 66 |
| 1909 Canyon Lake Dr | 0.47mi | 3/2.0 | 1,620 (+4%) | 12mo | $375,000 | $231 | 62 |
| 648 Bald Eagle | 0.74mi | 3/2.0 | 1,556 (-0%) | 6mo | $299,900 | $193 | 59 |
| 616 Hummingbird Hl | 0.44mi | 3/2.0 | 1,481 (-5%) | 15mo | $299,500 | $202 | 58 |
| 760 Lookout | 0.42mi | 3/3.0 | 1,685 (+8%) | 9mo | $354,900 | $211 | 56 |
| 545 Wagon Wheel | 0.20mi | 2/1.0 (-1) | 1,372 (-12%) | 13mo | $239,000 | $174 | 50 |
| 3091 Lakeview | 0.55mi | 3/2.0 | 1,348 (-14%) | 3mo | $324,000 | $240 | 49 |
| 354 Paradise | 0.52mi | 3/3.0 | 1,368 (-12%) | 8mo | $165,000 | $121 | 44 |
| 1568 Blueridge Dr | 0.70mi | 3/2.0 | 1,348 (-14%) | 2mo | $280,000 | $208 | 43 |
| 282 Lighthouse | 0.69mi | 3/2.0 | 1,344 (-14%) | 7mo | $275,000 | $205 | 39 |
Match score weights: distance 35% · size 25% · config 20% · recency 20%. Top-matched comps best support the ARV.
Projected returns pro-forma
-3.0% appreciation · 0.0% rent growth · sell at horizon
- IRR
- -24.1%
- Equity multiple
- 0.20×
- Total profit
- $-67,397
- Equity at exit
- $44,731
- IRR
- -30.5%
- Equity multiple
- -0.19×
- Total profit
- $-100,374
- Equity at exit
- $25,939
Cash invested: $84,000 (down + closing). Projections, not guarantees.
Landlord ↔ Tenant lean methodology
- Overall (STATE)
- 87 Strongly Landlord-Friendly
- State Texas
- 87 Strongly Landlord-Friendly · R+5
- County
- — inherits STATE
- City
- — inherits STATE
ZIP-level market 78133
- Home prices YoY
- -33.8%
- Rents YoY
- -1.2%
- Active inventory
- 1029
- Price-to-rent
- 10.8×
Monthly cashflow live
- Estimated rent
- $2,318 high interval (Pro) →
- Mortgage (P&I)
- −$1,573
- Tax from tax record
- −$319 /mo · $3,829/yr
- Insurance
- −$125
- HOA
- −$2
- Lot rent
- −$0
- Vacancy / Maint / Mgmt
- −$487
- Net cashflow
- $-188
Break-even live
Sensitivity live
| Price | -10% $-18 | -5% $-103 | +0% $-188 | +5% $-273 | +10% $-358 |
|---|---|---|---|---|---|
| Rent | -10% $-371 | -5% $-280 | +0% $-188 | +5% $-97 | +10% $-5 |
| Rate | -1.0pp $-37 | -0.5pp $-112 | base $-188 | +0.5pp $-266 | +1.0pp $-345 |
UW: 25.0% down · 7.5% · 30yr · 1.5% tax · 5.0% vac · 8.0% maint · 8.0% mgmt
Financing live
Cash to close
- Down payment
- $75,000
- Closing costs
- $9,000
- Reserves months
- —
- Total cash needed
- —
Loan-product check · same deal, 3 products live
Conventional
25% down · 7.5% · 30yr
- Down + closing
- —
- Monthly P&I
- —
- Monthly cashflow
- —
- DSCR
- —
- Eligible?
- —
Personal DTI + credit; lowest rate.
DSCR
20% down · 8.5% · 30yr
- Down + closing
- —
- Monthly P&I
- —
- Monthly cashflow
- —
- DSCR
- —
- Eligible?
- —
No personal income docs; deal must DSCR.
Hard money
10% down · 12.0% · 12mo
- Down + closing
- —
- Monthly P&I
- —
- Monthly cashflow
- —
- DSCR
- —
- Eligible?
- —
Short-term bridge; refi at stabilization.
Rent comps 16 comps
| Address | Beds | Baths | Sqft | Rent | $/sqft | DOM | Units | Dist |
|---|---|---|---|---|---|---|---|---|
| 693 Riviera Dr Canyon Lake, TX | 3.0 | 2.0 | 1776 | $2,995 | $1.69 | 46d | 1 | 0.07mi |
| 2676 Woodcrest Dr Canyon Lake, TX | 3.0 | 2.0 | 1180 | $2,100 | $1.78 | 46d | 1 | 0.22mi |
| 1569 Comfort Canyon Lake, TX | 3.0 | 2.0 | 1200 | $1,950 | $1.62 | 20d | 1 | 0.29mi |
| 1569 Comfort Unit Na Canyon Lake, TX | 3.0 | 2.0 | 1200 | $1,950 | $1.62 | 17d | 1 | 0.29mi |
| 4348 Morningside Way Canyon Lake, TX | 2.0 | 2.0 | 1166 | $1,550 | $1.33 | 22d | 1 | 0.31mi |
| 612 Mockingbird Dr Canyon Lake, TX | 3.0 | 2.0 | 1420 | $1,950 | $1.37 | 13d | 1 | 0.43mi |
| 1198 Green Hill Dr Canyon Lake, TX | 3.0 | 2.0 | 1207 | $1,775 | $1.47 | 6d | 1 | 0.49mi |
| 1104 Blueridge Dr Canyon Lake, TX | 2.0 | 2.0 | 1250 | $1,700 | $1.36 | 46d | 1 | 0.52mi |
| 1235 Green Hill Dr Canyon Lake, TX | 3.0 | 2.0 | 1326 | $1,800 | $1.36 | 46d | 1 | 0.53mi |
| 2059 Glenn Dr Canyon Lake, TX | 2.0 | 2.5 | 2016 | $2,750 | $1.36 | 26d | 1 | 0.99mi |
| 520 Lake Frst Canyon Lake, TX | 3.0 | 3.0 | 1606 | $2,900 | $1.81 | 1d | 1 | 1.13mi |
| 1392 Hillcrest Frst Canyon Lake, TX | 4.0 | 3.0 | 2050 | $4,000 | $1.95 | 46d | 1 | 1.21mi |
| 2488 Waterfront Park Dr Canyon Lake, TX | 4.0 | 3.0 | 2134 | $3,250 | $1.52 | 21d | 1 | 1.24mi |
| 662 Hillclimb Canyon Lake, TX | 3.0 | 1.5 | 1345 | $1,950 | $1.45 | 46d | 1 | 1.34mi |
| 1219 Lakeside Dr E Canyon Lake, TX | 4.0 | 2.0 | 1216 | $2,180 | $1.79 | 6d | 1 | 1.40mi |
| 1288 Canyon Springs Dr Unit 1351234P Canyon Lake, TX | 3.0 | 2.0 | 1539 | $4,129 | $2.68 | 17d | 1 | 1.50mi |
HOA detail
- Monthly dues
- $2 · $24/yr
Listing history 25 events
-
2026-06-22days on market $300,000 Active 72 DOM
-
2026-06-21days on market $300,000 Active 71 DOM
-
2026-06-18days on market $300,000 Active 68 DOM
-
2026-06-17days on market $300,000 Active 67 DOM
-
2026-06-16days on market $300,000 Active 66 DOM
-
2026-06-15days on market $300,000 Active 65 DOM
-
2026-06-13days on market $300,000 Active 63 DOM
-
2026-06-09days on market $300,000 Active 59 DOM
-
2026-06-08days on market $300,000 Active 58 DOM
-
2026-06-07days on market $300,000 Active 57 DOM
-
2026-06-04days on market $300,000 Active 54 DOM
-
2026-06-03days on market $300,000 Active 53 DOM
-
2026-06-02days on market $300,000 Active 52 DOM
-
2026-06-01days on market $300,000 Active 51 DOM
-
2026-05-31days on market $300,000 Active 50 DOM
-
2026-04-10$300,000 Active 298-char remark
Show marketing remark (298 chars)
well maintained 3 bedroom 2 bath home in Canyon Lake Hills sits on a large lot with a stand of hugh oak trees in the front yard that provide shade for almost half the yard, roof replaced in 2022 AC replaced in 2019, overall it would be a perfect fit for a new family or a family ready to down size.
-
2021-07-01soldstatus
-
2013-04-30soldstatus
-
2013-01-23historical
-
2013-01-05$105,000
-
2008-09-05soldstatus
-
2008-09-02soldstatus
-
2008-06-04$139,000
-
2008-05-28historical
-
2007-10-26$139,000
ⓘ Source: listings_history table (triggers on properties + properties_extension) + one-shot
backfill from property_details.listing_events for pre-trigger history.
Tax reassessment forecast TX · Resets to sale price
- Current annual tax
- $3,829 · $319/mo
- Projected year-2 tax
- $5,490 · $458/mo
- Expected delta
- +$1,661/yr (+$138/mo · 43.4%)
ⓘ Screening estimate from a state-policy table — verify with the county assessor before closing.
Climate risk First Street
- Flood 1/10 Low FEMA zone X (unshaded) · 0% chance over 30 yrs
- Wildfire 4/10 Moderate
- Heat 7/10 Severe 7 d/yr ≥107°F today · 20 d/yr by 30 yrs out
- Wind 6/10 Major 73% chance of damaging wind over 30 yrs
- Air quality 2/10 Low 0 unhealthy d/yr today · 1 by 30 yrs out
Nearby sold comps map
Loading sold comps map…
Walkable amenities ~0.75 mi
Loading nearby amenities…
Taxation est. · year 1
- Rental income
- $27,813
- − Mortgage interest
- −$16,805
- − Property taxes
- −$3,829
- − Insurance
- −$1,500
- − Repairs & maintenance
- −$2,225
- − Management
- −$2,225
- − HOA
- −$24
- − Depreciation
- −$8,727
- Taxable loss
- −$7,522
- Est. tax savings @ 24.0%
- +$1,805
- After-tax cash flow
- $-454/yr
For passive investors: Depreciation is non-cash, so a rental often shows a tax loss while cash-flowing — sheltering income. Rental losses are passive: they offset passive income freely, and up to $25,000/yr can offset ordinary (W-2) income if you actively participate and your MAGI is under $100k (phasing out to $0 by $150k); unused losses carry forward. On sale, claimed depreciation is recaptured at up to 25%, and gains may owe capital-gains tax (a 1031 exchange can defer both). Figures are a year-1 estimate at your 24.0% rate — not tax advice; consult a CPA.
Schools (NCES district)
- District
- Comal ISD
- NCES district ID
- 4814730
- Math proficiency
- 57% ▼ -9.00%
- Reading proficiency
- 59% ▼ -2.00%
- Median HH income
- $74,792
- Composite
- 51.79/100
- National rank
- #1671
- State rank
- #58 of 826 in TX
Livability — Canyon Lake
- Score
- 67/100
- State rank
- #534
- US rank
- #10441
Category grades
Schools grade is shown separately in the Schools card above.
Census & demographics
- Census place
- Canyon Lake, TX
- County
- Comal County · 206,262 people
- City population
- 42,159
- Metro
- San Antonio-New Braunfels, TX
- Population (ZIP)
- 21,959
- Household income
- $83,853
- Rent vs Own
- Severe rent burden
- 402.0
Population outlook (Comal County) Hauer SSP2
- Today (2025)
- 175,637 people
- By 2030
- 199,911 · +13.8%
- By 2040
- 249,436 · +42.0%
- By 2050
- 299,430 · +70.5%
- By 2075
- 423,857 · +141.3%
- By 2100
- 512,048 · +191.5%
Race, ethnicity, and origin ACS 2023
- Neighborhood character
- Predominantly White (74%)
- Race & ethnicity
- White 74% Hispanic / Latino 20% Two or more races 10% Black 2%
- Hispanic origin (detail)
- Mexican 15%
- Common ancestry
- Lithuanian 3% Romanian 3% Italian 3%
- Foreign-born
- 4% · Canada
- Languages at home
- 91% English-only · Spanish 7%
Political lean MEDSL · Comal
- 2024 margin
- Solid R (+45.5) · D 26.8% · R 72.2%
- 2008→2024 swing
- +1.9pp toward D · 2008: -47.4pp · 2024: -45.5pp
- All cycles
- 2024: R+45.5 2020: R+42.7 2016: R+50.1 2012: R+54.1 2008: R+47.4
Not yet ingested
- Civics
- —
Market trends
- HPI YoY
- ▼ -111.36%
- Current HPI
- 218.4633
- Rent YoY
- ▼ -1.20%
- Metro
- San Antonio-New Braunfels, TX
- State GDP YoY
- ▲ 3.95%
- F500 in state
- 110
Industry mix (Fortune 500 HQ in TX)
| Industry | F500 HQs | Revenue |
|---|---|---|
| Energy | 16 | $1,198B |
|
||
| Technology | 5 | $198B |
|
||
| Engineering / Construction | 4 | $72B |
|
||
| Energy Services | 3 | $60B |
|
||
| Utilities | 3 | $41B |
|
||
| Healthcare | 2 | $330B |
|
||
Price history
+115.8% since first listed10 events — show timeline
- 2026-04-10 Listed $300,000 CTXMLS
- 2021-07-01 Sold (Public Records) — Public Records
- 2013-04-30 Sold (MLS) — LERA
- 2013-01-23 Listing Removed — LERA
- 2013-01-05 Listed $105,000 LERA
- 2008-09-05 Sold (Public Records) — Public Records
- 2008-09-02 Sold (MLS) — LERA
- 2008-06-04 Listed $139,000 LERA
- 2008-05-28 Listing Removed — LERA
- 2007-10-26 Listed $139,000 LERA
Property tax history
+3.1%/yrLatest (2026): $3,829 · -12.9% YoY. Source: county tax records.
Cash-flow waterfall
monthlySold comps — $/sqft
last 12 mo · ≤1 miLoading sold comps…