6698 10th AVE · Palm Springs, FL
Flood risk 1/10 · Minimal
- FEMA flood zone
- X (unshaded)
- Chance of flooding over 30 yrs
- 0.0%
- Est. flood insurance / yr
- $507 – $1,088
Fire risk 1/10 · Minimal
- Est. fire insurance / yr
- $947 – $1,759
Heat risk 9/10 · Severe
- Hot days now (above 105°F)
- 7 days/yr
- Hot days in 30 yrs
- 25 days/yr
Wind risk 10/10 · Severe
- Chance of severe wind over 30 yrs
- 99.0%
Air-quality risk 2/10 · Minimal
- Unhealthy air days now
- 0 days/yr
- Unhealthy air days in 30 yrs
- 2 days/yr
Risk factors via First Street. Map © Google.
Why this score? — see what drove the F grade
The composite is a weighted blend of 9 inputs, each scored 0–100. Each bar is that input's sub-score; the figure is the points it added to the 100-point composite (weight × sub-score).
- ARV discount +7.5/15.0
- 1% rule +6.0/10.0
- Schools +4.3/10.0
- Livability +3.7/5.0
- Condition / age +2.5/5.0
- Rent growth +1.9/5.0
- Cash flow +0.0/30.0
- DSCR +0.0/10.0
- Appreciation +0.0/10.0
$230,000
🖨 Deal sheet 📄 Offer letter ✓ Due diligence
Listing remarks
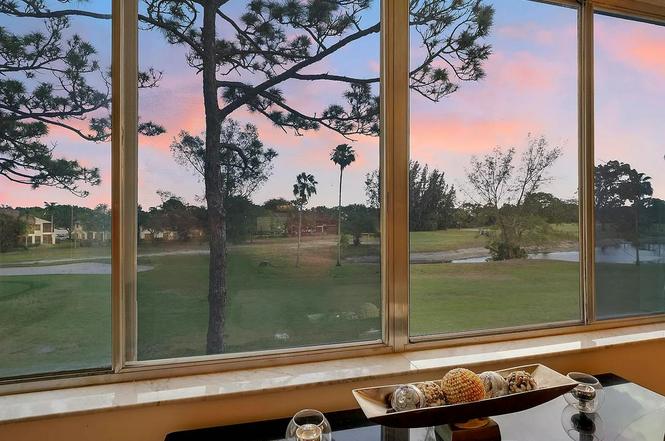
Beautifully Renovated 55+ Apartment in Lake Worth, FL Enjoy resort-style living in this newly renovated 3-bedroom, 2-bath home featuring stunning golf course views. Located in a vibrant 55+ community, residents enjoy top-notch amenities including a sparkling pool and assigned parking. Just minutes from shopping, dining, and the beautiful local beaches this is South Florida living at its best!
Key facts
- Top-notch amenities
- Renovated apartment
- Assigned parking
Tags
Neighborhood map
What this means for you Summary
Snapshot
- This is a 3-bed/2.0-bath condo listed at $230k.
Deal economics
- At list price, monthly cash flow is $-1k ($-13k/yr) — negative.
- The deal already cash-flows at list — no discount required.
- Meets the 1% rule at list price ($3k rent vs $230k).
- Recommended offer: $202k (12.0% below list) — sets the bar for market timing.
Location & tenants
- Location reads 73/100 on livability (#297 in FL) — a middle-class / working-renter tenant base. Strengths: cost of living A+, housing A+, health & safety A; Watch: employment D+, schools D-, amenities F.
- Palm Beach (suburban): math 46% / reading 53% proficiency, ranked #34 of 73 in FL (top 47%) — families likely to look elsewhere, expect single-tenant / working-renter base with shorter leases.
- Market conditions: Rents soft (-2.5%/yr); 274 active listings in the ZIP; 40 comparable units currently listed for rent nearby; rentals at typical pace (median 21d on market — plan ~3-4 weeks tenant-placement turnaround); 3,974 units permitted in Palm Beach County in 2024 (1,012 in 5+ unit buildings).
- At $2,523/mo this rent would consume 49% of the median local household income ($62k/yr) (locally 2663% of renters already pay >50% of income on rent) — very limited rent-growth headroom before tenants either downsize or default.
Forward outlook
- Local home prices are declining (-3.0%/yr); year-one equity from $2k of loan paydown is wiped out by about $7k of value loss. Plan a longer hold.
- Palm Beach County population projected at +30% by 2050 — long-run rental-demand tailwind backs the buy-and-hold thesis.
Negotiation context
- It's been on market 211 days — a 12% lower offer ($202k) is reasonable based on typical stale-listing flexibility.
Risks & watch-outs
- Watch-outs: HOA is 58% of rent.
- Climate carrying-cost: severe wind risk, 99% chance of damaging wind over 30y; extreme-heat days projected 7→25/yr by 2055 (HVAC capex compounding) — expect insurance premiums to compound above CPI over the hold.
Questions for the listing agent
- What do current leases actually rent for vs. the listed asking? Can we see a recent rent roll and the last 12 months of T-12 income?
- It's been on market 211 days. Have you received any prior offers? Is the seller open to a 12% concession, seller financing, or rate buy-down credit?
- What does the HOA fee cover, when was the last increase, and are there any pending special assessments or reserve-fund shortfalls?
- Any open or pending special assessments — roof, HVAC, plumbing, elevator, façade? What's the per-unit balance and payoff schedule, and is the seller paying it off at close or rolling it to the buyer?
- Why hasn't it sold? Are there any deal-killer items the seller is aware of (foundation, flood, title, zoning, code violations)?
- Is there a deadline driving the sale (1031 exchange, divorce, estate, relocation)? That informs how much negotiation room exists.
- Schools are D-rated, which usually means shorter tenancies and higher turnover. Who's the typical renter profile here, and what's been the actual vacancy rate?
- The area grade is low — what's the realistic commute time and amenity access for the typical tenant pool here? Any planned neighborhood developments (good or bad) we should know about?
- What's the average days-on-market for RENTAL listings here right now (not sales)? A rising rental-DOM trend means longer vacancies and softer asking-rent achievability than the comps imply.
- What's the recent tenant-quality profile in this submarket — average credit score on applications, eviction rate, late-payment / NSF rate, and stable-employment percentage? A property-management company in the area should have these aggregated.
- How much new apartment / multifamily construction is in the pipeline within 1–3 miles? Heavy new supply (>2% of stock underway) typically softens rents 12–24 months out; light construction supports rent growth.
Investment metrics
- 1% rule
- 1.10% ✓
- Cap rate
- 0.78%
- Cash-on-cash
- -19.70%
- DSCR
- 0.12
- GRM
- 7.6
CMA / ARV
No comps found within radius.
Projected returns pro-forma
-3.0% appreciation · 0.0% rent growth · sell at horizon
- IRR
- -66.0%
- Equity multiple
- -0.72×
- Total profit
- $-111,068
- Equity at exit
- $34,294
- IRR
- —
- Equity multiple
- -2.23×
- Total profit
- $-208,200
- Equity at exit
- $19,886
Cash invested: $64,400 (down + closing). Projections, not guarantees.
Landlord ↔ Tenant lean methodology
- Overall (STATE)
- 87 Strongly Landlord-Friendly
- State Florida
- 87 Strongly Landlord-Friendly · R+3
- County
- — inherits STATE
- City
- — inherits STATE
ZIP-level market 33461
- Rents YoY
- -2.5%
- Active inventory
- 274
- Price-to-rent
- 7.6×
Monthly cashflow live
- Estimated rent
- $2,523 high interval (Pro) →
- Mortgage (P&I)
- −$1,206
- Tax est. 1.5%
- −$288 /mo · $3,450/yr
- Insurance
- −$96
- HOA est. from 1 same-building comp
- −$1,461
- Vacancy / Maint / Mgmt
- −$530
- Net cashflow
- $-1,057
Break-even live
UW: 25.0% down · 7.5% · 30yr · 1.5% tax · 5.0% vac · 8.0% maint · 8.0% mgmt
Financing live
Cash to close
- Down payment
- $57,500
- Closing costs
- $6,900
- Reserves months
- —
- Total cash needed
- —
Loan-product check · same deal, 3 products live
Conventional
25% down · 7.5% · 30yr
- Down + closing
- —
- Monthly P&I
- —
- Monthly cashflow
- —
- DSCR
- —
- Eligible?
- —
Personal DTI + credit; lowest rate.
DSCR
20% down · 8.5% · 30yr
- Down + closing
- —
- Monthly P&I
- —
- Monthly cashflow
- —
- DSCR
- —
- Eligible?
- —
No personal income docs; deal must DSCR.
Hard money
10% down · 12.0% · 12mo
- Down + closing
- —
- Monthly P&I
- —
- Monthly cashflow
- —
- DSCR
- —
- Eligible?
- —
Short-term bridge; refi at stabilization.
Rent comps 40 comps
| Address | Beds | Baths | Sqft | Rent | $/sqft | DOM | Units | Dist |
|---|---|---|---|---|---|---|---|---|
| 100 Williams Ct Unit 120WL Palm Springs, FL | 3.0 | 2.5 | 1700 | $2,400 | $1.41 | 17d | 1 | 0.07mi |
| 113 Hemingway Ct Palm Springs, FL | 3.0 | 2.5 | 1498 | $2,400 | $1.60 | 20d | 1 | 0.09mi |
| 100 Hemingway Ct Palm Springs, FL | 3.0 | 2.5 | 1498 | $2,400 | $1.60 | 5d | 1 | 0.09mi |
| 120 Williams Ct Palm Springs, FL | 3.0 | 2.5 | 1498 | $2,400 | $1.60 | 17d | 1 | 0.09mi |
| 6003 Waterview Cir Palm Springs, FL | 3.0 | 2.5 | 1500 | $2,550 | $1.70 | 24d | 1 | 0.27mi |
| 1020 Manor Dr Palm Springs, FL | 2.0 | 2.0 | 1098 | $2,200 | $2.00 | 22d | 1 | 0.35mi |
| 1016 Manor Dr Unit 5c Palm Springs, FL | 2.0 | 2.0 | 1098 | $2,256 | $2.05 | 24d | 1 | 0.35mi |
| 1065 Manor Dr Palm Springs, FL | 2.0 | 2.0 | 1098 | $2,100 | $1.91 | 3d | 1 | 0.39mi |
| 3533 Joshua Tree St Lake Worth, FL | 3.0 | 2.5 | 1485 | $2,575 | $1.73 | 24d | 1 | 0.43mi |
| 3537 Joshua Tree St Lake Worth, FL | 3.0 | 2.5 | 1485 | $2,550 | $1.72 | 14d | 1 | 0.43mi |
| 4026 Hot Springs Ave Lake Worth, FL | 3.0 | 2.5 | 1485 | $2,585 | $1.74 | 24d | 1 | 0.44mi |
| 4234 Emerald Vis Lake Worth, FL | 3.0 | 2.5 | 1674 | $2,695 | $1.61 | 24d | 1 | 0.49mi |
| 4234 Emerald Vis Lake Worth, FL | 3.0 | 2.5 | 1674 | $2,650 | $1.58 | 18d | 1 | 0.49mi |
| 3421 Helena Dr Lake Worth, FL | 4.0 | 2.0 | 2100 | $4,400 | $2.10 | 11d | 1 | 0.68mi |
| 4171 Gulfstream Rd Lake Worth, FL | 3.0 | 2.5 | 1194 | $2,700 | $2.26 | 24d | 1 | 0.68mi |
| 4393 Davis Rd Unit 2 Lake Worth Beach, FL | 4.0 | 2.0 | 1222 | $3,200 | $2.62 | 22d | 1 | 0.68mi |
| 4217 Gulfstream Rd Lake Worth Beach, FL | 3.0 | 2.5 | 1528 | $2,850 | $1.87 | 4d | 1 | 0.73mi |
| 4217 Gulfstream Rd Lake Worth Beach, FL | 3.0 | 2.5 | 1528 | $2,850 | $1.87 | 3d | 1 | 0.73mi |
| 4495 Emerald Vis Lake Worth, FL | 1.0–3.0 | 1.0–2.0 | 1164 | $3,559 | $3.06 | 1d | 1 | 0.73mi |
| 4495 Emerald Vis Lake Worth, FL | 3.0 | 3.0 | 1610 | $3,055 | $1.90 | 20d | 1 | 0.73mi |
| 4495 Emerald Vis Lake Worth, FL | 2.0 | 2.0 | 1079 | $2,343 | $2.17 | 4d | 1 | 0.73mi |
| 3733 Kirk Rd Lake Worth, FL | 2.0 | 1.0 | 1170 | $2,350 | $2.01 | 22d | 1 | 0.78mi |
| 4094 Kirk Rd Lake Worth, FL | 2.0 | 1.5 | 1575 | $2,100 | $1.33 | 24d | 1 | 0.80mi |
| 2425 2nd Ave N Lake Worth, FL | 4.0 | 2.5 | 1252 | $2,850 | $2.28 | 24d | 2 | 0.88mi |
| 4063 Belle Rd Unit B Lake Worth Beach, FL | 2.0 | 1.0 | 1200 | $1,900 | $1.58 | 15d | 1 | 0.90mi |
| 3201 Alice Dr Palm Springs, FL | 3.0 | 2.0 | 1966 | $3,650 | $1.86 | 24d | 1 | 0.98mi |
| 4260 Lakewood Rd Unit 206 Lake Worth Beach, FL | 3.0 | 2.0 | 1100 | $2,350 | $2.14 | 14d | 1 | 1.03mi |
| 4260 Lakewood Rd Unit 302 Lake Worth Beach, FL | 2.0 | 2.0 | 1100 | $2,200 | $2.00 | 14d | 1 | 1.03mi |
| 4270 Lakewood Rd Unit 308 Lake Worth Beach, FL | 3.0 | 2.0 | 1100 | $2,350 | $2.14 | 14d | 1 | 1.05mi |
| 4290 Lakewood Rd Unit 107 Lake Worth Beach, FL | 2.0 | 2.0 | 1100 | $2,200 | $2.00 | 14d | 1 | 1.05mi |
| 4250 Lakewood Rd Unit 101 Lake Worth Beach, FL | 2.0 | 2.0 | 1100 | $2,150 | $1.95 | 24d | 1 | 1.05mi |
| 3868 Patio Ct #5 Lake Worth, FL | 3.0 | 2.5 | 1446 | $2,850 | $1.97 | 18d | 1 | 1.09mi |
| 2668 Garden Dr N #312 Lake Worth, FL | 2.0 | 2.0 | 1080 | $1,500 | $1.39 | 1d | 1 | 1.11mi |
| 2668 Garden Dr N #312 Lake Worth, FL | 2.0 | 2.0 | 1080 | $1,500 | $1.39 | 4d | 1 | 1.11mi |
| 2391 Waterside Dr Unit 22d Lake Worth, FL | 2.0 | 3.0 | 1328 | $2,600 | $1.96 | 24d | 1 | 1.13mi |
| 3125 Shelby Way Palm Springs, FL | 3.0 | 2.0 | 1408 | $3,000 | $2.13 | 20d | 1 | 1.15mi |
| 3194 Prince Dr Unit 3196 Lake Worth Beach, FL | 3.0 | 2.0 | 1736 | $2,800 | $1.61 | 15d | 1 | 1.15mi |
| 2428 Waterside Dr Unit 2428 Lake Worth Beach, FL | 2.0 | 2.5 | 1400 | $2,250 | $1.61 | 24d | 1 | 1.18mi |
| 4400 Boatman St Unit 4400 Lake Worth Corridor, FL | 3.0 | 2.5 | 1680 | $2,890 | $1.72 | 24d | 1 | 1.19mi |
| 4400 Boatman St Lake Worth, FL | 3.0 | 3.0 | 1944 | $2,890 | $1.49 | 22d | 1 | 1.19mi |
HOA detail condo
- Monthly dues
- $0 · $0/yr
- Likely covers
- poolparking
- Assessments
- None detected in remarks — confirm with the listing agent.
Listing history 7 events
-
2026-06-09days on market $230,000 Active 211 DOM
-
2026-06-07days on market $230,000 Active 209 DOM
-
2026-06-04days on market $230,000 Active 206 DOM
-
2026-06-03days on market $230,000 Active 205 DOM
-
2026-06-01days on market $230,000 Active 203 DOM
-
2026-05-31days on market $230,000 Active 202 DOM
-
2025-11-10$230,000 Active
ⓘ Source: listings_history table (triggers on properties + properties_extension) + one-shot
backfill from property_details.listing_events for pre-trigger history.
Climate risk First Street
- Flood 1/10 Low FEMA zone X (unshaded) · 0% chance over 30 yrs
- Wildfire 1/10 Low
- Heat 9/10 Extreme 7 d/yr ≥105°F today · 25 d/yr by 30 yrs out
- Wind 10/10 Extreme 99% chance of damaging wind over 30 yrs
- Air quality 2/10 Low 0 unhealthy d/yr today · 2 by 30 yrs out
Nearby sold comps map
Loading sold comps map…
Walkable amenities ~0.75 mi
Loading nearby amenities…
Taxation est. · year 1
- Rental income
- $30,276
- − Mortgage interest
- −$12,884
- − Property taxes
- −$3,450
- − Insurance
- −$1,150
- − Repairs & maintenance
- −$2,422
- − Management
- −$2,422
- − HOA
- −$17,532
- − Depreciation
- −$6,691
- Taxable loss
- −$16,275
- Est. tax savings @ 24.0%
- +$3,906
- After-tax cash flow
- $-8,782/yr
For passive investors: Depreciation is non-cash, so a rental often shows a tax loss while cash-flowing — sheltering income. Rental losses are passive: they offset passive income freely, and up to $25,000/yr can offset ordinary (W-2) income if you actively participate and your MAGI is under $100k (phasing out to $0 by $150k); unused losses carry forward. On sale, claimed depreciation is recaptured at up to 25%, and gains may owe capital-gains tax (a 1031 exchange can defer both). Figures are a year-1 estimate at your 24.0% rate — not tax advice; consult a CPA.
Schools (NCES district)
- District
- Palm Beach
- NCES district ID
- 1201500
- Math proficiency
- 46% ▼ -16.00%
- Reading proficiency
- 53% ▼ -4.00%
- Median HH income
- $53,943
- Composite
- 42.72/100
- National rank
- #3160
- State rank
- #34 of 73 in FL
Livability — Palm Springs
- Score
- 73/100
- State rank
- #297
- US rank
- #5045
Category grades
Schools grade is shown separately in the Schools card above.
Census & demographics
- Census place
- Palm Springs, FL
- County
- Palm Beach County · 1,438,312 people
- City population
- 49,443
- Metro
- Miami-Fort Lauderdale-Pompano Beach, FL
- Population (ZIP)
- 49,443
- Household income
- $61,963
- Rent vs Own
- Severe rent burden
- 2663.0
Population outlook (Palm Beach County) Hauer SSP2
- Today (2025)
- 1,637,487 people
- By 2030
- 1,743,255 · +6.5%
- By 2040
- 1,948,712 · +19.0%
- By 2050
- 2,132,979 · +30.3%
- By 2075
- 2,530,027 · +54.5%
- By 2100
- 2,706,979 · +65.3%
Race, ethnicity, and origin ACS 2023
- Neighborhood character
- Diverse neighborhood (Simpson 0.59)
- Race & ethnicity
- Hispanic / Latino 59% Two or more races 26% White 20% Black 17% Asian 2%
- Hispanic origin (detail)
- Mexican 11% Puerto Rican 6% Cuban 16% Dominican 2%
- Common ancestry
- Hispanic 9% Romanian 1% Lithuanian 1%
- Foreign-born
- 52% · Canada, Jamaica
- Languages at home
- 31% English-only · Spanish 54% French/Haitian/Cajun 10% Other Indo-European 2%
Political lean MEDSL · Palm Beach
- 2024 margin
- Toss-up / Even · D 50.0% · R 49.2%
- 2008→2024 swing
- -22.1pp toward R · 2008: 22.9pp · 2024: 0.8pp
- All cycles
- 2024: D+0.8 2020: D+12.8 2016: D+15.3 2012: D+17.0 2008: D+22.9
Not yet ingested
- Civics
- —
Market trends
- HPI YoY
- ▼ -269.03%
- Current HPI
- 493.0041
- Rent YoY
- ▼ -2.47%
- Metro
- Miami-Fort Lauderdale-Pompano Beach, FL
- State GDP YoY
- ▲ 3.28%
- F500 in state
- 36
Industry mix (Fortune 500 HQ in FL)
| Industry | F500 HQs | Revenue |
|---|---|---|
| Industrial Technology | 2 | $29B |
|
||
| Insurance | 2 | $17B |
|
||
| Retail | 1 | $60B |
|
||
| Technology Distribution | 1 | $58B |
|
||
| Homebuilding | 1 | $35B |
|
||
| Technology Manufacturing | 1 | $35B |
|
||
Price history
1 event — show timeline
- 2025-11-10 Listed $230,000 ForSaleByOwner.com
Cash-flow waterfall
monthlySold comps — $/sqft
last 12 mo · ≤1 miLoading sold comps…