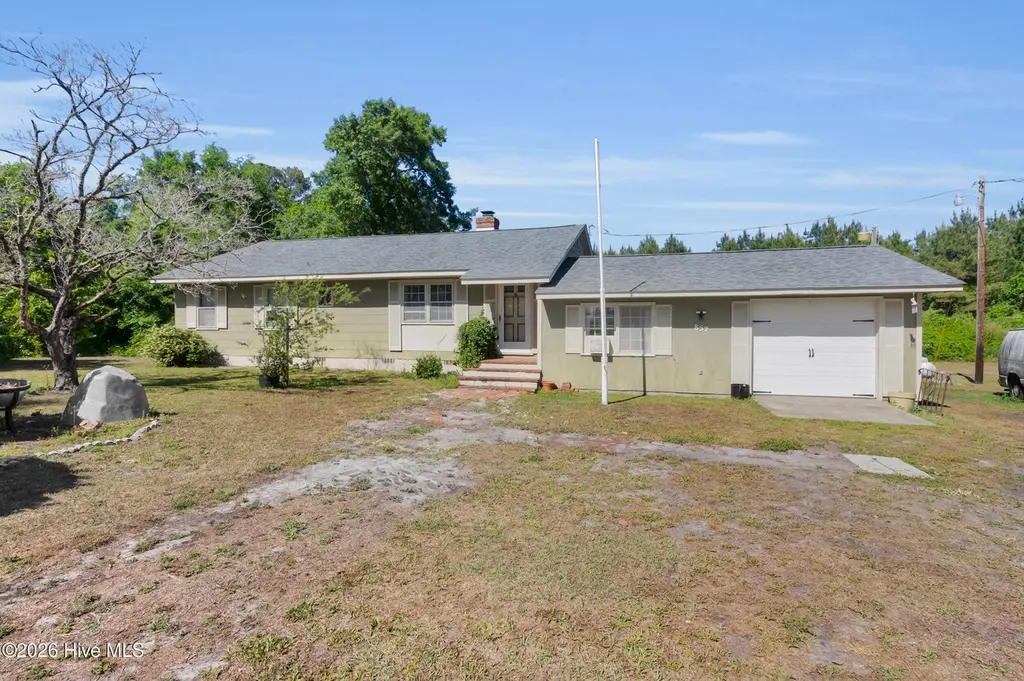
852 Chatham St · Newport, NC
Flood risk 1/10 · Minimal
- FEMA flood zone
- X (unshaded)
- Chance of flooding over 30 yrs
- 0.0%
- Est. flood insurance / yr
- $507 – $1,088
Fire risk 6/10 · Moderate
- Est. fire insurance / yr
- $906 – $1,684
Heat risk 9/10 · Severe
- Hot days now (above 103°F)
- 7 days/yr
- Hot days in 30 yrs
- 21 days/yr
Wind risk 8/10 · Major
- Chance of severe wind over 30 yrs
- 99.0%
Air-quality risk 1/10 · Minimal
- Unhealthy air days now
- 0 days/yr
- Unhealthy air days in 30 yrs
- 0 days/yr
Risk factors via First Street. Map © Google.
Why this score? — see what drove the D+ grade
The composite is a weighted blend of 9 inputs, each scored 0–100. Each bar is that input's sub-score; the figure is the points it added to the 100-point composite (weight × sub-score).
- Cash flow +15.0/30.0
- ARV discount +7.5/15.0
- Schools +5.1/10.0
- 1% rule +5.0/10.0
- DSCR +5.0/10.0
- Livability +3.2/5.0
- Rent growth +2.5/5.0
- Condition / age +2.5/5.0
- Appreciation +0.0/10.0
$235,000
🖨 Deal sheet 📄 Offer letter ✓ Due diligence
Listing remarks
Step into a home filled with decades of cherished memories, where generations gathered, grandchildren played, and a large family built a lifetime of love. This one-of-a-kind property is truly a diamond in the rough, offering over 1,700 square feet of opportunity for the right buyer with vision and creativity. Rich with character, this home features timeless solid wood paneling, unique built-ins, and classic architectural accents that reflect the craftsmanship of its era. Situated on a spacious large yard with no HOA, this property provides endless potential to completely remodel and transform into your dream home while preserving its original charm. Conveniently located close to Morehead Ci
Key facts
- Solid wood paneling
- Large yard
- Unique built-ins
Tags
Property features AI
Exterior
- Parking: 1 parking space; Attached 1-car garage; On-site gravel/unpaved parking
- Utilities: Well water; Septic tank; Other utilities
- Home design: Single-family residence; One story; Entry level: 1; Residential zoning (RP)
- Construction: Frame construction with asbestos siding; Block foundation; Built with a shingle roof
- Exterior features: Porch; Shingle roof; No exterior fencing noted; Property has a view
Interior
- Kitchen: Refrigerator; Gas range
- Bedrooms: Master downstairs
- Flooring: Carpet; Vinyl
- Bathrooms: 2 full bathrooms
- Heating & cooling: Baseboard heating; Electric heating; Heat pump; Central air; Wall/window unit(s)
- Interior features: Master suite on the main level; High ceilings; Ceiling fans; Built-in features; Crawl space (no basement)
- Laundry & utility: Washer hookup; Gas water heater
Neighborhood map
What this means for you Summary
Snapshot
- This is a 2-bed/1.0-bath other listed at $235k.
Deal economics
- At list price, monthly cash flow is $7k ($79k/yr) — positive.
- The deal already cash-flows at list — no discount required.
- Meets the 1% rule at list price ($10k rent vs $235k).
- Recommended offer: $228k (3.0% below list) — sets the bar for market timing.
- Cap rate 40.1% vs local median 31.4% in Newport — meaningfully above typical; check what's discounted (condition, days-on-market, listing class) to confirm the premium yield is real.
Location & tenants
- Location reads 63/100 on livability (#385 in NC) — a middle-class / working-renter tenant base. Strengths: cost of living A+, housing A+; Watch: employment C-, amenities F, commute F.
- Carteret County Public Schools (rural): math 59% / reading 61% proficiency, ranked #31 of 178 in NC (top 17%) — acceptable for families but not a draw, mixed tenant base, ~2y average lease.
- Zoned schools: Newport Elementary (math 48% / reading 45%, grade D-, #542 of 1,410 statewide, top 39%, 645 students, 100% FRL); Newport Middle (math 39% / reading 56%, grade C-, #140 of 475 statewide, top 30%, 378 students, 98% FRL); West Carteret High (math 82% / reading 71%, grade A-, #89 of 535 statewide, top 16%, 1,146 students, 40% FRL) — zoned schools average 79% FRL vs 39% district-wide (40 pts higher); higher-poverty schools than district average — tighter screening recommended.
- Market conditions: 216 active listings in the ZIP; 935 units permitted in Carteret County in 2024 (360 in 5+ unit buildings).
- At $10,139/mo this rent would consume 173% of the median local household income ($70k/yr) (locally 461% of renters already pay >50% of income on rent) — very limited rent-growth headroom before tenants either downsize or default.
Forward outlook
- Local home prices are declining (-3.0%/yr); year-one equity from $2k of loan paydown is wiped out by about $7k of value loss. Plan a longer hold.
- Carteret County population projected at +9% by 2050 — modest demand growth; plan on rents tracking national, not racing it.
- At projected returns (-3.0% appreciation + 3.0% rent growth), your $66k cash investment doubles in ~1 year — after that, you're playing with house money.
Negotiation context
- It's been on market 47 days — a 3% lower offer ($228k) is reasonable based on typical stale-listing flexibility.
Risks & watch-outs
- Watch-outs: built in 1950 — expect roof / HVAC / electrical / plumbing capex.
- Climate carrying-cost: severe wind risk, 99% chance of damaging wind over 30y; major wildfire risk; extreme-heat days projected 7→21/yr by 2055 (HVAC capex compounding) — expect insurance premiums to compound above CPI over the hold.
Questions for the listing agent
- It's been on market 47 days. Have you received any prior offers? Is the seller open to a 3% concession, seller financing, or rate buy-down credit?
- Built in 1950 — when were the roof, HVAC, electrical panel, plumbing, and water heater last replaced?
- Is there a deadline driving the sale (1031 exchange, divorce, estate, relocation)? That informs how much negotiation room exists.
- The area grade is low — what's the realistic commute time and amenity access for the typical tenant pool here? Any planned neighborhood developments (good or bad) we should know about?
- What's the average days-on-market for RENTAL listings here right now (not sales)? A rising rental-DOM trend means longer vacancies and softer asking-rent achievability than the comps imply.
- What's the recent tenant-quality profile in this submarket — average credit score on applications, eviction rate, late-payment / NSF rate, and stable-employment percentage? A property-management company in the area should have these aggregated.
- How much new for-sale + rental construction is in the pipeline within 1–3 miles? Heavy new supply typically softens prices + rents 12–24 months out; constrained supply supports both.
Investment metrics
- 1% rule
- 4.31% ✓
- Cap rate
- 40.06%
- Cash-on-cash
- 120.59%
- DSCR
- 6.37
- GRM
- 1.9
CMA / ARV
No comps found within radius.
Projected returns pro-forma
-3.0% appreciation · 3.0% rent growth · sell at horizon
- IRR
- —
- Equity multiple
- 6.82×
- Total profit
- $383,067
- Equity at exit
- $35,039
- IRR
- —
- Equity multiple
- 14.31×
- Total profit
- $875,900
- Equity at exit
- $20,319
Cash invested: $65,800 (down + closing). Projections, not guarantees.
Landlord ↔ Tenant lean methodology
- Overall (STATE)
- 85 Strongly Landlord-Friendly
- State North Carolina
- 85 Strongly Landlord-Friendly · R+3
- County
- — inherits STATE
- City
- — inherits STATE
ZIP-level market 28570
- Home prices YoY
- -16.2%
- Active inventory
- 216
- Price-to-rent
- 1.9×
Monthly cashflow live
- Estimated rent
- $10,139 medium interval (Pro) →
- Mortgage (P&I)
- −$1,232
- Tax from tax record
- −$67 /mo · $806/yr
- Insurance
- −$98
- HOA
- −$0
- Vacancy / Maint / Mgmt
- −$2,129
- Net cashflow
- $6,612
Break-even live
UW: 25.0% down · 7.5% · 30yr · 1.5% tax · 5.0% vac · 8.0% maint · 8.0% mgmt
Financing live
Cash to close
- Down payment
- $58,750
- Closing costs
- $7,050
- Reserves months
- —
- Total cash needed
- —
Loan-product check · same deal, 3 products live
Conventional
25% down · 7.5% · 30yr
- Down + closing
- —
- Monthly P&I
- —
- Monthly cashflow
- —
- DSCR
- —
- Eligible?
- —
Personal DTI + credit; lowest rate.
DSCR
20% down · 8.5% · 30yr
- Down + closing
- —
- Monthly P&I
- —
- Monthly cashflow
- —
- DSCR
- —
- Eligible?
- —
No personal income docs; deal must DSCR.
Hard money
10% down · 12.0% · 12mo
- Down + closing
- —
- Monthly P&I
- —
- Monthly cashflow
- —
- DSCR
- —
- Eligible?
- —
Short-term bridge; refi at stabilization.
Listing history 17 events
-
2026-06-19days on market $235,000 Active 47 DOM
-
2026-06-18days on market $235,000 Active 46 DOM
-
2026-06-17days on market $235,000 Active 45 DOM
-
2026-06-16days on market $235,000 Active 44 DOM
-
2026-06-15days on market $235,000 Active 43 DOM
-
2026-06-14days on market $235,000 Active 41 DOM
-
2026-06-12days on market $235,000 Active 40 DOM
-
2026-06-09days on market $235,000 Active 37 DOM
-
2026-06-08days on market $235,000 Active 36 DOM
-
2026-06-07days on market $235,000 Active 35 DOM
-
2026-06-05days on market $235,000 Active 32 DOM
-
2026-06-03days on market $235,000 Active 31 DOM
-
2026-06-02days on market $235,000 Active 30 DOM
-
2026-06-01days on market $235,000 Active 29 DOM
-
2026-05-31days on market $235,000 Active 28 DOM
-
2026-05-30days on market $235,000 Active 27 DOM
-
2026-05-03$235,000 Active
ⓘ Source: listings_history table (triggers on properties + properties_extension) + one-shot
backfill from property_details.listing_events for pre-trigger history.
Tax reassessment forecast NC · Resets to sale price
- Current annual tax
- $806 · $67/mo
- Projected year-2 tax
- $1,927 · $161/mo
- Expected delta
- +$1,121/yr (+$93/mo · 139.1%)
ⓘ Screening estimate from a state-policy table — verify with the county assessor before closing.
Climate risk First Street
- Flood 1/10 Low FEMA zone X (unshaded) · 0% chance over 30 yrs
- Wildfire 6/10 Major
- Heat 9/10 Extreme 7 d/yr ≥103°F today · 21 d/yr by 30 yrs out
- Wind 8/10 Severe 99% chance of damaging wind over 30 yrs
- Air quality 1/10 Low 0 unhealthy d/yr today · 0 by 30 yrs out
Nearby sold comps map
Loading sold comps map…
Walkable amenities ~0.75 mi
Loading nearby amenities…
Taxation est. · year 1
- Rental income
- $121,665
- − Mortgage interest
- −$13,164
- − Property taxes
- −$806
- − Insurance
- −$1,175
- − Repairs & maintenance
- −$9,733
- − Management
- −$9,733
- − Depreciation
- −$6,836
- Taxable income
- $80,218
- Est. tax owed @ 24.0%
- −$19,252
- After-tax cash flow
- $60,094/yr
For passive investors: Depreciation is non-cash, so a rental often shows a tax loss while cash-flowing — sheltering income. Rental losses are passive: they offset passive income freely, and up to $25,000/yr can offset ordinary (W-2) income if you actively participate and your MAGI is under $100k (phasing out to $0 by $150k); unused losses carry forward. On sale, claimed depreciation is recaptured at up to 25%, and gains may owe capital-gains tax (a 1031 exchange can defer both). Figures are a year-1 estimate at your 24.0% rate — not tax advice; consult a CPA.
Schools (NCES district)
- District
- Carteret County Public Schools
- NCES district ID
- 3700630
- Math proficiency
- 59% ▲ 5.00%
- Reading proficiency
- 61% ▲ 2.00%
- Median HH income
- $48,330
- Composite
- 50.92/100
- National rank
- #1786
- State rank
- #31 of 178 in NC
Livability — Newport
- Score
- 63/100
- State rank
- #385
- US rank
- #15094
Category grades
Schools grade is shown separately in the Schools card above.
Census & demographics
- County
- Carteret County · 52,389 people
- City population
- 22,197
- Metro
- Morehead City, NC
- Population (ZIP)
- 22,197
- Household income
- $70,229
- Rent vs Own
- Severe rent burden
- 461.0
Population outlook (Carteret County) Hauer SSP2
- Today (2025)
- 73,443 people
- By 2030
- 75,344 · +2.6%
- By 2040
- 78,142 · +6.4%
- By 2050
- 80,091 · +9.1%
- By 2075
- 86,120 · +17.3%
- By 2100
- 89,408 · +21.7%
Race, ethnicity, and origin ACS 2023
- Neighborhood character
- Predominantly White (82%)
- Race & ethnicity
- White 82% Hispanic / Latino 7% Two or more races 6% Black 3% Asian 1%
- Hispanic origin (detail)
- Mexican 4%
- Common ancestry
- Slovak 3% Romanian 3% Lithuanian 2%
- Foreign-born
- 5% · Canada, Dominican Republic
- Languages at home
- 92% English-only · Spanish 6% German/W. Germanic 1%
Political lean MEDSL · Carteret
- 2024 margin
- Solid R (+43.1) · D 28.0% · R 71.1%
- 2008→2024 swing
- -8.4pp toward R · 2008: -34.7pp · 2024: -43.1pp
- All cycles
- 2024: R+43.1 2020: R+42.0 2016: R+44.5 2012: R+41.0 2008: R+34.7
Not yet ingested
- Civics
- —
Market trends
- HPI YoY
- ▼ -53.54%
- Current HPI
- 276.6589
- Rent YoY
- —
- Metro
- Morehead City, NC
- State GDP YoY
- ▲ 3.28%
- F500 in state
- 26
Industry mix (Fortune 500 HQ in NC)
| Industry | F500 HQs | Revenue |
|---|---|---|
| Financial Services | 2 | $213B |
|
||
| Retail | 2 | $95B |
|
||
| Industrial Conglomerate | 1 | $38B |
|
||
| Metals / Steel | 1 | $35B |
|
||
| Utilities | 1 | $30B |
|
||
| Industrial Machinery | 1 | $19B |
|
||
Price history
1 event — show timeline
- 2026-05-03 Listed $235,000 Hive MLS
Property tax history
+0.6%/yrLatest (2025): $806 · +11.0% YoY. Source: county tax records.
Cash-flow waterfall
monthlySold comps — $/sqft
last 12 mo · ≤1 miLoading sold comps…