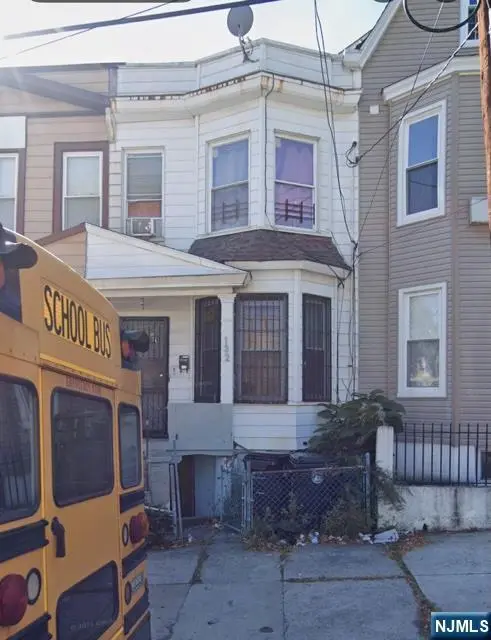
132 Chester Ave · Newark, NJ
Flood risk 1/10 · Minimal
- FEMA flood zone
- X (unshaded)
- Chance of flooding over 30 yrs
- 0.0%
- Est. flood insurance / yr
- $507 – $1,088
Fire risk 1/10 · Minimal
- Est. fire insurance / yr
- $526 – $976
Heat risk 7/10 · Major
- Hot days now (above 99°F)
- 7 days/yr
- Hot days in 30 yrs
- 15 days/yr
Wind risk 6/10 · Moderate
- Chance of severe wind over 30 yrs
- 27.0%
Air-quality risk 4/10 · Minor
- Unhealthy air days now
- 3 days/yr
- Unhealthy air days in 30 yrs
- 5 days/yr
Risk factors via First Street. Map © Google.
Why this score? — see what drove the B- grade
The composite is a weighted blend of 9 inputs, each scored 0–100. Each bar is that input's sub-score; the figure is the points it added to the 100-point composite (weight × sub-score).
- Cash flow +30.0/30.0
- DSCR +10.0/10.0
- 1% rule +8.0/10.0
- ARV discount +7.5/15.0
- Rent growth +3.8/5.0
- Livability +3.4/5.0
- Condition / age +2.5/5.0
- Schools +1.4/10.0
- Appreciation +0.0/10.0
$265,000
🖨 Deal sheet 📄 Offer letter ✓ Due diligence
Listing remarks MLS
Great price for a non condo option. 3 bed 1 bath, 1/2 duplex home, Hardwood floors.. Charming home.. a must see
Key facts
- Listed 40 days
Property features AI
Finance
- Financial info: Annual tax amount: $1,956
Exterior
- Home design: Residential duplex
- Construction: Aluminum siding
- Exterior features: No pool
Interior
- Bedrooms: Total of 6 rooms (bedroom count not specified)
- Bathrooms: 1 full bathroom
- Heating & cooling: Baseboard heating; Natural gas heating; No central cooling
- Interior features: No fireplace; Unfinished basement
Neighborhood map
What this means for you Summary
Snapshot
- This is a 6-bed/2.0-bath single-family listed at $265k.
Deal economics
- At list price, monthly cash flow is $1k ($13k/yr) — positive.
- The deal already cash-flows at list — no discount required.
- Meets the 1% rule at list price ($3k rent vs $265k).
- Recommended offer: $257k (3.0% below list) — sets the bar for market timing.
- Cap rate 11.1% vs local median 3.0% in Newark — top-decile yield for the area; either an underpriced asset or a hidden risk that comps aren't pricing in. Stress-test before assuming the spread holds.
Location & tenants
- Location reads 67/100 on livability (#343 in NJ) — a middle-class / working-renter tenant base. Strengths: commute A+, amenities A-; Watch: schools D+, housing D+, crime F.
- Newark Public School District (urban): math 9% / reading 26% proficiency, ranked #452 of 472 in NJ (top 96%) — low school quality limits family demand, transient renter base, plan for 1-2y turnover; 79% free/reduced lunch — lower-income household profile, screen leases tightly.
- Market conditions: Rents rising fast (+5.2%/yr); 51 active listings in the ZIP; 2 comparable units currently listed for rent nearby; 3,364 units permitted in Essex County in 2024 (2,551 in 5+ unit buildings).
- At $3,451/mo this rent would consume 77% of the median local household income ($54k/yr) (locally 4024% of renters already pay >50% of income on rent) — very limited rent-growth headroom before tenants either downsize or default.
Forward outlook
- Local home prices are declining (-3.0%/yr); year-one equity from $2k of loan paydown is wiped out by about $8k of value loss. Plan a longer hold.
- Essex County population projected at +3% by 2050 — modest demand growth; plan on rents tracking national, not racing it.
- At projected returns (-3.0% appreciation + 5.2% rent growth), your $74k cash investment doubles in ~7 years — after that, you're playing with house money.
Negotiation context
- It's been on market 41 days — a 3% lower offer ($257k) is reasonable based on typical stale-listing flexibility.
- 2 sale attempts with the ask held roughly flat each time — persistent listings suggest the price (not the market) is what's stuck; bring a comps-based counter.
- Current owner paid $136k; list at $265k implies a 94% gain — meaningful room to come down on a strong offer.
Risks & watch-outs
- Watch-outs: built in 1890 — expect roof / HVAC / electrical / plumbing capex.
- Climate carrying-cost: major wind risk, 27% chance of damaging wind over 30y; extreme-heat days projected 7→15/yr by 2055 (HVAC capex compounding) — expect insurance premiums to compound above CPI over the hold.
Questions for the listing agent
- It's been on market 41 days. Have you received any prior offers? Is the seller open to a 3% concession, seller financing, or rate buy-down credit?
- Built in 1890 — when were the roof, HVAC, electrical panel, plumbing, and water heater last replaced?
- Is there a deadline driving the sale (1031 exchange, divorce, estate, relocation)? That informs how much negotiation room exists.
- Schools are D-rated, which usually means shorter tenancies and higher turnover. Who's the typical renter profile here, and what's been the actual vacancy rate?
- Crime grade is F in this area — have there been break-ins, vandalism, or insurance claims at this property in the last 3 years? What carrier currently insures it and at what premium?
- What's the average days-on-market for RENTAL listings here right now (not sales)? A rising rental-DOM trend means longer vacancies and softer asking-rent achievability than the comps imply.
- What's the recent tenant-quality profile in this submarket — average credit score on applications, eviction rate, late-payment / NSF rate, and stable-employment percentage? A property-management company in the area should have these aggregated.
- How much new for-sale + rental construction is in the pipeline within 1–3 miles? Heavy new supply typically softens prices + rents 12–24 months out; constrained supply supports both.
Investment metrics
- 1% rule
- 1.30% ✓
- Cap rate
- 11.11%
- Cash-on-cash
- 17.19%
- DSCR
- 1.76
- GRM
- 6.4
CMA / ARV
No comps found within radius.
Projected returns pro-forma
-3.0% appreciation · 5.15% rent growth · sell at horizon
- IRR
- 10.8%
- Equity multiple
- 1.44×
- Total profit
- $32,340
- Equity at exit
- $39,512
- IRR
- 21.4%
- Equity multiple
- 2.99×
- Total profit
- $147,833
- Equity at exit
- $22,912
Cash invested: $74,200 (down + closing). Projections, not guarantees.
Landlord ↔ Tenant lean methodology
- Overall (CITY)
- 0 Strongly Tenant-Friendly
- State New Jersey
- 21 Tenant-Leaning · D+6
- County
- — inherits STATE
- City Newark
- 0 Strongly Tenant-Friendly · D+59
ZIP-level market 07104
- Home prices YoY
- -28.7%
- Rents YoY
- 5.2%
- Active inventory
- 51
- Price-to-rent
- 6.4×
Monthly cashflow live
- Estimated rent
- $3,451 medium interval (Pro) →
- Mortgage (P&I)
- −$1,390
- Tax from tax record
- −$163 /mo · $1,956/yr
- Insurance
- −$110
- HOA
- −$0
- Vacancy / Maint / Mgmt
- −$725
- Net cashflow
- $1,063
Break-even live
UW: 25.0% down · 7.5% · 30yr · 1.5% tax · 5.0% vac · 8.0% maint · 8.0% mgmt
Financing live
Cash to close
- Down payment
- $66,250
- Closing costs
- $7,950
- Reserves months
- —
- Total cash needed
- —
Loan-product check · same deal, 3 products live
Conventional
25% down · 7.5% · 30yr
- Down + closing
- —
- Monthly P&I
- —
- Monthly cashflow
- —
- DSCR
- —
- Eligible?
- —
Personal DTI + credit; lowest rate.
DSCR
20% down · 8.5% · 30yr
- Down + closing
- —
- Monthly P&I
- —
- Monthly cashflow
- —
- DSCR
- —
- Eligible?
- —
No personal income docs; deal must DSCR.
Hard money
10% down · 12.0% · 12mo
- Down + closing
- —
- Monthly P&I
- —
- Monthly cashflow
- —
- DSCR
- —
- Eligible?
- —
Short-term bridge; refi at stabilization.
Rent comps 2 comps
| Address | Beds | Baths | Sqft | Rent | $/sqft | DOM | Units | Dist |
|---|---|---|---|---|---|---|---|---|
| 33 Springdale Ave Unit 1 Newark, NJ | 7.0 | 2.0 | 1200 | $3,495 | $2.91 | 24d | 1 | 1.24mi |
| 33 Springdale Ave Unit 1 Newark, NJ | 7.0 | 2.0 | 1200 | $3,495 | $2.91 | 17d | 1 | 1.24mi |
Listing history 23 events
-
2026-06-18days on market $265,000 Active 41 DOM
-
2026-06-17days on market $265,000 Active 40 DOM
-
2026-06-16days on market $265,000 Active 39 DOM
-
2026-06-15days on market $265,000 Active 38 DOM
-
2026-06-13days on market $265,000 Active 36 DOM
-
2026-06-13days on market $265,000 Active 35 DOM
-
2026-06-09days on market $265,000 Active 32 DOM
-
2026-06-08days on market $265,000 Active 31 DOM
-
2026-06-07days on market $265,000 Active 30 DOM
-
2026-06-04days on market $265,000 Active 27 DOM
-
2026-06-03days on market $265,000 Active 26 DOM
-
2026-06-02pricedays on market $265,000 Active 25 DOM
Show marketing remark (112 chars)
Great price for a non condo option. 3 bed 1 bath, 1/2 duplex home, Hardwood floors.. Charming home.. a must see
-
2026-06-01days on market $275,000 Active 24 DOM
-
2026-05-31days on market $275,000 Active 23 DOM
-
2026-05-16$275,000 Active 76-char remark
Show marketing remark (112 chars)
Great price for a non condo option. 3 bed 1 bath, 1/2 duplex home, Hardwood floors.. Charming home.. a must see
-
2026-05-08historical $275,000 76-char remark
Show marketing remark (112 chars)
Great price for a non condo option. 3 bed 1 bath, 1/2 duplex home, Hardwood floors.. Charming home.. a must see
-
2026-05-08$275,000 Active 73-char remark
Show marketing remark (112 chars)
Great price for a non condo option. 3 bed 1 bath, 1/2 duplex home, Hardwood floors.. Charming home.. a must see
-
2020-06-09soldstatus $136,500
-
2013-08-15soldstatus $28,000
-
2013-07-19soldstatus $30,000
-
1997-12-17soldstatus $57,000
-
1994-03-01soldstatus $27,500
-
1985-03-01soldstatus $22,000
ⓘ Source: listings_history table (triggers on properties + properties_extension) + one-shot
backfill from property_details.listing_events for pre-trigger history.
Tax reassessment forecast NJ · Partial reset (capped growth)
- Current annual tax
- $1,956 · $163/mo
- Projected year-2 tax
- $4,277 · $356/mo
- Expected delta
- +$2,321/yr (+$193/mo · 118.7%)
ⓘ Screening estimate from a state-policy table — verify with the county assessor before closing.
Climate risk First Street
- Flood 1/10 Low FEMA zone X (unshaded) · 0% chance over 30 yrs
- Wildfire 1/10 Low
- Heat 7/10 Severe 7 d/yr ≥99°F today · 15 d/yr by 30 yrs out
- Wind 6/10 Major 27% chance of damaging wind over 30 yrs
- Air quality 4/10 Moderate 3 unhealthy d/yr today · 5 by 30 yrs out
Nearby sold comps map
Loading sold comps map…
Walkable amenities ~0.75 mi
Loading nearby amenities…
Taxation est. · year 1
- Rental income
- $41,410
- − Mortgage interest
- −$14,844
- − Property taxes
- −$1,956
- − Insurance
- −$1,325
- − Repairs & maintenance
- −$3,313
- − Management
- −$3,313
- − Depreciation
- −$7,709
- Taxable income
- $8,950
- Est. tax owed @ 24.0%
- −$2,148
- After-tax cash flow
- $10,609/yr
For passive investors: Depreciation is non-cash, so a rental often shows a tax loss while cash-flowing — sheltering income. Rental losses are passive: they offset passive income freely, and up to $25,000/yr can offset ordinary (W-2) income if you actively participate and your MAGI is under $100k (phasing out to $0 by $150k); unused losses carry forward. On sale, claimed depreciation is recaptured at up to 25%, and gains may owe capital-gains tax (a 1031 exchange can defer both). Figures are a year-1 estimate at your 24.0% rate — not tax advice; consult a CPA.
Schools (NCES district)
- District
- Newark Public School District
- NCES district ID
- 3411340
- Math proficiency
- 9% ▼ -17.00%
- Reading proficiency
- 26% ▼ -10.00%
- Median HH income
- $33,891
- Composite
- 14.24/100
- National rank
- #9449
- State rank
- #452 of 472 in NJ
Livability — Newark
- Score
- 67/100
- State rank
- #343
- US rank
- #11138
Category grades
Schools grade is shown separately in the Schools card above.
Census & demographics
- Census place
- Newark, NJ
- County
- Essex County · 825,405 people
- City population
- 310,602
- Metro
- New York-Newark-Jersey City, NY-NJ-PA
- Population (ZIP)
- 52,266
- Household income
- $53,978
- Rent vs Own
- Severe rent burden
- 4024.0
Population outlook (Essex County) Hauer SSP2
- Today (2025)
- 825,042 people
- By 2030
- 834,010 · +1.1%
- By 2040
- 846,221 · +2.6%
- By 2050
- 850,047 · +3.0%
- By 2075
- 837,009 · +1.5%
- By 2100
- 784,345 · -4.9%
Race, ethnicity, and origin ACS 2023
- Neighborhood character
- Predominantly Hispanic (66%)
- Race & ethnicity
- Hispanic / Latino 66% Black 22% Two or more races 19% White 8%
- Hispanic origin (detail)
- Mexican 2% Puerto Rican 29% Cuban 2% Dominican 14%
- Common ancestry
- Estonian 1% Hispanic 1% Russian 1%
- Foreign-born
- 30% · Canada, Jamaica
- Languages at home
- 36% English-only · Spanish 56% Other Indo-European 3% French/Haitian/Cajun 1%
Political lean MEDSL · Essex
- 2024 margin
- Solid D (+44.9) · D 71.7% · R 26.8% · Other 1.5%
- 2008→2024 swing
- -7.7pp toward R · 2008: 52.6pp · 2024: 44.9pp
- All cycles
- 2024: D+44.9 2020: D+55.4 2016: D+56.4 2012: D+55.5 2008: D+52.6
Not yet ingested
- Civics
- —
Market trends
- HPI YoY
- ▼ -128.59%
- Current HPI
- 320.144
- Rent YoY
- ▲ 5.15%
- Metro
- New York-Newark-Jersey City, NY-NJ-PA
- State GDP YoY
- ▲ 2.05%
- F500 in state
- 34
Industry mix (Fortune 500 HQ in NJ)
| Industry | F500 HQs | Revenue |
|---|---|---|
| Consumer Goods | 3 | $31B |
|
||
| Pharmaceuticals | 2 | $153B |
|
||
| Technology | 2 | $21B |
|
||
| Insurance | 2 | $20B |
|
||
| Healthcare | 2 | $19B |
|
||
| Financial Services | 1 | $70B |
|
||
Price history
+1104.5% since first listed11 events — show timeline
- 2026-06-02 Price Changed $265,000 GSMLS
- 2026-06-02 Price Changed $265,000 NJMLS
- 2026-05-16 Listed $275,000 GSMLS
- 2026-05-08 Coming Soon $275,000 GSMLS
- 2026-05-08 Listed $275,000 NJMLS
- 2020-06-09 Sold (Public Records) $136,500 Public Records
- 2013-08-15 Sold (Public Records) $28,000 Public Records
- 2013-07-19 Sold (MLS) $30,000 GSMLS
- 1997-12-17 Sold (Public Records) $57,000 Public Records
- 1994-03-01 Sold (Public Records) $27,500 Public Records
- 1985-03-01 Sold (Public Records) $22,000 Public Records
Property tax history
-1.4%/yrLatest (2025): $1,956 · +5.2% YoY. Source: county tax records.
Cash-flow waterfall
monthlySold comps — $/sqft
last 12 mo · ≤1 miLoading sold comps…