10767 Jamacha Blvd Spc 119 · Spring Valley, CA
Flood risk 1/10 · Minimal
- FEMA flood zone
- X (unshaded)
- Chance of flooding over 30 yrs
- 0.0%
- Est. flood insurance / yr
- $507 – $1,088
Fire risk 7/10 · Major
- Est. fire insurance / yr
- $659 – $1,223
Heat risk 4/10 · Minor
- Hot days now (above 96°F)
- 7 days/yr
- Hot days in 30 yrs
- 19 days/yr
Wind risk 1/10 · Minimal
- Chance of severe wind over 30 yrs
- —
Air-quality risk 3/10 · Minor
- Unhealthy air days now
- 3 days/yr
- Unhealthy air days in 30 yrs
- 3 days/yr
Risk factors via First Street. Map © Google.
Why this score? — see what drove the C+ grade
The composite is a weighted blend of 9 inputs, each scored 0–100. Each bar is that input's sub-score; the figure is the points it added to the 100-point composite (weight × sub-score).
- Cash flow +30.0/30.0
- DSCR +10.0/10.0
- 1% rule +8.8/10.0
- Schools +4.0/10.0
- Livability +3.0/5.0
- Rent growth +2.5/5.0
- Condition / age +2.5/5.0
- ARV discount +0.2/15.0
- Appreciation +0.0/10.0
$249,990
🖨 Deal sheet 📄 Offer letter ✓ Due diligence
Listing remarks
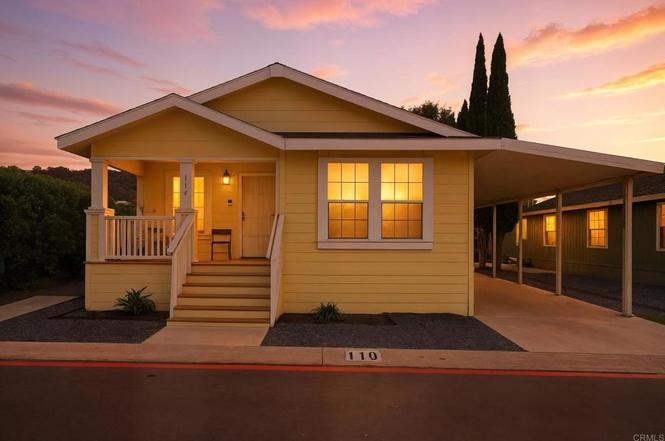
Welcome to 10767 Jamacha Blvd, Space 119, Spring Valley, CA 91978 — a comfortable manufactured home opportunity in a convenient Spring Valley location. This home offers an easy, low-maintenance lifestyle with a functional layout, welcoming living spaces, and the everyday practicality that makes manufactured-home living so appealing. Inside, you’ll find a bright living area that’s ready for relaxing or entertaining, along with a well-sized kitchen that offers plenty of room for cooking and storage. The bedrooms are comfortably proportioned, and the home’s floor plan is designed to make the most of the space—ideal for anyone looking for a streamlined, efficient p
Key facts
- 32.68 acre lot
- Parking
- Community pool
Property features AI
Finance
- Other: Living area and lot size sourced from assessor
- Financial info: Land lease payment listed
- HOA & community: Part of an association; Located in Lamplighter Village (land lease community)
Exterior
- Parking: Carport (1 space)
- Utilities: Location coordinates available (latitude/longitude)
- Home design: Manufactured/mobile home; Single-story; Entry at front door
- Construction: Mobile home dimensions approximately 30' x 80'; Year built reported by assessor
- Exterior features: Community pool; Street lighting; Lot is level/flat
Interior
- Kitchen: Kitchen
- Bedrooms: Primary suite
- Bathrooms: 2 full bathrooms
- Heating & cooling: Central cooling
- Interior features: One-level home; Front door entry; Living room; Primary suite
- Laundry & utility: Dedicated laundry room
Neighborhood map
What this means for you Summary
Snapshot
- This is a 3-bed/2.0-bath manufactured listed at $250k.
Deal economics
- At list price, monthly cash flow is $1k ($15k/yr) — positive.
- The deal already cash-flows at list — no discount required.
- Meets the 1% rule at list price ($3k rent vs $250k).
- Recommended offer: $220k (12.0% below list) — sets the bar for market timing.
- Cap rate 12.3% vs local median 2.9% in Spring Valley — top-decile yield for the area; either an underpriced asset or a hidden risk that comps aren't pricing in. Stress-test before assuming the spread holds.
Location & tenants
- Location reads 59/100 on livability (#627 in CA) — a working-class tenant base; expect higher turnover. Strengths: commute A+, employment A, housing B+; Watch: schools D+, crime F, amenities F.
- Grossmont Union High (suburban): math 31% / reading 60% proficiency, ranked #173 of 517 in CA (top 34%) — families likely to look elsewhere, expect single-tenant / working-renter base with shorter leases; only 17% free/reduced lunch — higher-income household profile.
- Market conditions: 20 active listings in the ZIP; 6 comparable units currently listed for rent nearby; rentals leasing fast (median 2d on market — plan ~1-2 weeks tenant-placement turnaround); 11,759 units permitted in San Diego County in 2024 (7,244 in 5+ unit buildings).
Forward outlook
- Local home prices are declining (-3.0%/yr); year-one equity from $2k of loan paydown is wiped out by about $8k of value loss. Plan a longer hold.
- San Diego County population projected at +20% by 2050 — long-run rental-demand tailwind backs the buy-and-hold thesis.
- At projected returns (-3.0% appreciation + 3.0% rent growth), your $70k cash investment doubles in ~6 years — after that, you're playing with house money.
Negotiation context
- It's been on market 188 days — a 12% lower offer ($220k) is reasonable based on typical stale-listing flexibility.
Risks & watch-outs
- Climate carrying-cost: major wildfire risk — expect insurance premiums to compound above CPI over the hold.
Questions for the listing agent
- It's been on market 188 days. Have you received any prior offers? Is the seller open to a 12% concession, seller financing, or rate buy-down credit?
- Why hasn't it sold? Are there any deal-killer items the seller is aware of (foundation, flood, title, zoning, code violations)?
- Is there a deadline driving the sale (1031 exchange, divorce, estate, relocation)? That informs how much negotiation room exists.
- Schools are D-rated, which usually means shorter tenancies and higher turnover. Who's the typical renter profile here, and what's been the actual vacancy rate?
- Crime grade is F in this area — have there been break-ins, vandalism, or insurance claims at this property in the last 3 years? What carrier currently insures it and at what premium?
- What's the average days-on-market for RENTAL listings here right now (not sales)? A rising rental-DOM trend means longer vacancies and softer asking-rent achievability than the comps imply.
- What's the recent tenant-quality profile in this submarket — average credit score on applications, eviction rate, late-payment / NSF rate, and stable-employment percentage? A property-management company in the area should have these aggregated.
- How much new for-sale + rental construction is in the pipeline within 1–3 miles? Heavy new supply typically softens prices + rents 12–24 months out; constrained supply supports both.
Investment metrics
- 1% rule
- 1.38% ✓
- Cap rate
- 12.27%
- Cash-on-cash
- 21.33%
- DSCR
- 1.95
- GRM
- 6.1
CMA / ARV
- ARV (on-the-fly)
- $215,040
- Comps found
- 12
Show comp detail 12 sales within ~0.75 mi
| Address | Dist | Beds/Ba | Sqft | Sold | Price | $/sf | Match |
|---|---|---|---|---|---|---|---|
| 10767 Jamacha Blvd Spc 147 | 0.00mi | 3/2.0 | 1,325 (-1%) | 8mo | $190,000 | $143 | 91 |
| 10767 Jamacha Blvd Spc 68 | 0.10mi | 3/2.0 | 1,325 (-1%) | 9mo | $170,000 | $128 | 85 |
| 10767 Jamacha Blvd #122 | 0.10mi | 3/2.0 | 1,368 (+2%) | 18mo | $212,500 | $155 | 77 |
| 10767 Jamacha Blvd #45 | 0.10mi | 4/2.0 (+1) | 1,368 (+2%) | 14mo | $250,000 | $183 | 76 |
| 10767 Jamacha Blvd #255 | 0.10mi | 3/2.0 | 1,440 (+7%) | 14mo | $230,000 | $160 | 72 |
| 10767 Jamacha Blvd #88 | 0.10mi | 3/2.0 | 1,440 (+7%) | 15mo | $193,000 | $134 | 70 |
| 10767 Jamacha Blvd Spc 62 | 0.10mi | 3/2.0 | 1,540 (+15%) | 2mo | $219,000 | $142 | 69 |
| 10770 Jamacha Blvd #58 | 0.21mi | 2/2.0 (-1) | 1,368 (+2%) | 21mo | $80,000 | $58 | 65 |
| 10767 Jamacha Blvd #139 | 0.10mi | 3/2.0 | 1,456 (+8%) | 20mo | $260,000 | $179 | 65 |
| 10767 Jamacha Blvd #145 | 0.10mi | 3/2.0 | 1,440 (+7%) | 24mo | $230,000 | $160 | 64 |
| 10707 Jamacha Blvd Spc #60 | 0.17mi | 3/2.0 | 1,152 (-14%) | 10mo | $240,000 | $208 | 60 |
| 10770 Jamacha Blvd #120 | 0.34mi | 3/2.0 | 1,173 (-13%) | 23mo | $250,000 | $213 | 44 |
Match score weights: distance 35% · size 25% · config 20% · recency 20%. Top-matched comps best support the ARV.
Projected returns pro-forma
-3.0% appreciation · 3.0% rent growth · sell at horizon
- IRR
- 13.8%
- Equity multiple
- 1.55×
- Total profit
- $38,631
- Equity at exit
- $37,274
- IRR
- 22.6%
- Equity multiple
- 2.93×
- Total profit
- $135,255
- Equity at exit
- $21,615
Cash invested: $69,997 (down + closing). Projections, not guarantees.
Landlord ↔ Tenant lean methodology
- Overall (STATE)
- 18 Strongly Tenant-Friendly
- State California
- 18 Strongly Tenant-Friendly · D+13
- County
- — inherits STATE
- City
- — inherits STATE
ZIP-level market 91978
- Active inventory
- 20
- Price-to-rent
- 6.1×
Monthly cashflow live
- Estimated rent
- $3,440 high interval (Pro) →
- Mortgage (P&I)
- −$1,311
- Tax from tax record
- −$58 /mo · $700/yr
- Insurance
- −$104
- HOA
- −$0
- Vacancy / Maint / Mgmt
- −$722
- Net cashflow
- $1,244
Break-even live
UW: 25.0% down · 7.5% · 30yr · 1.5% tax · 5.0% vac · 8.0% maint · 8.0% mgmt
Financing live
Cash to close
- Down payment
- $62,498
- Closing costs
- $7,500
- Reserves months
- —
- Total cash needed
- —
Loan-product check · same deal, 3 products live
Conventional
25% down · 7.5% · 30yr
- Down + closing
- —
- Monthly P&I
- —
- Monthly cashflow
- —
- DSCR
- —
- Eligible?
- —
Personal DTI + credit; lowest rate.
DSCR
20% down · 8.5% · 30yr
- Down + closing
- —
- Monthly P&I
- —
- Monthly cashflow
- —
- DSCR
- —
- Eligible?
- —
No personal income docs; deal must DSCR.
Hard money
10% down · 12.0% · 12mo
- Down + closing
- —
- Monthly P&I
- —
- Monthly cashflow
- —
- DSCR
- —
- Eligible?
- —
Short-term bridge; refi at stabilization.
Rent comps 6 comps
| Address | Beds | Baths | Sqft | Rent | $/sqft | DOM | Units | Dist |
|---|---|---|---|---|---|---|---|---|
| 10850 Jamacha Blvd Spring Valley, CA | 1.0–2.0 | 1.0–2.0 | 865 | $2,510 | $2.90 | 1d | 8 | 0.39mi |
| 2615 Babaco St Spring Valley, CA | 3.0 | 2.5 | 1859 | $5,500 | $2.96 | 1d | 1 | 0.52mi |
| 2912 Anawood Way Spring Valley, CA | 3.0 | 2.0 | 1059 | $3,100 | $2.93 | 1d | 1 | 0.54mi |
| 10108 Calle Marinero Spring Valley, CA | 2.0–3.0 | 1.5 | 1038 | $3,125 | $3.01 | 1d | 3 | 0.73mi |
| 3115 Sweetwater Springs Blvd Spring Valley, CA | 1.0–2.0 | 1.0–2.0 | 905 | $2,999 | $3.31 | 1d | 31 | 0.74mi |
| 3265 Sweetwater Springs Blvd Spring Valley, CA | 1.0–3.0 | 1.0–2.0 | 969 | $3,350 | $3.46 | 1d | 1 | 1.02mi |
Listing history 16 events
-
2026-06-18days on market $249,990 Active 188 DOM
-
2026-06-17days on market $249,990 Active 187 DOM
-
2026-06-16days on market $249,990 Active 186 DOM
-
2026-06-15days on market $249,990 Active 185 DOM
-
2026-06-13days on market $249,990 Active 183 DOM
-
2026-06-13days on market $249,990 Active 182 DOM
-
2026-06-09days on market $249,990 Active 179 DOM
-
2026-06-08days on market $249,990 Active 178 DOM
-
2026-06-07days on market $249,990 Active 177 DOM
-
2026-06-04days on market $249,990 Active 174 DOM
-
2026-06-03days on market $249,990 Active 173 DOM
-
2026-06-02days on market $249,990 Active 172 DOM
-
2026-06-01days on market $249,990 Active 171 DOM
-
2026-05-31days on market $249,990 Active 170 DOM
-
2026-03-03price $249,990
-
2025-09-25$299,990 Active
ⓘ Source: listings_history table (triggers on properties + properties_extension) + one-shot
backfill from property_details.listing_events for pre-trigger history.
Tax reassessment forecast CA · Resets to sale price
- Current annual tax
- $700 · $58/mo
- Projected year-2 tax
- $1,900 · $158/mo
- Expected delta
- +$1,200/yr (+$100/mo · 171.4%)
ⓘ Screening estimate from a state-policy table — verify with the county assessor before closing.
Climate risk First Street
- Flood 1/10 Low FEMA zone X (unshaded) · 0% chance over 30 yrs
- Wildfire 7/10 Severe
- Heat 4/10 Moderate 7 d/yr ≥96°F today · 19 d/yr by 30 yrs out
- Wind 1/10 Low
- Air quality 3/10 Moderate 3 unhealthy d/yr today · 3 by 30 yrs out
Nearby sold comps map
Loading sold comps map…
Walkable amenities ~0.75 mi
Loading nearby amenities…
Taxation est. · year 1
- Rental income
- $41,281
- − Mortgage interest
- −$14,003
- − Property taxes
- −$700
- − Insurance
- −$1,250
- − Repairs & maintenance
- −$3,302
- − Management
- −$3,302
- − Depreciation
- −$7,272
- Taxable income
- $11,450
- Est. tax owed @ 24.0%
- −$2,748
- After-tax cash flow
- $12,182/yr
For passive investors: Depreciation is non-cash, so a rental often shows a tax loss while cash-flowing — sheltering income. Rental losses are passive: they offset passive income freely, and up to $25,000/yr can offset ordinary (W-2) income if you actively participate and your MAGI is under $100k (phasing out to $0 by $150k); unused losses carry forward. On sale, claimed depreciation is recaptured at up to 25%, and gains may owe capital-gains tax (a 1031 exchange can defer both). Figures are a year-1 estimate at your 24.0% rate — not tax advice; consult a CPA.
Schools (NCES district)
- District
- Grossmont Union High
- NCES district ID
- 0616230
- Math proficiency
- 31% ▼ -1.00%
- Reading proficiency
- 60% ▲ 5.00%
- Median HH income
- $61,801
- Composite
- 40.07/100
- National rank
- #3810
- State rank
- #173 of 517 in CA
Livability — Spring Valley
- Score
- 59/100
- State rank
- #627
- US rank
- #19882
Category grades
Schools grade is shown separately in the Schools card above.
Census & demographics
- Census place
- Spring Valley, CA
- City population
- 61,064
- Population (ZIP)
- 10,511
Population outlook (San Diego County) Hauer SSP2
- Today (2025)
- 3,678,185 people
- By 2030
- 3,856,546 · +4.8%
- By 2040
- 4,171,407 · +13.4%
- By 2050
- 4,421,607 · +20.2%
- By 2075
- 4,831,599 · +31.4%
- By 2100
- 4,832,502 · +31.4%
Race, ethnicity, and origin ACS 2023
- Neighborhood character
- Diverse neighborhood (Simpson 0.70)
- Race & ethnicity
- White 39% Hispanic / Latino 37% Two or more races 19% Black 11% Asian 6%
- Hispanic origin (detail)
- Mexican 28% Dominican 4%
- Common ancestry
- Arab 4% Romanian 1% Portuguese 1%
- Foreign-born
- 22% · Canada, South Korea
- Languages at home
- 57% English-only · Spanish 30% Arabic 3% Other Asian/Pacific 3%
Political lean MEDSL · San Diego
- 2024 margin
- D (+16.8) · D 56.9% · R 40.1% · Other 2.9%
- 2008→2024 swing
- +6.6pp toward D · 2008: 10.2pp · 2024: 16.8pp
- All cycles
- 2024: D+16.8 2020: D+22.8 2016: D+17.8 2012: D+5.1 2008: D+10.2
Not yet ingested
- Civics
- —
Market trends
- HPI YoY
- ▼ -341.95%
- Current HPI
- 330.6808
- Rent YoY
- —
- Metro
- —
- State GDP YoY
- ▲ 3.21%
- F500 in state
- 116
Industry mix (Fortune 500 HQ in CA)
| Industry | F500 HQs | Revenue |
|---|---|---|
| Technology | 27 | $1,492B |
|
||
| Financial Services | 3 | $174B |
|
||
| Retail | 3 | $44B |
|
||
| Insurance | 3 | $26B |
|
||
| Media / Entertainment | 2 | $115B |
|
||
| Pharmaceuticals / Biotech | 2 | $62B |
|
||
Price history
-16.7% since first listed2 events — show timeline
- 2026-03-03 Price Changed $249,990 CRMLS
- 2025-09-25 Listed $299,990 CRMLS
Property tax history
+5.4%/yrLatest (2013): $700 · +5.4% YoY. Source: county tax records.
Cash-flow waterfall
monthlySold comps — $/sqft
last 12 mo · ≤1 miLoading sold comps…