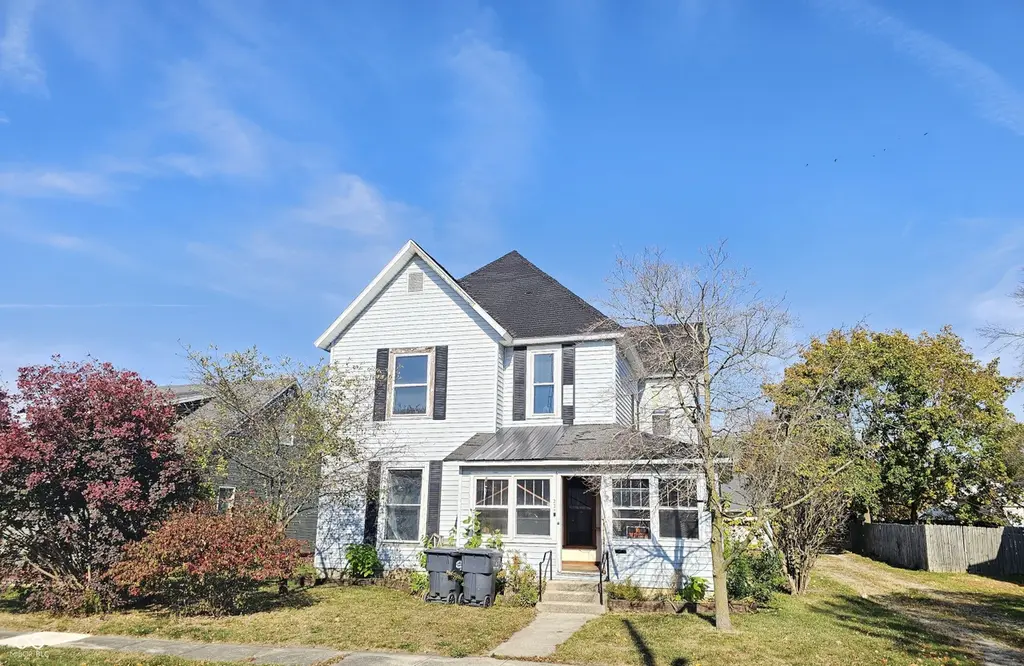
234 E Commerce St · Dunkirk, IN
Flood risk 6/10 · Moderate
- FEMA flood zone
- X (unshaded)
- Chance of flooding over 30 yrs
- 0.69%
- Est. flood insurance / yr
- $507 – $1,088
Fire risk 1/10 · Minimal
- Est. fire insurance / yr
- $717 – $1,331
Heat risk 3/10 · Minor
- Hot days now (above 99°F)
- 7 days/yr
- Hot days in 30 yrs
- 18 days/yr
Wind risk 2/10 · Minimal
- Chance of severe wind over 30 yrs
- —
Air-quality risk 3/10 · Minor
- Unhealthy air days now
- 2 days/yr
- Unhealthy air days in 30 yrs
- 4 days/yr
Risk factors via First Street. Map © Google.
Why this score? — see what drove the A- grade
The composite is a weighted blend of 9 inputs, each scored 0–100. Each bar is that input's sub-score; the figure is the points it added to the 100-point composite (weight × sub-score).
- Cash flow +30.0/30.0
- ARV discount +15.0/15.0
- 1% rule +10.0/10.0
- DSCR +10.0/10.0
- Appreciation +6.8/10.0
- Schools +3.2/10.0
- Livability +3.2/5.0
- Rent growth +2.5/5.0
- Condition / age +2.5/5.0
$75,049
🖨 Deal sheet 📄 Offer letter ✓ Due diligence
Listing remarks MLS
Introducing an exceptional property at 234 E Commerce St, Dunkirk, Indiana! This stunning 2-story home offers timeless charm and modern potential, making it perfect for both investors and home buyers. Featuring hardwood floors throughout, this residence exudes warmth and elegance. The home boasts oversized rooms, providing ample space for any family. The dining room comes complete with a built-in wall cabinet, adding character and functional storage. The large kitchen is well-appointed and ideal for family gatherings and culinary adventures. Upstairs, you'll find three generously sized bedrooms, with the potential for a fourth bedroom in the spacious layout. The three-season enclosed porch offers a versatile space that could be an indoor office, playroom, or relaxation area. An oversized workshop/1-car garage provides plenty of room for projects and storage. The property includes off-street parking for convenience. Located close to shopping, restaurants, and amenities, this home is ready to meet all your needs. For more details, contact Brian Ingle with F. C. Tucker Richmond at 765-960-0533 or Brian. [email protected]. Act fast—this amazing opportunity won’t last long!
Key facts
- Large kitchen
- Oversized workshop
- Off-street parking
Tags
Property features AI
Exterior
- Parking: Detached garage (1 car)
- Security: Smoke detector(s)
- Utilities: Public water; Municipal sewer connected; Solid waste service available
- Home design: Single family residence; Two levels
- Construction: Vinyl siding; Crawl space foundation
- Exterior features: Lot under 1/4 acre (approximately 0.15 acre)
Interior
- Kitchen: Range hood
- Bedrooms: Three bedrooms on the upper level; Total of 3 bedrooms
- Bathrooms: One full bathroom; One half bathroom
- Heating & cooling: Forced air heating; No central cooling listed
- Interior features: Breakfast bar; Range hood; Smoke detector(s)
- Laundry & utility: No specific laundry appliances listed
Neighborhood map
What this means for you Summary
Snapshot
- This is a 3-bed/1.5-bath single-family listed at $75k.
Deal economics
- At list price, monthly cash flow is $435 ($5k/yr) — positive.
- The deal already cash-flows at list — no discount required.
- Meets the 1% rule at list price ($1k rent vs $75k).
- Recommended offer: $73k (3.0% below list) — sets the bar for market timing.
Location & tenants
- Location reads 64/100 on livability (#404 in IN) — a middle-class / working-renter tenant base. Strengths: crime A+, cost of living A+, housing A+; Watch: health & safety D, amenities F, commute F.
- Jay School Corporation (rural): math 38% / reading 37% proficiency, ranked #175 of 301 in IN (top 58%) — families likely to look elsewhere, expect single-tenant / working-renter base with shorter leases.
- Zoned schools: Jay County Jr/Sr High School (math 34% / reading 41%, grade F, #245 of 369 statewide, top 67%, 1,242 students, 50% FRL).
- Market conditions: 32 active listings in the ZIP; 19 units permitted in Jay County in 2024 (0 in 5+ unit buildings).
Forward outlook
- In year one you build about $3k of equity ($519 loan paydown + $3k appreciation (3.6% local appreciation)).
- Jay County population projected at -12% by 2050 — secular population decline; favor cash flow + early exit over multi-decade hold.
- At projected returns (3.6% appreciation + 3.0% rent growth), your $21k cash investment doubles in ~3 years — after that, you're playing with house money.
- By year 10, paydown + projected appreciation supports a ~$32k cash-out refi (75% LTV) — recoverable capital for the next deal without selling this one.
Negotiation context
- It's been on market 45 days — a 3% lower offer ($73k) is reasonable based on typical stale-listing flexibility.
- 2 sale attempts with the ask held roughly flat each time — persistent listings suggest the price (not the market) is what's stuck; bring a comps-based counter.
Risks & watch-outs
- Watch-outs: built in 1916 — expect roof / HVAC / electrical / plumbing capex.
- Climate carrying-cost: major flood risk — expect insurance premiums to compound above CPI over the hold.
Questions for the listing agent
- It's been on market 45 days. Have you received any prior offers? Is the seller open to a 3% concession, seller financing, or rate buy-down credit?
- Built in 1916 — when were the roof, HVAC, electrical panel, plumbing, and water heater last replaced?
- Is there a deadline driving the sale (1031 exchange, divorce, estate, relocation)? That informs how much negotiation room exists.
- Schools are D-rated, which usually means shorter tenancies and higher turnover. Who's the typical renter profile here, and what's been the actual vacancy rate?
- What's the average days-on-market for RENTAL listings here right now (not sales)? A rising rental-DOM trend means longer vacancies and softer asking-rent achievability than the comps imply.
- What's the recent tenant-quality profile in this submarket — average credit score on applications, eviction rate, late-payment / NSF rate, and stable-employment percentage? A property-management company in the area should have these aggregated.
- How much new for-sale + rental construction is in the pipeline within 1–3 miles? Heavy new supply typically softens prices + rents 12–24 months out; constrained supply supports both.
Investment metrics
- 1% rule
- 1.63% ✓
- Cap rate
- 13.24%
- Cash-on-cash
- 24.82%
- DSCR
- 2.10
- GRM
- 5.1
CMA / ARV
- ARV (median comp)
- $107,621
- List price
- $75,049
- Delta
- -30.27%
- Verdict
- UNDERPRICED
- Comps
- 20 within 1.0 mi
Show comp detail 12 sales within ~0.75 mi
| Address | Dist | Beds/Ba | Sqft | Sold | Price | $/sf | Match |
|---|---|---|---|---|---|---|---|
| 267 E Commerce St | 0.07mi | 3/1.0 | 1,995 (+1%) | 2mo | $129,900 | $65 | 93 |
| 225 E Washington St | 0.08mi | 4/2.5 (+1) | 1,952 (-2%) | 7mo | $205,000 | $105 | 79 |
| 226 W Washington St | 0.24mi | 3/1.0 | 1,920 (-3%) | 9mo | $5,500 | $3 | 74 |
| 140 Arlington Ave | 0.27mi | 3/2.0 | 1,825 (-8%) | 2mo | $200,000 | $110 | 71 |
| 331 E Center St | 0.12mi | 4/2.0 (+1) | 1,857 (-6%) | 15mo | $159,000 | $86 | 64 |
| 143 S Broad St | 0.12mi | 4/2.0 (+1) | 2,200 (+11%) | 8mo | $9,000 | $4 | 63 |
| 147 S Broad St | 0.12mi | 3/2.0 | 1,692 (-15%) | 7mo | $30,000 | $18 | 62 |
| 116 S Barbier St | 0.36mi | 3/1.5 | 1,840 (-7%) | 12mo | $150,000 | $82 | 61 |
| 329 W Washington St | 0.32mi | 3/2.0 | 2,202 (+11%) | 5mo | $121,400 | $55 | 61 |
| 143 S Broad St | 0.12mi | 4/2.0 (+1) | 2,220 (+12%) | 18mo | $8,000 | $4 | 53 |
| 303 Shrack Ln | 0.73mi | 4/2.0 (+1) | 2,013 (+2%) | 8mo | $222,000 | $110 | 50 |
| 305 Merry Ct | 0.68mi | 4/3.0 (+1) | 1,788 (-10%) | 16mo | $235,000 | $131 | 27 |
Match score weights: distance 35% · size 25% · config 20% · recency 20%. Top-matched comps best support the ARV.
Projected returns pro-forma
3.64% appreciation · 3.0% rent growth · sell at horizon
- IRR
- 32.1%
- Equity multiple
- 2.87×
- Total profit
- $39,323
- Equity at exit
- $36,482
- IRR
- 31.8%
- Equity multiple
- 5.67×
- Total profit
- $98,143
- Equity at exit
- $58,451
Cash invested: $21,014 (down + closing). Projections, not guarantees.
Landlord ↔ Tenant lean methodology
- Overall (STATE)
- 90 Strongly Landlord-Friendly
- State Indiana
- 90 Strongly Landlord-Friendly · R+11
- County
- — inherits STATE
- City
- — inherits STATE
ZIP-level market 47336
- Home prices YoY
- 1.6%
- Active inventory
- 32
- Price-to-rent
- 5.1×
Monthly cashflow live
- Estimated rent
- $1,227 medium interval (Pro) →
- Mortgage (P&I)
- −$394
- Tax from tax record
- −$110 /mo · $1,318/yr
- Insurance
- −$31
- HOA
- −$0
- Vacancy / Maint / Mgmt
- −$258
- Net cashflow
- $435
Break-even live
UW: 25.0% down · 7.5% · 30yr · 1.5% tax · 5.0% vac · 8.0% maint · 8.0% mgmt
Financing live
Cash to close
- Down payment
- $18,762
- Closing costs
- $2,251
- Reserves months
- —
- Total cash needed
- —
Loan-product check · same deal, 3 products live
Conventional
25% down · 7.5% · 30yr
- Down + closing
- —
- Monthly P&I
- —
- Monthly cashflow
- —
- DSCR
- —
- Eligible?
- —
Personal DTI + credit; lowest rate.
DSCR
20% down · 8.5% · 30yr
- Down + closing
- —
- Monthly P&I
- —
- Monthly cashflow
- —
- DSCR
- —
- Eligible?
- —
No personal income docs; deal must DSCR.
Hard money
10% down · 12.0% · 12mo
- Down + closing
- —
- Monthly P&I
- —
- Monthly cashflow
- —
- DSCR
- —
- Eligible?
- —
Short-term bridge; refi at stabilization.
Listing history 19 events
-
2026-06-18days on market $75,049 Active 45 DOM
-
2026-06-17days on market $75,049 Active 44 DOM
-
2026-06-16days on market $75,049 Active 43 DOM
-
2026-06-15days on market $75,049 Active 42 DOM
-
2026-06-13days on market $75,049 Active 40 DOM
-
2026-06-12days on market $75,049 Active 39 DOM
-
2026-06-09days on market $75,049 Active 36 DOM
-
2026-06-08days on market $75,049 Active 35 DOM
-
2026-06-07days on market $75,049 Active 34 DOM
-
2026-06-05days on market $75,049 Active 32 DOM
-
2026-06-04days on market $75,049 Active 30 DOM
-
2026-06-02days on market $75,049 Active 29 DOM
-
2026-06-01days on market $75,049 Active 28 DOM
-
2026-05-31days on market $75,049 Active 27 DOM
-
2026-05-31days on market $75,049 Active 26 DOM
-
2026-05-04$75,049 Active 1026-char remark
-
2026-05-03$75,049 Active 1232-char remark
Show marketing remark (1204 chars)
Introducing an exceptional property at 234 E Commerce St, Dunkirk, Indiana! This stunning 2-story home offers timeless charm and modern potential, making it perfect for both investors and home buyers. Featuring hardwood floors throughout, this residence exudes warmth and elegance. The home boasts oversized rooms, providing ample space for any family. The dining room comes complete with a built-in wall cabinet, adding character and functional storage. The large kitchen is well-appointed and ideal for family gatherings and culinary adventures. Upstairs, you'll find three generously sized bedrooms, with the potential for a fourth bedroom in the spacious layout. The three-season enclosed porch offers a versatile space that could be an indoor office, playroom, or relaxation area. An oversized workshop/1-car garage provides plenty of room for projects and storage. The property includes off-street parking for convenience. Located close to shopping, restaurants, and amenities, this home is ready to meet all your needs. For more details, contact Brian Ingle with F. C. Tucker Richmond at 765-960-0533 or Brian. [email protected]. Act fast—this amazing opportunity won’t last long!
-
2025-11-18price $75,049
-
2025-04-09price $75,050
ⓘ Source: listings_history table (triggers on properties + properties_extension) + one-shot
backfill from property_details.listing_events for pre-trigger history.
Tax reassessment forecast IN · Partial reset (capped growth)
- Current annual tax
- $1,318 · $110/mo
- Projected year-2 tax
- $1,318 · $110/mo
- Expected delta
- $0/yr ($0/mo · 0.0%)
ⓘ Screening estimate from a state-policy table — verify with the county assessor before closing.
Climate risk First Street
- Flood 6/10 Major FEMA zone X (unshaded) · 69% chance over 30 yrs
- Wildfire 1/10 Low
- Heat 3/10 Moderate 7 d/yr ≥99°F today · 18 d/yr by 30 yrs out
- Wind 2/10 Low
- Air quality 3/10 Moderate 2 unhealthy d/yr today · 4 by 30 yrs out
Nearby sold comps map
Loading sold comps map…
Walkable amenities ~0.75 mi
Loading nearby amenities…
Taxation est. · year 1
- Rental income
- $14,723
- − Mortgage interest
- −$4,204
- − Property taxes
- −$1,318
- − Insurance
- −$375
- − Repairs & maintenance
- −$1,178
- − Management
- −$1,178
- − Depreciation
- −$2,183
- Taxable income
- $4,287
- Est. tax owed @ 24.0%
- −$1,029
- After-tax cash flow
- $4,187/yr
For passive investors: Depreciation is non-cash, so a rental often shows a tax loss while cash-flowing — sheltering income. Rental losses are passive: they offset passive income freely, and up to $25,000/yr can offset ordinary (W-2) income if you actively participate and your MAGI is under $100k (phasing out to $0 by $150k); unused losses carry forward. On sale, claimed depreciation is recaptured at up to 25%, and gains may owe capital-gains tax (a 1031 exchange can defer both). Figures are a year-1 estimate at your 24.0% rate — not tax advice; consult a CPA.
Schools (NCES district)
- District
- Jay School Corporation
- NCES district ID
- 1804980
- Math proficiency
- 38% ▼ -13.00%
- Reading proficiency
- 37% ▼ -13.00%
- Median HH income
- $40,841
- Composite
- 31.56/100
- National rank
- #5954
- State rank
- #175 of 301 in IN
Livability — Dunkirk
- Score
- 64/100
- State rank
- #404
- US rank
- #14764
Category grades
Schools grade is shown separately in the Schools card above.
Census & demographics
- Census place
- Dunkirk, IN
- Population (ZIP)
- 2,793
Population outlook (Jay County) Hauer SSP2
- Today (2025)
- 20,586 people
- By 2030
- 20,155 · -2.1%
- By 2040
- 19,274 · -6.4%
- By 2050
- 18,203 · -11.6%
- By 2075
- 15,062 · -26.8%
- By 2100
- 10,857 · -47.3%
Race, ethnicity, and origin ACS 2023
- Neighborhood character
- Predominantly White (95%)
- Race & ethnicity
- White 95% Two or more races 3% Hispanic / Latino 2%
- Common ancestry
- Italian 4% Slovak 2% Scotch-Irish 1%
- Foreign-born
- 0%
- Languages at home
- 98% English-only · Spanish 1%
Political lean MEDSL · Jay
- 2024 margin
- Solid R (+55.2) · D 21.6% · R 76.7% · Other 1.7%
- 2008→2024 swing
- -47.3pp toward R · 2008: -7.8pp · 2024: -55.2pp
- All cycles
- 2024: R+55.2 2020: R+52.4 2016: R+47.8 2012: R+20.0 2008: R+7.8
Not yet ingested
- Civics
- —
Market trends
- HPI YoY
- ▲ 3.64%
- Current HPI
- 238.768
- Rent YoY
- —
- Metro
- —
- State GDP YoY
- ▲ 2.90%
- F500 in state
- 18
Industry mix (Fortune 500 HQ in IN)
| Industry | F500 HQs | Revenue |
|---|---|---|
| Industrial Machinery | 2 | $37B |
|
||
| Healthcare | 1 | $177B |
|
||
| Pharmaceuticals | 1 | $45B |
|
||
| Metals / Steel | 1 | $18B |
|
||
| Agriculture | 1 | $17B |
|
||
| Packaging | 1 | $12B |
|
||
Price history
-0.0% since first listed4 events — show timeline
- 2026-05-04 Listed $75,049 MIBOR as Distributed by MLS Grid
- 2026-05-03 Listed $75,049 RRELMS
- 2025-11-18 Price Changed $75,049 RRELMS
- 2025-04-09 Price Changed $75,050 RRELMS
Property tax history
-4.1%/yrLatest (2025): $1,318 · +25.0% YoY. Source: county tax records.
Cash-flow waterfall
monthlySold comps — $/sqft
last 12 mo · ≤1 miLoading sold comps…