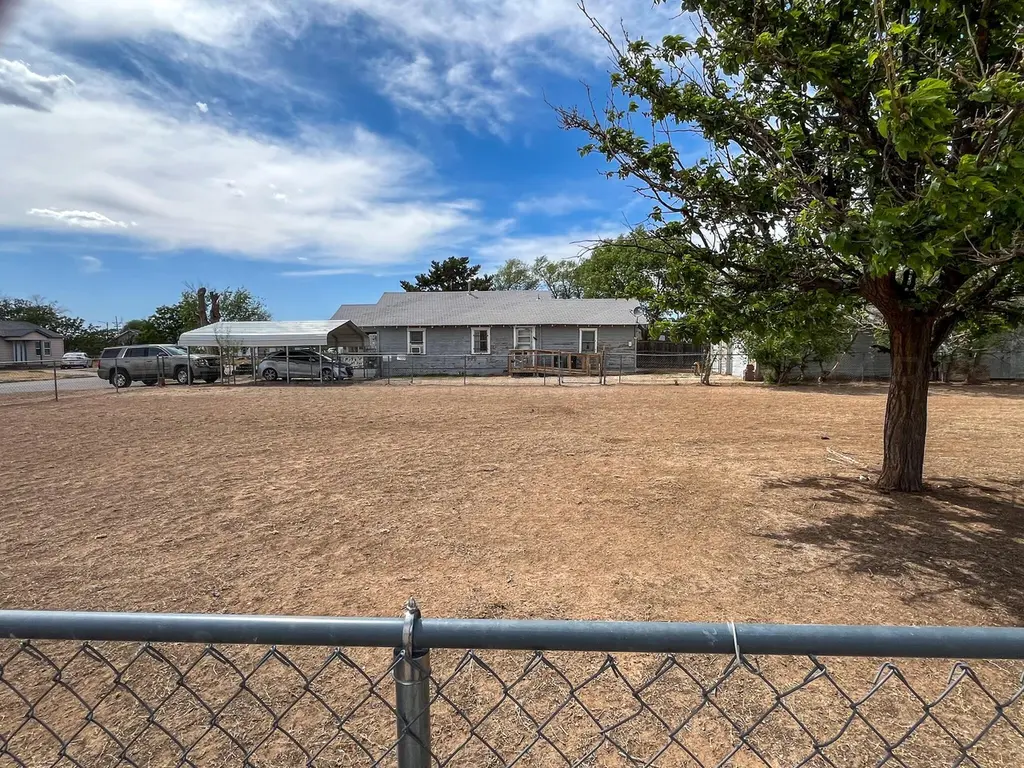
2502 SW 2nd Ave · Amarillo, TX
Flood risk 1/10 · Minimal
- FEMA flood zone
- X (unshaded)
- Chance of flooding over 30 yrs
- 0.0%
- Est. flood insurance / yr
- $507 – $1,088
Fire risk 10/10 · Severe
- Est. fire insurance / yr
- $1,222 – $2,270
Heat risk 5/10 · Moderate
- Hot days now (above 97°F)
- 7 days/yr
- Hot days in 30 yrs
- 20 days/yr
Wind risk 2/10 · Minimal
- Chance of severe wind over 30 yrs
- —
Air-quality risk 2/10 · Minimal
- Unhealthy air days now
- 1 days/yr
- Unhealthy air days in 30 yrs
- 1 days/yr
Risk factors via First Street. Map © Google.
Why this score? — see what drove the B- grade
The composite is a weighted blend of 9 inputs, each scored 0–100. Each bar is that input's sub-score; the figure is the points it added to the 100-point composite (weight × sub-score).
- Cash flow +30.0/30.0
- DSCR +10.0/10.0
- 1% rule +9.0/10.0
- ARV discount +7.5/15.0
- Rent growth +3.7/5.0
- Schools +3.6/10.0
- Livability +3.3/5.0
- Condition / age +2.5/5.0
- Appreciation +0.0/10.0
$70,000
🖨 Deal sheet (PDF) 📄 Offer letter ✓ Due diligence
Listing remarks
Investor Special! Property at 2502 SW 2nd Ave is offered as-is, with seller making no repairs. Sale includes vacant corner lot at 2500 SW 2nd Ave (Property ID 156037) as part of the transaction. Vacant lot may provide opportunity for future use, expansion, or separate disposition, subject to buyer verification and applicable regulations. Cash or Conventional financing only. Property is priced with investor opportunity in mind. Buyer to verify all information, utilities, zoning, and potential uses.
Key facts
- Vacant corner lot
- Separate disposition
- 0.32 acre lot
Tags
Neighborhood map
What this means for you Summary
Snapshot
- This is a 3-bed/1.0-bath single-family listed at $70k.
Deal economics
- At list price, monthly cash flow is $279 ($3k/yr) — positive.
- The deal already cash-flows at list — no discount required.
- Meets the 1% rule at list price ($980 rent vs $70k).
- Recommended offer: $68k (3.0% below list) — sets the bar for market timing.
Location & tenants
- Location reads 66/100 on livability (#624 in TX) — a middle-class / working-renter tenant base. Strengths: cost of living A+, housing A+; Watch: amenities C-, crime F, commute F.
- Amarillo ISD (urban): math 44% / reading 41% proficiency, ranked #336 of 826 in TX (top 41%) — families likely to look elsewhere, expect single-tenant / working-renter base with shorter leases.
- Zoned schools: San Jacinto El (math 29% / reading 26%, grade F, #2,768 of 4,322 statewide, top 65%, 441 students, 95% FRL); Houston Middle (math 32% / reading 28%, grade F, #1,056 of 1,662 statewide, top 65%, 656 students, 88% FRL); Tascosa H S (math 36% / reading 45%, grade F, #798 of 1,632 statewide, top 49%, 2,187 students, 57% FRL) — zoned schools average 80% FRL vs 58% district-wide (22 pts higher); higher-poverty schools than district average — tighter screening recommended.
- Market conditions: Rents rising fast (+4.7%/yr); 132 active listings in the ZIP; 13 comparable units currently listed for rent nearby; rentals at typical pace (median 23d on market — plan ~3-4 weeks tenant-placement turnaround); 1,214 units permitted in Potter County in 2024 (650 in 5+ unit buildings).
Forward outlook
- Local home prices are declining (-3.0%/yr); year-one equity from $484 of loan paydown is wiped out by about $2k of value loss. Plan a longer hold.
- At projected returns (-3.0% appreciation + 4.7% rent growth), your $20k cash investment doubles in ~7 years — after that, you're playing with house money.
Negotiation context
- It's been on market 38 days — a 3% lower offer ($68k) is reasonable based on typical stale-listing flexibility.
Risks & watch-outs
- Watch-outs: built in 1926 — expect roof / HVAC / electrical / plumbing capex.
- Climate carrying-cost: severe wildfire risk; extreme-heat days projected 7→20/yr by 2055 (HVAC capex compounding) — expect insurance premiums to compound above CPI over the hold.
Questions for the listing agent
- It's been on market 38 days. Have you received any prior offers? Is the seller open to a 3% concession, seller financing, or rate buy-down credit?
- Built in 1926 — when were the roof, HVAC, electrical panel, plumbing, and water heater last replaced?
- Is there a deadline driving the sale (1031 exchange, divorce, estate, relocation)? That informs how much negotiation room exists.
- Schools are D-rated, which usually means shorter tenancies and higher turnover. Who's the typical renter profile here, and what's been the actual vacancy rate?
- Crime grade is F in this area — have there been break-ins, vandalism, or insurance claims at this property in the last 3 years? What carrier currently insures it and at what premium?
- What's the average days-on-market for RENTAL listings here right now (not sales)? A rising rental-DOM trend means longer vacancies and softer asking-rent achievability than the comps imply.
- What's the recent tenant-quality profile in this submarket — average credit score on applications, eviction rate, late-payment / NSF rate, and stable-employment percentage? A property-management company in the area should have these aggregated.
- How much new for-sale + rental construction is in the pipeline within 1–3 miles? Heavy new supply typically softens prices + rents 12–24 months out; constrained supply supports both.
Investment metrics
- 1% rule
- 1.40% ✓
- Cap rate
- 11.07%
- Cash-on-cash
- 17.07%
- DSCR
- 1.76
- GRM
- 6.0
CMA / ARV
- ARV (median comp)
- $211,426
- List price
- $70,000
- Delta
- -66.89%
- Verdict
- UNDERPRICED
- Comps
- 2 within 2.0 mi
Projected returns pro-forma
-3.0% appreciation · 4.69% rent growth · sell at horizon
- IRR
- 10.3%
- Equity multiple
- 1.42×
- Total profit
- $8,135
- Equity at exit
- $10,437
- IRR
- 20.8%
- Equity multiple
- 2.90×
- Total profit
- $37,241
- Equity at exit
- $6,052
Cash invested: $19,600 (down + closing). Projections, not guarantees.
Landlord ↔ Tenant lean methodology
- Overall (STATE)
- 87 Strongly Landlord-Friendly
- State Texas
- 87 Strongly Landlord-Friendly · R+5
- County
- — inherits STATE
- City
- — inherits STATE
ZIP-level market 79106
- Rents YoY
- 4.7%
- Active inventory
- 132
- Price-to-rent
- 6.0×
Monthly cashflow live
- Estimated rent
- $980 high interval (Pro) →
- Mortgage (P&I)
- −$367
- Tax from tax record
- −$99 /mo · $1,190/yr
- Insurance
- −$29
- HOA
- −$0
- Vacancy / Maint / Mgmt
- −$206
- Net cashflow
- $279
Break-even live
Sensitivity live
| Price | -10% $318 | -5% $299 | +0% $279 | +5% $259 | +10% $239 |
|---|---|---|---|---|---|
| Rent | -10% $201 | -5% $240 | +0% $279 | +5% $318 | +10% $356 |
| Rate | -1.0pp $314 | -0.5pp $297 | base $279 | +0.5pp $261 | +1.0pp $242 |
UW: 25.0% down · 7.5% · 30yr · 1.5% tax · 5.0% vac · 8.0% maint · 8.0% mgmt
Financing live
Cash to close
- Down payment
- $17,500
- Closing costs
- $2,100
- Reserves months
- —
- Total cash needed
- —
Loan-product check · same deal, 3 products live
Conventional
25% down · 7.5% · 30yr
- Down + closing
- —
- Monthly P&I
- —
- Monthly cashflow
- —
- DSCR
- —
- Eligible?
- —
Personal DTI + credit; lowest rate.
DSCR
20% down · 8.5% · 30yr
- Down + closing
- —
- Monthly P&I
- —
- Monthly cashflow
- —
- DSCR
- —
- Eligible?
- —
No personal income docs; deal must DSCR.
Hard money
10% down · 12.0% · 12mo
- Down + closing
- —
- Monthly P&I
- —
- Monthly cashflow
- —
- DSCR
- —
- Eligible?
- —
Short-term bridge; refi at stabilization.
Rent comps 13 comps
| Address | Beds | Baths | Sqft | Rent | $/sqft | DOM | Units | Dist |
|---|---|---|---|---|---|---|---|---|
| 108 N Florida St Amarillo, TX | 2.0 | 1.0 | 960 | $800 | $0.83 | 22d | 1 | 0.25mi |
| 2306 SW 8th Ave Amarillo, TX | 2.0 | 1.0 | 553 | $950 | $1.72 | 22d | 1 | 0.46mi |
| 2306 SW 8th Ave Unit 2 Amarillo, TX | 2.0 | 1.0 | 700 | $950 | $1.36 | 45d | 1 | 0.46mi |
| 705 S Florida St Amarillo, TX | 2.0 | 1.0 | 1014 | $850 | $0.84 | 22d | 1 | 0.46mi |
| 802 S Kentucky St Amarillo, TX | 2.0 | 1.0 | 970 | $899 | $0.93 | 45d | 1 | 0.55mi |
| 406 S Tennessee St Amarillo, TX | 2.0 | 1.0 | 837 | $895 | $1.07 | 22d | 1 | 0.72mi |
| 89 N Fairmont St Amarillo, TX | 3.0 | 1.0 | 780 | $1,000 | $1.28 | 45d | 1 | 0.82mi |
| 1008 S Mississippi St Amarillo, TX | 3.0 | 2.0 | 1061 | $1,275 | $1.20 | 22d | 1 | 0.98mi |
| 1637 NW 16th Ave Amarillo, TX | 3.0 | 1.0 | 1056 | $1,100 | $1.04 | 22d | 1 | 1.10mi |
| 3118 SW 15th Ave Amarillo, TX | 2.0–3.0 | 1.0–2.0 | 1015 | $900 | $0.89 | 15d | 17 | 1.16mi |
| 4224 SW 2nd Ave Amarillo, TX | 2.0 | 1.0 | 891 | $775 | $0.87 | 22d | 1 | 1.27mi |
| 4226 SW 2nd Ave Amarillo, TX | 2.0 | 2.0 | 800 | $949 | $1.19 | 15d | 1 | 1.29mi |
| 4231 SW 2nd Ave Amarillo, TX | 2.0 | 1.0 | 891 | $875 | $0.98 | 22d | 1 | 1.31mi |
Listing history 7 events
-
2026-06-01status $70,000 Pending 38 DOM
-
2026-05-31days on market $70,000 Active Under Contract 38 DOM
-
2026-05-30days on market $70,000 Active Under Contract 37 DOM
-
2026-05-07price $70,000 502-char remark
-
2026-04-24$79,000 Active 502-char remark
-
2009-06-30soldstatus
-
2008-12-17soldstatus
ⓘ Source: listings_history table (triggers on properties + properties_extension) + one-shot
backfill from property_details.listing_events for pre-trigger history.
Tax reassessment forecast TX · Resets to sale price
- Current annual tax
- $1,190 · $99/mo
- Projected year-2 tax
- $1,281 · $107/mo
- Expected delta
- +$91/yr (+$8/mo · 7.7%)
ⓘ Screening estimate from a state-policy table — verify with the county assessor before closing.
Climate risk First Street
- Flood 1/10 Low FEMA zone X (unshaded) · 0% chance over 30 yrs
- Wildfire 10/10 Extreme
- Heat 5/10 Major 7 d/yr ≥97°F today · 20 d/yr by 30 yrs out
- Wind 2/10 Low
- Air quality 2/10 Low 1 unhealthy d/yr today · 1 by 30 yrs out
Nearby sold comps map
Loading sold comps map…
Walkable amenities ~0.75 mi
Loading nearby amenities…
Taxation est. · year 1
- Rental income
- $11,761
- − Mortgage interest
- −$3,921
- − Property taxes
- −$1,190
- − Insurance
- −$350
- − Repairs & maintenance
- −$941
- − Management
- −$941
- − Depreciation
- −$2,036
- Taxable income
- $2,382
- Est. tax owed @ 24.0%
- −$572
- After-tax cash flow
- $2,775/yr
For passive investors: Depreciation is non-cash, so a rental often shows a tax loss while cash-flowing — sheltering income. Rental losses are passive: they offset passive income freely, and up to $25,000/yr can offset ordinary (W-2) income if you actively participate and your MAGI is under $100k (phasing out to $0 by $150k); unused losses carry forward. On sale, claimed depreciation is recaptured at up to 25%, and gains may owe capital-gains tax (a 1031 exchange can defer both). Figures are a year-1 estimate at your 24.0% rate — not tax advice; consult a CPA.
Schools (NCES district)
- District
- Amarillo ISD
- NCES district ID
- 4808130
- Math proficiency
- 44% ▼ -9.00%
- Reading proficiency
- 41% ▼ -3.00%
- Median HH income
- $43,478
- Composite
- 35.96/100
- National rank
- #4798
- State rank
- #336 of 826 in TX
Livability — Amarillo
- Score
- 66/100
- State rank
- #624
- US rank
- #11876
Category grades
Schools grade is shown separately in the Schools card above.
Census & demographics
- Census place
- Amarillo, TX
- County
- Potter County · 72,216 people
- City population
- 185,802
- Metro
- Amarillo, TX
- Population (ZIP)
- 26,161
- Household income
- $59,493
- Rent vs Own
- Severe rent burden
- 994.0
Population outlook (Potter County) Hauer SSP2
- Today (2025)
- 121,296 people
- By 2030
- 120,883 · -0.3%
- By 2040
- 119,668 · -1.3%
- By 2050
- 117,788 · -2.9%
- By 2075
- 110,250 · -9.1%
- By 2100
- 92,923 · -23.4%
Race, ethnicity, and origin ACS 2023
- Neighborhood character
- Diverse neighborhood (Simpson 0.58)
- Race & ethnicity
- White 56% Hispanic / Latino 33% Two or more races 16% Black 5% Asian 4%
- Hispanic origin (detail)
- Mexican 29%
- Common ancestry
- Italian 3% Slovak 2% Iranian 2%
- Foreign-born
- 9% · Canada, Philippines, Vietnam
- Languages at home
- 80% English-only · Spanish 16% Other Asian/Pacific 2% Vietnamese 1%
Political lean MEDSL · Potter
- 2024 margin
- Solid R (+44.4) · D 27.3% · R 71.7% · Other 1.1%
- 2008→2024 swing
- -5.0pp toward R · 2008: -39.4pp · 2024: -44.4pp
- All cycles
- 2024: R+44.4 2020: R+38.7 2016: R+41.9 2012: R+44.6 2008: R+39.4
Not yet ingested
- Civics
- —
Market trends
- HPI YoY
- ▼ -179.04%
- Current HPI
- 178.2153
- Rent YoY
- ▲ 4.69%
- Metro
- Amarillo, TX
- State GDP YoY
- ▲ 3.95%
- F500 in state
- 110
Industry mix (Fortune 500 HQ in TX)
| Industry | F500 HQs | Revenue |
|---|---|---|
| Energy | 16 | $1,198B |
|
||
| Technology | 5 | $198B |
|
||
| Engineering / Construction | 4 | $72B |
|
||
| Energy Services | 3 | $60B |
|
||
| Utilities | 3 | $41B |
|
||
| Healthcare | 2 | $330B |
|
||
Price history
3 events — show timeline
- 2026-05-07 Price Changed $70,000 AARMLS
- 2009-06-30 Sold (Public Records) — Public Records
- 2008-12-17 Sold (Public Records) — Public Records
Property tax history
+4.6%/yrLatest (2025): $1,190 · +12.2% YoY. Source: county tax records.
Cash-flow waterfall
monthlySold comps — $/sqft
last 12 mo · ≤1 miLoading sold comps…