3562 Highway 82 W · Tifton, GA
Flood risk No data
- FEMA flood zone
- —
- Chance of flooding over 30 yrs
- —
- Est. flood insurance / yr
- —
Fire risk No data
- Est. fire insurance / yr
- —
Heat risk No data
- Hot days now (above threshold)
- —
- Hot days in 30 yrs
- —
Wind risk No data
- Chance of severe wind over 30 yrs
- —
Air-quality risk No data
- Unhealthy air days now
- —
- Unhealthy air days in 30 yrs
- —
Risk factors via First Street. Map © Google.
Why this score? — see what drove the F grade
The composite is a weighted blend of 9 inputs, each scored 0–100. Each bar is that input's sub-score; the figure is the points it added to the 100-point composite (weight × sub-score).
- ARV discount +7.5/15.0
- Cash flow +7.2/30.0
- Livability +3.6/5.0
- Rent growth +2.5/5.0
- Schools +2.5/10.0
- Condition / age +2.2/5.0
- 1% rule +2.0/10.0
- DSCR +1.4/10.0
- Appreciation +0.0/10.0
$165,000
🖨 Deal sheet (PDF) 📄 Offer letter ✓ Due diligence
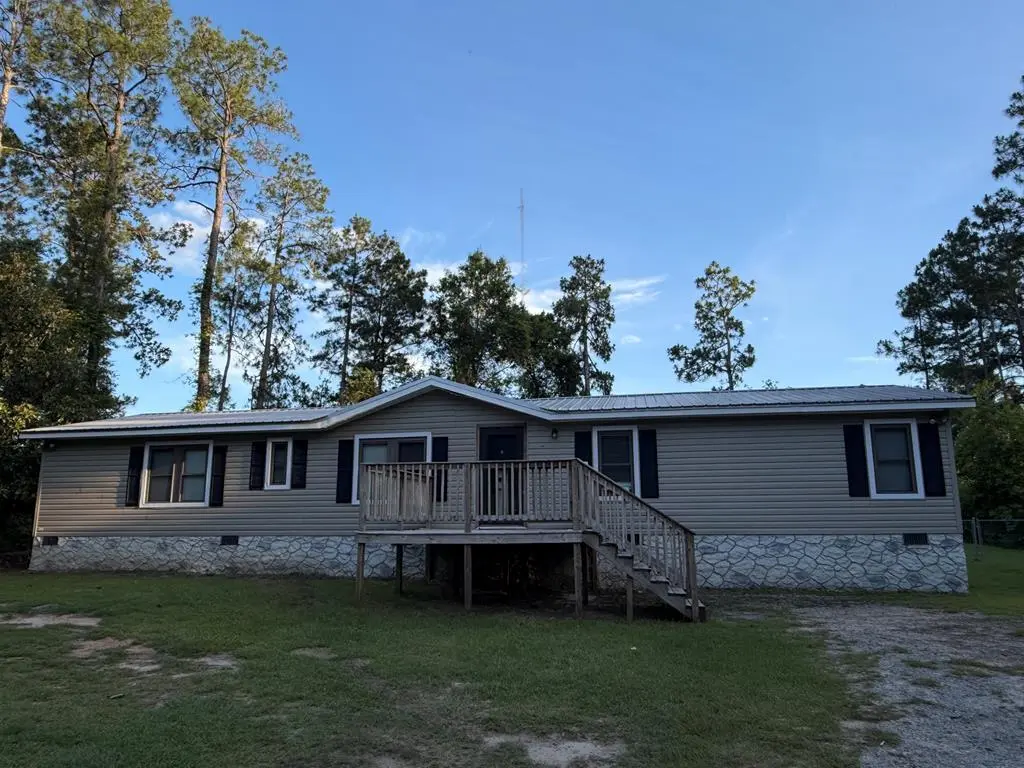
Listing remarks
Nice affordable 3 bed 3 bath mobile home in Tift County close to town. House is accessible from Highway 82. Home is being painted on list date so will be available for showings 6/8/2026.
Key facts
- 0.89 acre lot
- Built 1988
- Listed 3 days
Neighborhood map
What this means for you Summary
Snapshot
- This is a 3-bed/3.0-bath manufactured listed at $165k. Condition is rated fair.
Deal economics
- At list price, monthly cash flow is $-228 ($-3k/yr) — negative.
- To cash-flow at today's rent, offer at most $132k (20.0% below list).
- To meet the 1% rule (rent ≥ 1% of price), the offer needs to be $116k (30.0% below list).
- Recommended offer: $116k (30.0% below list) — sets the bar for 1% rule.
- Cap rate 4.6% vs local median 3.3% in Tifton — top-decile yield for the area; either an underpriced asset or a hidden risk that comps aren't pricing in. Stress-test before assuming the spread holds.
Location & tenants
- Location reads 72/100 on livability (#69 in GA) — a middle-class / working-renter tenant base. Strengths: cost of living A+, health & safety A+; Watch: crime D, commute F, employment D-.
- Tift County (town): math 30% / reading 31% proficiency, ranked #96 of 174 in GA (top 55%) — families likely to look elsewhere, expect single-tenant / working-renter base with shorter leases; 62% free/reduced lunch — lower-income household profile, screen leases tightly.
- Zoned schools: Annie Belle Clark Elementary School (math 38% / reading 39%, grade F, #463 of 1,228 statewide, top 38%, 804 students, 100% FRL); Eighth Street Middle School (math 19% / reading 26%, grade F, #327 of 470 statewide, top 70%, 958 students, 100% FRL); Tift County High School (math 14% / reading 26%, grade F, #232 of 424 statewide, top 56%, 2,273 students, 100% FRL) — zoned schools average 100% FRL vs 62% district-wide (38 pts higher); higher-poverty schools than district average — tighter screening recommended.
- Market conditions: 47 active listings in the ZIP; 1 comparable units currently listed for rent nearby; 176 units permitted in Tift County in 2024 (60 in 5+ unit buildings).
Forward outlook
- Local home prices are declining (-3.0%/yr); year-one equity from $1k of loan paydown is wiped out by about $5k of value loss. Plan a longer hold.
- Tift County population projected to shrink 3% by 2050 — rents likely to lag national; underwrite the cash flow, not the appreciation.
Negotiation context
- Only 3 days on market — expect competitive offers; lowballing is unlikely to land.
Questions for the listing agent
- What do current leases actually rent for vs. the listed asking? Can we see a recent rent roll and the last 12 months of T-12 income?
- Have any recent inspections been done? Can we get a copy of the seller's disclosures and any deferred-maintenance estimates?
- Is there a deadline driving the sale (1031 exchange, divorce, estate, relocation)? That informs how much negotiation room exists.
- Schools are D-rated, which usually means shorter tenancies and higher turnover. Who's the typical renter profile here, and what's been the actual vacancy rate?
- Crime grade is D in this area — have there been break-ins, vandalism, or insurance claims at this property in the last 3 years? What carrier currently insures it and at what premium?
- The area grade is low — what's the realistic commute time and amenity access for the typical tenant pool here? Any planned neighborhood developments (good or bad) we should know about?
- What's the average days-on-market for RENTAL listings here right now (not sales)? A rising rental-DOM trend means longer vacancies and softer asking-rent achievability than the comps imply.
- What's the recent tenant-quality profile in this submarket — average credit score on applications, eviction rate, late-payment / NSF rate, and stable-employment percentage? A property-management company in the area should have these aggregated.
- How much new for-sale + rental construction is in the pipeline within 1–3 miles? Heavy new supply typically softens prices + rents 12–24 months out; constrained supply supports both.
Investment metrics
- 1% rule
- 0.70% ✗
- Cap rate
- 4.64%
- Cash-on-cash
- -5.92%
- DSCR
- 0.74
- GRM
- 11.9
CMA / ARV
No comps found within radius.
Projected returns pro-forma
-3.0% appreciation · 3.0% rent growth · sell at horizon
- IRR
- -26.4%
- Equity multiple
- 0.11×
- Total profit
- $-41,230
- Equity at exit
- $24,602
- IRR
- -23.6%
- Equity multiple
- -0.18×
- Total profit
- $-54,516
- Equity at exit
- $14,266
Cash invested: $46,200 (down + closing). Projections, not guarantees.
Landlord ↔ Tenant lean methodology
- Overall (STATE)
- 90 Strongly Landlord-Friendly
- State Georgia
- 90 Strongly Landlord-Friendly · R+3
- County
- — inherits STATE
- City
- — inherits STATE
ZIP-level market 31793
- Home prices YoY
- -16.3%
- Active inventory
- 47
- Price-to-rent
- 11.9×
Monthly cashflow live
- Estimated rent
- $1,155 medium interval (Pro) →
- Mortgage (P&I)
- −$865
- Tax est. 1.5%
- −$206 /mo · $2,475/yr
- Insurance
- −$69
- HOA
- −$0
- Lot rent leased land?
- −$0
- Vacancy / Maint / Mgmt
- −$243
- Net cashflow
- $-228
Break-even live
Sensitivity live
| Price | -10% $-114 | -5% $-171 | +0% $-228 | +5% $-285 | +10% $-342 |
|---|---|---|---|---|---|
| Rent | -10% $-319 | -5% $-273 | +0% $-228 | +5% $-182 | +10% $-137 |
| Rate | -1.0pp $-145 | -0.5pp $-186 | base $-228 | +0.5pp $-271 | +1.0pp $-314 |
UW: 25.0% down · 7.5% · 30yr · 1.5% tax · 5.0% vac · 8.0% maint · 8.0% mgmt
Financing live
Cash to close
- Down payment
- $41,250
- Closing costs
- $4,950
- Reserves months
- —
- Total cash needed
- —
Loan-product check · same deal, 3 products live
Conventional
25% down · 7.5% · 30yr
- Down + closing
- —
- Monthly P&I
- —
- Monthly cashflow
- —
- DSCR
- —
- Eligible?
- —
Personal DTI + credit; lowest rate.
DSCR
20% down · 8.5% · 30yr
- Down + closing
- —
- Monthly P&I
- —
- Monthly cashflow
- —
- DSCR
- —
- Eligible?
- —
No personal income docs; deal must DSCR.
Hard money
10% down · 12.0% · 12mo
- Down + closing
- —
- Monthly P&I
- —
- Monthly cashflow
- —
- DSCR
- —
- Eligible?
- —
Short-term bridge; refi at stabilization.
Rent comps 1 comps
| Address | Beds | Baths | Sqft | Rent | $/sqft | DOM | Units | Dist |
|---|---|---|---|---|---|---|---|---|
| 24 Salem Church Rd Unit 1 Tifton, GA | 3.0 | 3.0 | 1584 | $1,500 | $0.95 | 46d | 1 | 0.18mi |
Listing history 4 events
-
2026-06-08days on market $165,000 Active 3 DOM
-
2026-06-07days on market $165,000 Active 2 DOM
-
2026-06-07remarks 188-char remark
-
2026-06-07$165,000 Active 1 DOM
ⓘ Source: listings_history table (triggers on properties + properties_extension) + one-shot
backfill from property_details.listing_events for pre-trigger history.
Nearby sold comps map
Loading sold comps map…
Walkable amenities ~0.75 mi
Loading nearby amenities…
Taxation est. · year 1
- Rental income
- $13,860
- − Mortgage interest
- −$9,243
- − Property taxes
- −$2,475
- − Insurance
- −$825
- − Repairs & maintenance
- −$1,109
- − Management
- −$1,109
- − Depreciation
- −$4,800
- Taxable loss
- −$5,700
- Est. tax savings @ 24.0%
- +$1,368
- After-tax cash flow
- $-1,366/yr
For passive investors: Depreciation is non-cash, so a rental often shows a tax loss while cash-flowing — sheltering income. Rental losses are passive: they offset passive income freely, and up to $25,000/yr can offset ordinary (W-2) income if you actively participate and your MAGI is under $100k (phasing out to $0 by $150k); unused losses carry forward. On sale, claimed depreciation is recaptured at up to 25%, and gains may owe capital-gains tax (a 1031 exchange can defer both). Figures are a year-1 estimate at your 24.0% rate — not tax advice; consult a CPA.
Condition & rehab AI · 4 photos
A fair condition mobile home with cosmetic updates needed, including painting and landscaping. Potential for significant value increase with these improvements.
Repairs flagged
- Minor roof — No visible damage, but may need touch-up
- Minor siding — Siding shows some wear
Value-add opportunities
- Both painting — Enhances curb appeal and interior aesthetics
- Both landscaping — Improves curb appeal and enhances property value
Renovation cost estimate screening
| Repair item | Severity | Est. cost |
|---|---|---|
| roof · No visible damage, but may need touch-up | Minor | $500–3,000 |
| siding · Siding shows some wear | Minor | $500–3,000 |
| Total estimated repair cost · 2 items | $1,000–6,000 |
Value-add ROI direction
- Both painting — Enhances curb appeal and interior aesthetics ↑
- Both landscaping — Improves curb appeal and enhances property value ↑
ⓘ Cost ranges are severity-bucket heuristics (US national rule-of-thumb). Get contractor quotes + a written scope before underwriting a rehab budget.
Schools (NCES district)
- District
- Tift County
- NCES district ID
- 1304980
- Math proficiency
- 30% ▼ -5.00%
- Reading proficiency
- 31% ▼ -5.00%
- Median HH income
- $37,497
- Composite
- 25.42/100
- National rank
- #7454
- State rank
- #96 of 174 in GA
Livability — Tifton
- Score
- 72/100
- State rank
- #69
- US rank
- #6288
Category grades
Schools grade is shown separately in the Schools card above.
Census & demographics
- City population
- 26,178
- Population (ZIP)
- 10,276
Population outlook (Tift County) Hauer SSP2
- Today (2025)
- 41,250 people
- By 2030
- 41,146 · -0.3%
- By 2040
- 40,677 · -1.4%
- By 2050
- 39,930 · -3.2%
- By 2075
- 37,078 · -10.1%
- By 2100
- 32,742 · -20.6%
Race, ethnicity, and origin ACS 2023
- Neighborhood character
- Predominantly White (72%)
- Race & ethnicity
- White 72% Hispanic / Latino 13% Black 13% Two or more races 7% Native American 2% Asian 2%
- Hispanic origin (detail)
- Mexican 13%
- Common ancestry
- Slovak 2% Italian 2% German 2%
- Foreign-born
- 8% · Canada, Vietnam
- Languages at home
- 85% English-only · Spanish 12% Vietnamese 1% Other Indo-European 1%
Political lean MEDSL · Tift
- 2024 margin
- Solid R (+35.7) · D 32.0% · R 67.7%
- 2008→2024 swing
- -2.8pp toward R · 2008: -32.8pp · 2024: -35.7pp
- All cycles
- 2024: R+35.7 2020: R+33.6 2016: R+37.4 2012: R+32.6 2008: R+32.8
Not yet ingested
- Civics
- —
Market trends
- HPI YoY
- ▼ -37.04%
- Current HPI
- 190.0421
- Rent YoY
- —
- Metro
- —
- State GDP YoY
- ▲ 2.66%
- F500 in state
- 28
Industry mix (Fortune 500 HQ in GA)
| Industry | F500 HQs | Revenue |
|---|---|---|
| Paper / Packaging | 2 | $29B |
|
||
| Retail | 1 | $160B |
|
||
| Transportation / Logistics | 1 | $91B |
|
||
| Airlines | 1 | $62B |
|
||
| Consumer Goods | 1 | $47B |
|
||
| Utilities | 1 | $25B |
|
||
Price history
1 event — show timeline
- 2026-06-06 Listed $165,000 TBOR
Cash-flow waterfall
monthlySold comps — $/sqft
last 12 mo · ≤1 miLoading sold comps…