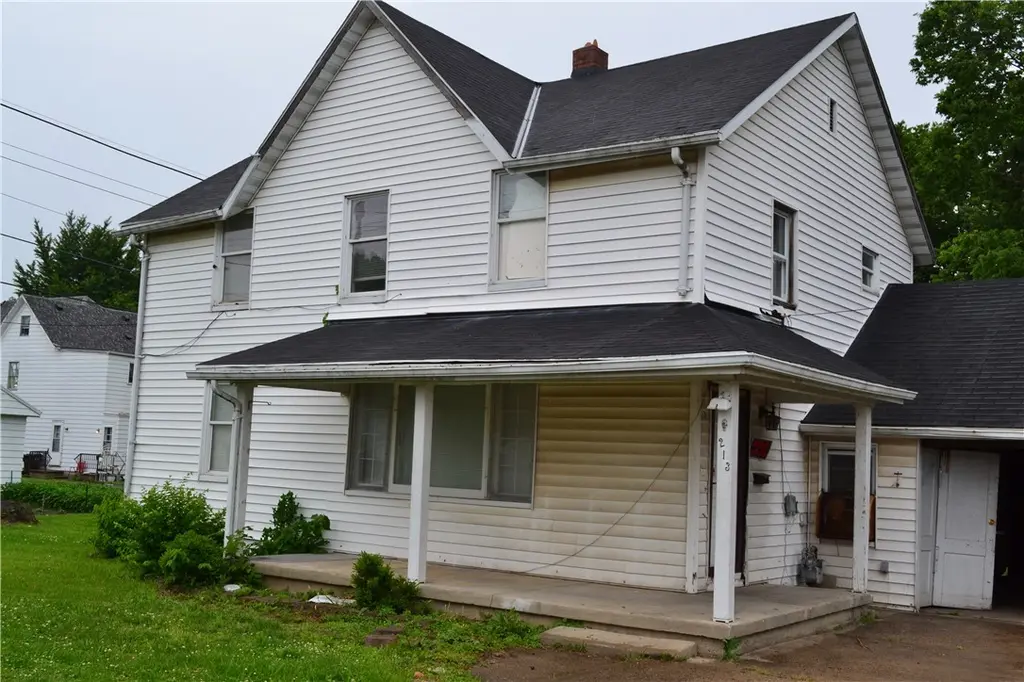
213 South Ave · Franklin, OH
Flood risk 1/10 · Minimal
- FEMA flood zone
- X (unshaded)
- Chance of flooding over 30 yrs
- 0.0%
- Est. flood insurance / yr
- $473 – $860
Fire risk 1/10 · Minimal
- Est. fire insurance / yr
- $713 – $1,323
Heat risk 4/10 · Minor
- Hot days now (above 101°F)
- 7 days/yr
- Hot days in 30 yrs
- 19 days/yr
Wind risk 2/10 · Minimal
- Chance of severe wind over 30 yrs
- 1.0%
Air-quality risk 3/10 · Minor
- Unhealthy air days now
- 2 days/yr
- Unhealthy air days in 30 yrs
- 4 days/yr
Risk factors via First Street. Map © Google.
Why this score? — see what drove the C grade
The composite is a weighted blend of 9 inputs, each scored 0–100. Each bar is that input's sub-score; the figure is the points it added to the 100-point composite (weight × sub-score).
- Cash flow +19.3/30.0
- ARV discount +15.0/15.0
- DSCR +6.1/10.0
- 1% rule +5.0/10.0
- Schools +4.9/10.0
- Rent growth +3.6/5.0
- Livability +3.6/5.0
- Condition / age +2.5/5.0
- Appreciation +0.0/10.0
$170,000
🖨 Deal sheet (PDF) 📄 Offer letter ✓ Due diligence
Listing remarks
Discover an exceptional opportunity to embrace comfortable living in the heart of Franklin. This delightful residence offers ample space and a fantastic foundation for creating your dream home. Enjoy the benefits of a well-established community, providing a welcoming atmosphere for all. This charming property boasts four generously sized bedrooms and two full bathrooms, offering plenty of room for relaxation and daily routines. The two-story layout provides a functional separation of living spaces, enhancing both privacy and communal enjoyment. With 1620 square feet of living area, there is abundant space to personalize and make your own. Situated on a comfortable 0.15-acre lot, the outdoor
Key facts
- 6,534 sq ft lot
- Garage
- Built 1896
Property features AI
Finance
- Financial info: Offered for sale
Exterior
- Parking: Attached one-car garage with additional storage
- Utilities: Natural gas available
- Home design: Two-story house; Cellar foundation
- Construction: Aluminum and vinyl siding
- Exterior features: Residential zoning; Lot recorded by assessor
Interior
- Kitchen: Kitchen on the main level; Breakfast nook on the main level
- Bedrooms: Four bedrooms (three on the second level, one on the main level)
- Bathrooms: Two full bathrooms; One bathroom on the main level
- Heating & cooling: Natural gas heating
- Interior features: Total of 8 rooms; Bonus room on the second level; Family room on the main level
Neighborhood map
What this means for you Summary
Snapshot
- This is a 4-bed/2.0-bath single-family listed at $170k.
Deal economics
- At list price, monthly cash flow is $187 ($2k/yr) — positive.
- The deal already cash-flows at list — no discount required.
- To meet the 1% rule (rent ≥ 1% of price), the offer needs to be $169k (0.3% below list).
- Recommended offer: $167k (1.5% below list) — sets the bar for market timing.
- Cap rate 7.6% vs local median 3.6% in Franklin — top-decile yield for the area; either an underpriced asset or a hidden risk that comps aren't pricing in. Stress-test before assuming the spread holds.
Location & tenants
- Location reads 71/100 on livability (#396 in OH) — a middle-class / working-renter tenant base. Strengths: cost of living A+, housing A+; Watch: health & safety C-, employment D+, amenities D-.
- Franklin City (suburban): math 55% / reading 60% proficiency, ranked #332 of 656 in OH (top 51%) — acceptable for families but not a draw, mixed tenant base, ~2y average lease.
- Zoned schools: Pennyroyal Elementary School (math 57% / reading 52%, grade C, #788 of 1,584 statewide, top 52%, 244 students, 57% FRL); Franklin Junior High School (math 56% / reading 60%, grade B, #297 of 654 statewide, top 46%, 409 students, 47% FRL); Franklin High School (math 42% / reading 69%, grade C, #296 of 781 statewide, top 39%, 701 students, 44% FRL).
- Market conditions: Rents rising fast (+4.2%/yr); 147 active listings in the ZIP; 2 comparable units currently listed for rent nearby; solid renter incomes; 1,224 units permitted in Warren County in 2024 (474 in 5+ unit buildings).
Forward outlook
- Local home prices are declining (-3.0%/yr); year-one equity from $1k of loan paydown is wiped out by about $5k of value loss. Plan a longer hold.
- Warren County population projected at +16% by 2050 — long-run rental-demand tailwind backs the buy-and-hold thesis.
Negotiation context
- It's been on market 25 days — a 2% lower offer ($167k) is reasonable based on typical stale-listing flexibility.
Risks & watch-outs
- Watch-outs: built in 1896 — expect roof / HVAC / electrical / plumbing capex.
Questions for the listing agent
- Built in 1896 — when were the roof, HVAC, electrical panel, plumbing, and water heater last replaced?
- Is there a deadline driving the sale (1031 exchange, divorce, estate, relocation)? That informs how much negotiation room exists.
- Schools are B-rated — typically a magnet for longer-tenancy family renters. What's the average tenant stay here, and is there a school-zone premium baked into asking?
- What's the average days-on-market for RENTAL listings here right now (not sales)? A rising rental-DOM trend means longer vacancies and softer asking-rent achievability than the comps imply.
- What's the recent tenant-quality profile in this submarket — average credit score on applications, eviction rate, late-payment / NSF rate, and stable-employment percentage? A property-management company in the area should have these aggregated.
- How much new for-sale + rental construction is in the pipeline within 1–3 miles? Heavy new supply typically softens prices + rents 12–24 months out; constrained supply supports both.
Investment metrics
- 1% rule
- 1.00% ✗
- Cap rate
- 7.61%
- Cash-on-cash
- 4.72%
- DSCR
- 1.21
- GRM
- 8.4
CMA / ARV
- ARV (on-the-fly)
- $243,000
- Comps found
- 8
Show comp detail 8 sales within ~0.75 mi
| Address | Dist | Beds/Ba | Sqft | Sold | Price | $/sf | Match |
|---|---|---|---|---|---|---|---|
| 8 S River St | 0.33mi | 3/2.0 (-1) | 1,678 (+4%) | 9mo | $177,900 | $106 | 66 |
| 533 Spring Ave | 0.42mi | 3/2.0 (-1) | 1,456 (-10%) | 0mo | $230,000 | $158 | 58 |
| 219 Allen St | 0.54mi | 3/2.0 (-1) | 1,560 (-4%) | 20mo | $197,940 | $127 | 47 |
| 213 Locust St | 0.43mi | 3/2.0 (-1) | 1,408 (-13%) | 8mo | $229,900 | $163 | 47 |
| 10 S River St | 0.37mi | 3/2.0 (-1) | 1,840 (+14%) | 11mo | $185,000 | $101 | 46 |
| 761 S Main St | 0.44mi | 3/2.0 (-1) | 1,747 (+8%) | 20mo | $197,000 | $113 | 45 |
| 315 E Fourth St | 0.56mi | 4/3.0 | 1,482 (-8%) | 18mo | $249,000 | $168 | 40 |
| 339 E 4th St | 0.61mi | 3/2.0 (-1) | 1,735 (+7%) | 18mo | $259,900 | $150 | 40 |
Match score weights: distance 35% · size 25% · config 20% · recency 20%. Top-matched comps best support the ARV.
Projected returns pro-forma
-3.0% appreciation · 4.2% rent growth · sell at horizon
- IRR
- -7.6%
- Equity multiple
- 0.72×
- Total profit
- $-13,544
- Equity at exit
- $25,348
- IRR
- 3.4%
- Equity multiple
- 1.26×
- Total profit
- $12,307
- Equity at exit
- $14,698
Cash invested: $47,600 (down + closing). Projections, not guarantees.
Landlord ↔ Tenant lean methodology
- Overall (STATE)
- 73 Landlord-Friendly
- State Ohio
- 73 Landlord-Friendly · R+6
- County
- — inherits STATE
- City
- — inherits STATE
ZIP-level market 45005
- Rents YoY
- 4.2%
- Active inventory
- 147
- Price-to-rent
- 8.4×
Monthly cashflow live
- Estimated rent
- $1,694 medium interval (Pro) →
- Mortgage (P&I)
- −$891
- Tax from tax record
- −$189 /mo · $2,265/yr
- Insurance
- −$71
- HOA
- −$0
- Lot rent
- −$0
- Vacancy / Maint / Mgmt
- −$356
- Net cashflow
- $187
Break-even live
Sensitivity live
| Price | -10% $283 | -5% $235 | +0% $187 | +5% $139 | +10% $91 |
|---|---|---|---|---|---|
| Rent | -10% $53 | -5% $120 | +0% $187 | +5% $254 | +10% $321 |
| Rate | -1.0pp $273 | -0.5pp $230 | base $187 | +0.5pp $143 | +1.0pp $98 |
UW: 25.0% down · 7.5% · 30yr · 1.5% tax · 5.0% vac · 8.0% maint · 8.0% mgmt
Financing live
Cash to close
- Down payment
- $42,500
- Closing costs
- $5,100
- Reserves months
- —
- Total cash needed
- —
Loan-product check · same deal, 3 products live
Conventional
25% down · 7.5% · 30yr
- Down + closing
- —
- Monthly P&I
- —
- Monthly cashflow
- —
- DSCR
- —
- Eligible?
- —
Personal DTI + credit; lowest rate.
DSCR
20% down · 8.5% · 30yr
- Down + closing
- —
- Monthly P&I
- —
- Monthly cashflow
- —
- DSCR
- —
- Eligible?
- —
No personal income docs; deal must DSCR.
Hard money
10% down · 12.0% · 12mo
- Down + closing
- —
- Monthly P&I
- —
- Monthly cashflow
- —
- DSCR
- —
- Eligible?
- —
Short-term bridge; refi at stabilization.
Rent comps 2 comps
| Address | Beds | Baths | Sqft | Rent | $/sqft | DOM | Units | Dist |
|---|---|---|---|---|---|---|---|---|
| 381 Sherman Dr Franklin, OH | 3.0 | 3.5 | 1344 | $1,995 | $1.48 | 26d | 1 | 1.31mi |
| 1 Deardoff Rd Franklin, OH | 3.0 | 1.0 | 1250 | $1,550 | $1.24 | 18d | 1 | 1.41mi |
Listing history 16 events
-
2026-06-22days on market $170,000 Active 25 DOM
-
2026-06-21days on market $170,000 Active 24 DOM
-
2026-06-18days on market $170,000 Active 21 DOM
-
2026-06-17days on market $170,000 Active 20 DOM
-
2026-06-16days on market $170,000 Active 19 DOM
-
2026-06-15days on market $170,000 Active 18 DOM
-
2026-06-13days on market $170,000 Active 16 DOM
-
2026-06-09days on market $170,000 Active 12 DOM
-
2026-06-08statusdays on market $170,000 Active 11 DOM
-
2026-06-07days on market $170,000 ActiveUnderContract 10 DOM
-
2026-06-03days on market $170,000 ActiveUnderContract 6 DOM
-
2026-06-02days on market $170,000 ActiveUnderContract 5 DOM
-
2026-06-01days on market $170,000 ActiveUnderContract 4 DOM
-
2026-05-31days on market $170,000 ActiveUnderContract 3 DOM
-
2026-05-28historical ActiveUnderContract
-
2026-05-23$130,000 Active
ⓘ Source: listings_history table (triggers on properties + properties_extension) + one-shot
backfill from property_details.listing_events for pre-trigger history.
Tax reassessment forecast OH · Partial reset (capped growth)
- Current annual tax
- $2,265 · $189/mo
- Projected year-2 tax
- $2,459 · $205/mo
- Expected delta
- +$193/yr (+$16/mo · 8.5%)
ⓘ Screening estimate from a state-policy table — verify with the county assessor before closing.
Climate risk First Street
- Flood 1/10 Low FEMA zone X (unshaded) · 0% chance over 30 yrs
- Wildfire 1/10 Low
- Heat 4/10 Moderate 7 d/yr ≥101°F today · 19 d/yr by 30 yrs out
- Wind 2/10 Low 100% chance of damaging wind over 30 yrs
- Air quality 3/10 Moderate 2 unhealthy d/yr today · 4 by 30 yrs out
Nearby sold comps map
Loading sold comps map…
Walkable amenities ~0.75 mi
Loading nearby amenities…
Taxation est. · year 1
- Rental income
- $20,329
- − Mortgage interest
- −$9,523
- − Property taxes
- −$2,265
- − Insurance
- −$850
- − Repairs & maintenance
- −$1,626
- − Management
- −$1,626
- − Depreciation
- −$4,945
- Taxable loss
- −$507
- Est. tax savings @ 24.0%
- +$122
- After-tax cash flow
- $2,368/yr
For passive investors: Depreciation is non-cash, so a rental often shows a tax loss while cash-flowing — sheltering income. Rental losses are passive: they offset passive income freely, and up to $25,000/yr can offset ordinary (W-2) income if you actively participate and your MAGI is under $100k (phasing out to $0 by $150k); unused losses carry forward. On sale, claimed depreciation is recaptured at up to 25%, and gains may owe capital-gains tax (a 1031 exchange can defer both). Figures are a year-1 estimate at your 24.0% rate — not tax advice; consult a CPA.
Schools (NCES district)
- District
- Franklin City
- NCES district ID
- 3904400
- Math proficiency
- 55% ▼ -8.00%
- Reading proficiency
- 60% ▼ -5.00%
- Median HH income
- $48,983
- Composite
- 48.89/100
- National rank
- #2081
- State rank
- #332 of 656 in OH
Livability — Franklin
- Score
- 71/100
- State rank
- #396
- US rank
- #6546
Category grades
Schools grade is shown separately in the Schools card above.
Census & demographics
- Census place
- Franklin, OH
- County
- Warren County · 196,906 people
- City population
- 32,251
- Metro
- Cincinnati, OH-KY-IN
- Population (ZIP)
- 32,251
- Household income
- $75,399
- Rent vs Own
- Severe rent burden
- 811.0
Population outlook (Warren County) Hauer SSP2
- Today (2025)
- 248,603 people
- By 2030
- 259,345 · +4.3%
- By 2040
- 277,666 · +11.7%
- By 2050
- 289,599 · +16.5%
- By 2075
- 311,681 · +25.4%
- By 2100
- 302,738 · +21.8%
Race, ethnicity, and origin ACS 2023
- Neighborhood character
- Predominantly White (90%)
- Race & ethnicity
- White 90% Two or more races 4% Hispanic / Latino 3% Asian 3%
- Common ancestry
- Slovak 3% Italian 2% Romanian 2%
- Foreign-born
- 3% · China, Canada
- Languages at home
- 95% English-only · Spanish 2% Other Indo-European 1% Chinese 1%
Political lean MEDSL · Warren
- 2024 margin
- Solid R (+31.5) · D 33.8% · R 65.3%
- 2008→2024 swing
- +4.5pp toward D · 2008: -36.1pp · 2024: -31.5pp
- All cycles
- 2024: R+31.5 2020: R+30.8 2016: R+37.6 2012: R+39.5 2008: R+36.1
Not yet ingested
- Civics
- —
Market trends
- HPI YoY
- ▼ -192.03%
- Current HPI
- 235.1612
- Rent YoY
- ▲ 4.20%
- Metro
- Cincinnati, OH-KY-IN
- State GDP YoY
- ▲ 1.98%
- F500 in state
- 48
Industry mix (Fortune 500 HQ in OH)
| Industry | F500 HQs | Revenue |
|---|---|---|
| Insurance | 3 | $145B |
|
||
| Industrial Machinery | 3 | $49B |
|
||
| Financial Services | 3 | $24B |
|
||
| Consumer Goods | 2 | $93B |
|
||
| Aerospace / Defense | 2 | $47B |
|
||
| Utilities | 2 | $33B |
|
||
Price history
2 events — show timeline
- 2026-05-28 Contingent — Dayton MLS
- 2026-05-23 Listed $130,000 Dayton MLS
Property tax history
+5.4%/yrLatest (2025): $2,265 · +8.3% YoY. Source: county tax records.
Cash-flow waterfall
monthlySold comps — $/sqft
last 12 mo · ≤1 miLoading sold comps…