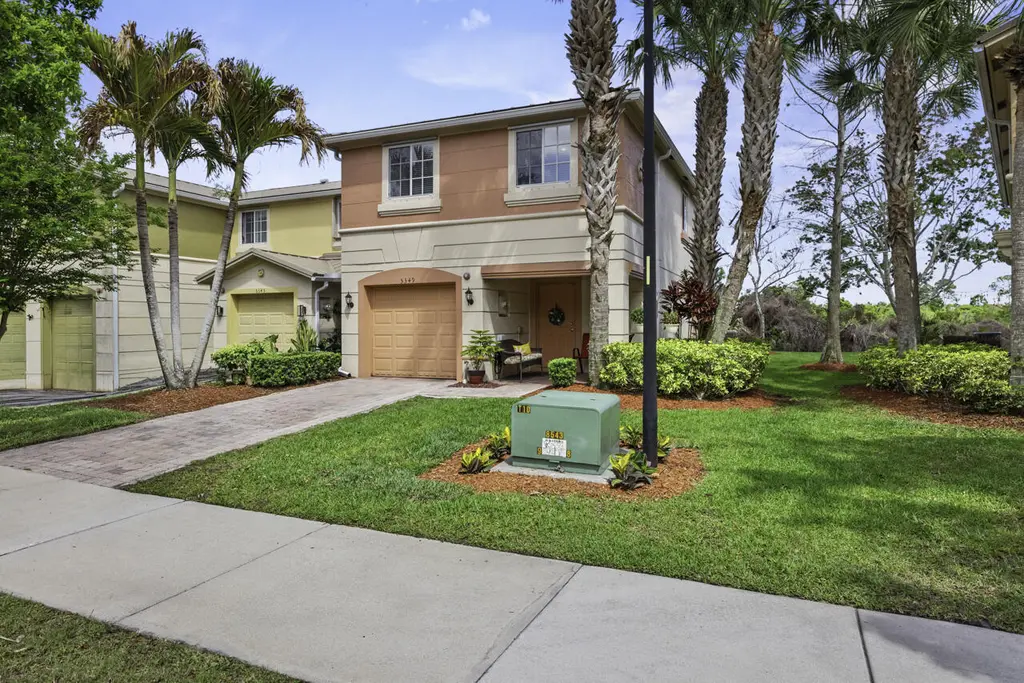
5349 SE Jennings Ln · Palm City, FL
Flood risk 1/10 · Minimal
- FEMA flood zone
- X (unshaded)
- Chance of flooding over 30 yrs
- 0.0%
- Est. flood insurance / yr
- $507 – $1,088
Fire risk 4/10 · Minor
- Est. fire insurance / yr
- $947 – $1,759
Heat risk 10/10 · Severe
- Hot days now (above 106°F)
- 7 days/yr
- Hot days in 30 yrs
- 24 days/yr
Wind risk 10/10 · Severe
- Chance of severe wind over 30 yrs
- 99.0%
Air-quality risk 2/10 · Minimal
- Unhealthy air days now
- 1 days/yr
- Unhealthy air days in 30 yrs
- 1 days/yr
Risk factors via First Street. Map © Google.
Why this score? — see what drove the D- grade
The composite is a weighted blend of 9 inputs, each scored 0–100. Each bar is that input's sub-score; the figure is the points it added to the 100-point composite (weight × sub-score).
- Cash flow +12.8/30.0
- Schools +4.5/10.0
- ARV discount +4.4/15.0
- Livability +4.0/5.0
- DSCR +3.8/10.0
- 1% rule +3.6/10.0
- Rent growth +3.2/5.0
- Condition / age +2.5/5.0
- Appreciation +0.0/10.0
$345,000
🖨 Deal sheet (PDF) 📄 Offer letter ✓ Due diligence
Listing remarks MLS
Spacious and well-maintained townhome in a quiet, desirable community offering privacy and open green space rarely found at this price point. Bright, open layout flows to a private patio overlooking a peaceful preserve. Oversized primary suite with en-suite bath, plus flexible guest rooms or office space. Move-in ready with neutral finishes, soft-close kitchen cabinets, and granite window sills throughout. Roof installed 2025 and air handler 2017. HOA covers exterior maintenance including roof and building pressure washing, front and rear landscaping, shrub and tree trimming, weed control, and mulch. Ideal as a primary residence, seasonal home, or investment opportunity.
Key facts
- $301 HOA
- Garage
- Community pool
Neighborhood map
What this means for you Summary
Snapshot
- This is a 3-bed/2.5-bath townhouse listed at $345k.
Deal economics
- At list price, monthly cash flow is $-34 ($-408/yr) — negative.
- To cash-flow at today's rent, offer at most $339k (1.7% below list).
- To meet the 1% rule (rent ≥ 1% of price), the offer needs to be $295k (14.5% below list).
- Recommended offer: $295k (14.5% below list) — sets the bar for 1% rule.
- Cap rate 6.2% vs local median 2.6% in Palm City — top-decile yield for the area; either an underpriced asset or a hidden risk that comps aren't pricing in. Stress-test before assuming the spread holds.
Location & tenants
- Location reads 79/100 on livability (#140 in FL, #2,113 nationally) — a middle-class / working-renter tenant base. Strengths: crime A+, employment A+, housing A+; Watch: amenities F, commute F, cost of living F.
- Martin (suburban): math 52% / reading 53% proficiency, ranked #24 of 73 in FL (top 33%) — acceptable for families but not a draw, mixed tenant base, ~2y average lease.
- Zoned schools: Pinewood Elementary School (math 37% / reading 39%, grade F, #1,587 of 2,144 statewide, top 74%, 726 students, 64% FRL); Dr. David L. Anderson Middle School (math 51% / reading 46%, grade C-, #274 of 571 statewide, top 50%, 1,035 students, 63% FRL); Martin County High School (math 45% / reading 54%, grade D, #179 of 667 statewide, top 29%, 2,273 students, 42% FRL) — zoned schools average 56% FRL vs 41% district-wide (16 pts higher); higher-poverty schools than district average — tighter screening recommended.
- Market conditions: Rents rising (+2.7%/yr); 595 active listings in the ZIP; 15 comparable units currently listed for rent nearby; rentals at typical pace (median 26d on market — plan ~3-4 weeks tenant-placement turnaround); solid renter incomes; 737 units permitted in Martin County in 2024 (167 in 5+ unit buildings).
- At $2,951/mo this rent would consume 45% of the median local household income ($78k/yr) (locally 1323% of renters already pay >50% of income on rent) — very limited rent-growth headroom before tenants either downsize or default.
Forward outlook
- Local home prices are declining (-3.0%/yr); year-one equity from $2k of loan paydown is wiped out by about $10k of value loss. Plan a longer hold.
- Martin County population projected at +19% by 2050 — long-run rental-demand tailwind backs the buy-and-hold thesis.
Negotiation context
- It's been on market 53 days — a 3% lower offer ($335k) is reasonable based on typical stale-listing flexibility.
- 4 sale attempts since 17y ago with the ask held roughly flat each time — persistent listings suggest the price (not the market) is what's stuck; bring a comps-based counter.
- Current owner paid $130k; list at $345k implies a 165% gain — meaningful room to come down on a strong offer.
Risks & watch-outs
- Climate carrying-cost: severe wind risk, 99% chance of damaging wind over 30y; extreme-heat days projected 7→24/yr by 2055 (HVAC capex compounding) — expect insurance premiums to compound above CPI over the hold.
Questions for the listing agent
- What do current leases actually rent for vs. the listed asking? Can we see a recent rent roll and the last 12 months of T-12 income?
- It's been on market 53 days. Have you received any prior offers? Is the seller open to a 14% concession, seller financing, or rate buy-down credit?
- What does the HOA fee cover, when was the last increase, and are there any pending special assessments or reserve-fund shortfalls?
- Is there a deadline driving the sale (1031 exchange, divorce, estate, relocation)? That informs how much negotiation room exists.
- Schools are A-rated — typically a magnet for longer-tenancy family renters. What's the average tenant stay here, and is there a school-zone premium baked into asking?
- The area grade is low — what's the realistic commute time and amenity access for the typical tenant pool here? Any planned neighborhood developments (good or bad) we should know about?
- What's the average days-on-market for RENTAL listings here right now (not sales)? A rising rental-DOM trend means longer vacancies and softer asking-rent achievability than the comps imply.
- What's the recent tenant-quality profile in this submarket — average credit score on applications, eviction rate, late-payment / NSF rate, and stable-employment percentage? A property-management company in the area should have these aggregated.
- How much new for-sale + rental construction is in the pipeline within 1–3 miles? Heavy new supply typically softens prices + rents 12–24 months out; constrained supply supports both.
Investment metrics
- 1% rule
- 0.86% ✗
- Cap rate
- 6.17%
- Cash-on-cash
- -0.42%
- DSCR
- 0.98
- GRM
- 9.7
CMA / ARV
- ARV (median comp)
- $322,455
- List price
- $345,000
- Delta
- 6.99%
- Verdict
- FAIR
- Comps
- 20 within 1.0 mi
Show comp detail 6 sales within ~0.75 mi
| Address | Dist | Beds/Ba | Sqft | Sold | Price | $/sf | Match |
|---|---|---|---|---|---|---|---|
| 296 SE Bloxham Way | 0.28mi | 3/2.5 | 1,868 (0%) | 1mo | $340,000 | $182 | 86 |
| 5424 SE Jennings Ln | 0.11mi | 3/2.5 | 1,868 (0%) | 12mo | $355,000 | $190 | 84 |
| 5265 SE Jennings Ln | 0.09mi | 3/2.5 | 1,868 (0%) | 20mo | $380,000 | $203 | 79 |
| 328 SE Bloxham Way | 0.29mi | 4/3.0 (+1) | 1,899 (+2%) | 12mo | $337,000 | $177 | 67 |
| 5371 SE Moseley Drive Dr | 0.16mi | 4/2.5 (+1) | 1,699 (-9%) | 14mo | $335,000 | $197 | 61 |
| 392 SE Bloxham Way | 0.22mi | 4/3.0 (+1) | 1,699 (-9%) | 16mo | $335,000 | $197 | 55 |
Match score weights: distance 35% · size 25% · config 20% · recency 20%. Top-matched comps best support the ARV.
Projected returns pro-forma
-3.0% appreciation · 2.71% rent growth · sell at horizon
- IRR
- -17.3%
- Equity multiple
- 0.39×
- Total profit
- $-58,898
- Equity at exit
- $51,441
- IRR
- -9.8%
- Equity multiple
- 0.41×
- Total profit
- $-57,447
- Equity at exit
- $29,829
Cash invested: $96,600 (down + closing). Projections, not guarantees.
Landlord ↔ Tenant lean methodology
- Overall (STATE)
- 87 Strongly Landlord-Friendly
- State Florida
- 87 Strongly Landlord-Friendly · R+3
- County
- — inherits STATE
- City
- — inherits STATE
ZIP-level market 34997
- Rents YoY
- 2.7%
- Active inventory
- 595
- Price-to-rent
- 9.7×
Monthly cashflow live
- Estimated rent
- $2,951 high interval (Pro) →
- Mortgage (P&I)
- −$1,809
- Tax from tax record
- −$111 /mo · $1,332/yr
- Insurance
- −$144
- HOA
- −$301
- Vacancy / Maint / Mgmt
- −$620
- Net cashflow
- $-34
Break-even live
Sensitivity live
| Price | -10% $161 | -5% $64 | +0% $-34 | +5% $-132 | +10% $-229 |
|---|---|---|---|---|---|
| Rent | -10% $-267 | -5% $-151 | +0% $-34 | +5% $83 | +10% $199 |
| Rate | -1.0pp $140 | -0.5pp $54 | base $-34 | +0.5pp $-123 | +1.0pp $-214 |
UW: 25.0% down · 7.5% · 30yr · 1.5% tax · 5.0% vac · 8.0% maint · 8.0% mgmt
Financing live
Cash to close
- Down payment
- $86,250
- Closing costs
- $10,350
- Reserves months
- —
- Total cash needed
- —
Loan-product check · same deal, 3 products live
Conventional
25% down · 7.5% · 30yr
- Down + closing
- —
- Monthly P&I
- —
- Monthly cashflow
- —
- DSCR
- —
- Eligible?
- —
Personal DTI + credit; lowest rate.
DSCR
20% down · 8.5% · 30yr
- Down + closing
- —
- Monthly P&I
- —
- Monthly cashflow
- —
- DSCR
- —
- Eligible?
- —
No personal income docs; deal must DSCR.
Hard money
10% down · 12.0% · 12mo
- Down + closing
- —
- Monthly P&I
- —
- Monthly cashflow
- —
- DSCR
- —
- Eligible?
- —
Short-term bridge; refi at stabilization.
Rent comps 15 comps
| Address | Beds | Baths | Sqft | Rent | $/sqft | DOM | Units | Dist |
|---|---|---|---|---|---|---|---|---|
| 5372 SE Jennings Ln Stuart, FL | 2.0 | 2.5 | 1296 | $2,200 | $1.70 | 25d | 1 | 0.07mi |
| 801 SE Trammell Trce Stuart, FL | 4.0 | 2.0 | 1600 | $3,000 | $1.88 | 25d | 1 | 0.16mi |
| 404 SE Bloxham Way Stuart, FL | 2.0 | 2.5 | 1532 | $2,150 | $1.40 | 25d | 1 | 0.23mi |
| 5946 SE Skyblue Cir Stuart, FL | 4.0 | 2.0 | 2033 | $3,950 | $1.94 | 25d | 1 | 0.27mi |
| 356 SE Bloxham Way Stuart, FL | 4.0 | 3.0 | 1699 | $3,000 | $1.77 | 25d | 1 | 0.28mi |
| 6007 SE Skyblue Cir Stuart, FL | 4.0 | 2.0 | 2033 | $4,000 | $1.97 | 25d | 1 | 0.35mi |
| 5795 SE Skyblue Cir Stuart, FL | 4.0 | 2.0 | 2032 | $4,500 | $2.21 | 16d | 1 | 0.42mi |
| 4645 SE Bridgetown Ct Stuart, FL | 3.0 | 2.0 | 1657 | $3,200 | $1.93 | 16d | 1 | 0.82mi |
| 262 SW Walking Path Unit 262 Stuart, FL | 3.0 | 2.5 | 2164 | $2,500 | $1.16 | 16d | 1 | 0.94mi |
| 5784 SE Edgewater Cir Stuart, FL | 3.0 | 2.5 | 1804 | $3,000 | $1.66 | 16d | 1 | 0.95mi |
| 829 SE Westminster Pl Stuart, FL | 3.0 | 2.0 | 2026 | $3,300 | $1.63 | 25d | 1 | 0.98mi |
| 173 SW Otter Run Pl Stuart, FL | 3.0 | 2.5 | 1753 | $2,350 | $1.34 | 25d | 1 | 1.04mi |
| 907 SE Westminster Pl Stuart, FL | 4.0 | 2.5 | 2218 | $3,500 | $1.58 | 25d | 1 | 1.07mi |
| 3800 S Kanner Hwy Stuart, FL | 3.0 | 1.0–2.0 | 970 | $2,942 | $3.03 | 16d | 21 | 1.32mi |
| 522 SW Timber Trl Stuart, FL | 3.0 | 2.5 | 1979 | $3,500 | $1.77 | 25d | 1 | 1.43mi |
HOA detail
- Monthly dues
- $301 · $3,612/yr
- Likely covers
- landscapingexterior maint.
Listing history 25 events
-
2026-06-10status $345,000 Pending 53 DOM
-
2026-06-09days on market $345,000 Active Under Contract 53 DOM
-
2026-06-08days on market $345,000 Active Under Contract 52 DOM
-
2026-06-07days on market $345,000 Active Under Contract 51 DOM
-
2026-06-03days on market $345,000 Active Under Contract 47 DOM
-
2026-06-02days on market $345,000 Active Under Contract 46 DOM
-
2026-06-01days on market $345,000 Active Under Contract 45 DOM
-
2026-05-31days on market $345,000 Active Under Contract 44 DOM
-
2026-05-31days on market $345,000 Active Under Contract 43 DOM
-
2026-05-17historical Active Under Contract 679-char remark
Show marketing remark (679 chars)
Spacious and well-maintained townhome in a quiet, desirable community offering privacy and open green space rarely found at this price point. Bright, open layout flows to a private patio overlooking a peaceful preserve. Oversized primary suite with en-suite bath, plus flexible guest rooms or office space. Move-in ready with neutral finishes, soft-close kitchen cabinets, and granite window sills throughout. Roof installed 2025 and air handler 2017. HOA covers exterior maintenance including roof and building pressure washing, front and rear landscaping, shrub and tree trimming, weed control, and mulch. Ideal as a primary residence, seasonal home, or investment opportunity.
-
2026-05-03price $345,000 679-char remark
Show marketing remark (679 chars)
Spacious and well-maintained townhome in a quiet, desirable community offering privacy and open green space rarely found at this price point. Bright, open layout flows to a private patio overlooking a peaceful preserve. Oversized primary suite with en-suite bath, plus flexible guest rooms or office space. Move-in ready with neutral finishes, soft-close kitchen cabinets, and granite window sills throughout. Roof installed 2025 and air handler 2017. HOA covers exterior maintenance including roof and building pressure washing, front and rear landscaping, shrub and tree trimming, weed control, and mulch. Ideal as a primary residence, seasonal home, or investment opportunity.
-
2026-04-17$354,000 Active 679-char remark
Show marketing remark (679 chars)
Spacious and well-maintained townhome in a quiet, desirable community offering privacy and open green space rarely found at this price point. Bright, open layout flows to a private patio overlooking a peaceful preserve. Oversized primary suite with en-suite bath, plus flexible guest rooms or office space. Move-in ready with neutral finishes, soft-close kitchen cabinets, and granite window sills throughout. Roof installed 2025 and air handler 2017. HOA covers exterior maintenance including roof and building pressure washing, front and rear landscaping, shrub and tree trimming, weed control, and mulch. Ideal as a primary residence, seasonal home, or investment opportunity.
-
2026-03-10historical
-
2026-02-22price $359,000
-
2025-12-08price $373,900
-
2025-10-14price $379,000
-
2025-09-10$385,000 Active
-
2016-01-11price $130,000
-
2010-08-09soldstatus $130,000
-
2010-08-06soldstatus $130,000
-
2010-08-06price $135,000
-
2010-06-25$135,000
-
2009-06-24price $113,355
-
2009-06-24soldstatus $109,000
-
2009-06-11$109,000
ⓘ Source: listings_history table (triggers on properties + properties_extension) + one-shot
backfill from property_details.listing_events for pre-trigger history.
Tax reassessment forecast FL · Resets to sale price
- Current annual tax
- $1,332 · $111/mo
- Projected year-2 tax
- $2,864 · $239/mo
- Expected delta
- +$1,531/yr (+$128/mo · 115.0%)
ⓘ Screening estimate from a state-policy table — verify with the county assessor before closing.
Climate risk First Street
- Flood 1/10 Low FEMA zone X (unshaded) · 0% chance over 30 yrs
- Wildfire 4/10 Moderate
- Heat 10/10 Extreme 7 d/yr ≥106°F today · 24 d/yr by 30 yrs out
- Wind 10/10 Extreme 99% chance of damaging wind over 30 yrs
- Air quality 2/10 Low 1 unhealthy d/yr today · 1 by 30 yrs out
Nearby sold comps map
Loading sold comps map…
Walkable amenities ~0.75 mi
Loading nearby amenities…
Taxation est. · year 1
- Rental income
- $35,407
- − Mortgage interest
- −$19,325
- − Property taxes
- −$1,332
- − Insurance
- −$1,725
- − Repairs & maintenance
- −$2,833
- − Management
- −$2,833
- − HOA
- −$3,612
- − Depreciation
- −$10,036
- Taxable loss
- −$6,289
- Est. tax savings @ 24.0%
- +$1,509
- After-tax cash flow
- $1,101/yr
For passive investors: Depreciation is non-cash, so a rental often shows a tax loss while cash-flowing — sheltering income. Rental losses are passive: they offset passive income freely, and up to $25,000/yr can offset ordinary (W-2) income if you actively participate and your MAGI is under $100k (phasing out to $0 by $150k); unused losses carry forward. On sale, claimed depreciation is recaptured at up to 25%, and gains may owe capital-gains tax (a 1031 exchange can defer both). Figures are a year-1 estimate at your 24.0% rate — not tax advice; consult a CPA.
Schools (NCES district)
- District
- Martin
- NCES district ID
- 1201290
- Math proficiency
- 52% ▼ -14.00%
- Reading proficiency
- 53% ▼ -4.00%
- Median HH income
- $52,482
- Composite
- 45.1/100
- National rank
- #2690
- State rank
- #24 of 73 in FL
Livability — Palm City
- Score
- 79/100
- State rank
- #140
- US rank
- #2113
Category grades
Schools grade is shown separately in the Schools card above.
Census & demographics
- County
- Martin County · 165,223 people
- City population
- 30,592
- Metro
- Port St. Lucie, FL
- Population (ZIP)
- 47,075
- Household income
- $78,136
- Rent vs Own
- Severe rent burden
- 1323.0
Population outlook (Martin County) Hauer SSP2
- Today (2025)
- 172,383 people
- By 2030
- 180,192 · +4.5%
- By 2040
- 194,114 · +12.6%
- By 2050
- 204,992 · +18.9%
- By 2075
- 229,641 · +33.2%
- By 2100
- 232,146 · +34.7%
Race, ethnicity, and origin ACS 2023
- Neighborhood character
- Predominantly White (74%)
- Race & ethnicity
- White 74% Hispanic / Latino 19% Two or more races 9% Black 3% Asian 1%
- Hispanic origin (detail)
- Mexican 4% Puerto Rican 2% Cuban 3%
- Common ancestry
- Romanian 3% Lithuanian 3% Slovak 2%
- Foreign-born
- 14% · Canada, Jamaica, China
- Languages at home
- 81% English-only · Spanish 14% French/Haitian/Cajun 2% Other Indo-European 1%
Political lean MEDSL · Martin
- 2024 margin
- Solid R (+31.1) · D 34.1% · R 65.2%
- 2008→2024 swing
- -17.5pp toward R · 2008: -13.6pp · 2024: -31.1pp
- All cycles
- 2024: R+31.1 2020: R+24.6 2016: R+26.9 2012: R+22.9 2008: R+13.6
Not yet ingested
- Civics
- —
Market trends
- HPI YoY
- ▼ -319.78%
- Current HPI
- 336.7717
- Rent YoY
- ▲ 2.71%
- Metro
- Port St. Lucie, FL
- State GDP YoY
- ▲ 3.28%
- F500 in state
- 36
Industry mix (Fortune 500 HQ in FL)
| Industry | F500 HQs | Revenue |
|---|---|---|
| Industrial Technology | 2 | $29B |
|
||
| Insurance | 2 | $17B |
|
||
| Retail | 1 | $60B |
|
||
| Technology Distribution | 1 | $58B |
|
||
| Homebuilding | 1 | $35B |
|
||
| Technology Manufacturing | 1 | $35B |
|
||
Price history
+216.5% since first listed16 events — show timeline
- 2026-05-17 Contingent — Beaches MLS
- 2026-05-03 Price Changed $345,000 Beaches MLS
- 2026-04-17 Listed $354,000 Beaches MLS
- 2026-03-10 Listing Removed — Beaches MLS
- 2026-02-22 Price Changed $359,000 Beaches MLS
- 2025-12-08 Price Changed $373,900 Beaches MLS
- 2025-10-14 Price Changed $379,000 Beaches MLS
- 2025-09-10 Listed $385,000 Beaches MLS
- 2016-01-11 Price Changed $130,000 MCRTC
- 2010-08-09 Sold (Public Records) $130,000 Public Records
- 2010-08-06 Price Changed $135,000 MCRTC
- 2010-08-06 Sold (MLS) $130,000 MCRTC
- 2010-06-25 Listed $135,000 MCRTC
- 2009-06-24 Sold (MLS) $109,000 MCRTC
- 2009-06-24 Price Changed $113,355 MCRTC
- 2009-06-11 Listed $109,000 MCRTC
Property tax history
+1.8%/yrLatest (2025): $1,332 · +5.6% YoY. Source: county tax records.
Cash-flow waterfall
monthlySold comps — $/sqft
last 12 mo · ≤1 miLoading sold comps…