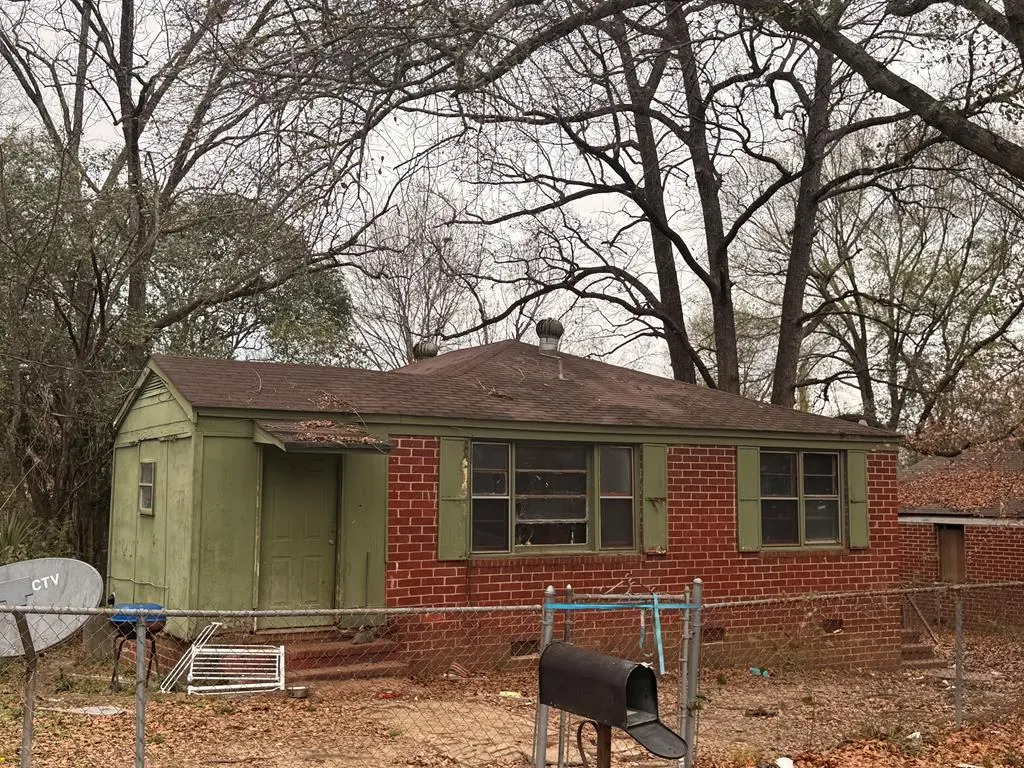
3433 Marathon Dr · Columbus, GA
Flood risk 6/10 · Moderate
- FEMA flood zone
- X (unshaded)
- Chance of flooding over 30 yrs
- 0.72%
- Est. flood insurance / yr
- $507 – $1,088
Fire risk 3/10 · Minor
- Est. fire insurance / yr
- $963 – $1,789
Heat risk 7/10 · Major
- Hot days now (above 107°F)
- 7 days/yr
- Hot days in 30 yrs
- 19 days/yr
Wind risk 6/10 · Moderate
- Chance of severe wind over 30 yrs
- 76.0%
Air-quality risk 4/10 · Minor
- Unhealthy air days now
- 4 days/yr
- Unhealthy air days in 30 yrs
- 5 days/yr
Risk factors via First Street. Map © Google.
Why this score? — see what drove the B grade
The composite is a weighted blend of 9 inputs, each scored 0–100. Each bar is that input's sub-score; the figure is the points it added to the 100-point composite (weight × sub-score).
- Cash flow +30.0/30.0
- ARV discount +11.0/15.0
- 1% rule +10.0/10.0
- DSCR +10.0/10.0
- Livability +3.2/5.0
- Rent growth +3.0/5.0
- Condition / age +2.5/5.0
- Schools +2.2/10.0
- Appreciation +0.0/10.0
$60,000
🖨 Deal sheet (PDF) 📄 Offer letter ✓ Due diligence
Listing remarks MLS
Investor opportunity! 3433 Marathon Dr is a tenant-occupied 3BR/1BA home offering 952 sqft on a 0.19-acre lot—ideal for investors seeking a cash-flowing addition to their portfolio. Convenient location near schools, parks, shopping, dining, major roadways, and minutes to Fort Moore and other key employment hubs supporting strong rental demand. Sold As-Is.
Key facts
- Near schools
- Near dining
- Near shopping
Tags
Neighborhood map
What this means for you Summary
Snapshot
- This is a 3-bed/1.0-bath single-family listed at $60k.
Deal economics
- At list price, monthly cash flow is $411 ($5k/yr) — positive.
- The deal already cash-flows at list — no discount required.
- Meets the 1% rule at list price ($992 rent vs $60k).
- Recommended offer: $53k (12.0% below list) — sets the bar for market timing.
- Cap rate 14.5% vs local median 4.7% in Columbus — top-decile yield for the area; either an underpriced asset or a hidden risk that comps aren't pricing in. Stress-test before assuming the spread holds.
Location & tenants
- Location reads 64/100 on livability (#254 in GA) — a middle-class / working-renter tenant base. Strengths: cost of living A+, housing A+, health & safety B; Watch: amenities D+, crime F, commute F.
- Muscogee County (urban): math 21% / reading 30% proficiency, ranked #120 of 174 in GA (top 69%) — low school quality limits family demand, transient renter base, plan for 1-2y turnover; 61% free/reduced lunch — lower-income household profile, screen leases tightly.
- Zoned schools: South Columbus Elementary School (math 2% / reading 12%, grade F, #1,144 of 1,228 statewide, top 94%, 359 students, 97% FRL); Eddy Middle School (math 4% / reading 11%, grade F, #447 of 470 statewide, top 95%, 413 students, 97% FRL); Spencer High School (math 2% / reading 8%, grade F, #394 of 424 statewide, top 97%, 943 students, 97% FRL) — zoned schools average 97% FRL vs 61% district-wide (36 pts higher); higher-poverty schools than district average — tighter screening recommended.
- Zoned-school proficiency averages 7% at this address vs 26% district-wide (-19 pts) — the specific schools serving this property underperform the Muscogee County average; the district grade overstates school quality for this exact location.
- Market conditions: Rents rising (+1.8%/yr); 105 active listings in the ZIP; 27 comparable units currently listed for rent nearby; rentals at typical pace (median 23d on market — plan ~3-4 weeks tenant-placement turnaround); 44% of comp listings sitting > 30 days — soft ceiling on asking rent; lower-income renter base — watch delinquency; 291 units permitted in Muscogee County in 2024 (30 in 5+ unit buildings).
Forward outlook
- Local home prices are declining (-3.0%/yr); year-one equity from $415 of loan paydown is wiped out by about $2k of value loss. Plan a longer hold.
- Muscogee County population projected at +15% by 2050 — modest demand growth; plan on rents tracking national, not racing it.
- At projected returns (-3.0% appreciation + 1.8% rent growth), your $17k cash investment doubles in ~5 years — after that, you're playing with house money.
Negotiation context
- It's been on market 142 days — a 12% lower offer ($53k) is reasonable based on typical stale-listing flexibility.
- 2 sale attempts since 9y ago with the ask held roughly flat each time — persistent listings suggest the price (not the market) is what's stuck; bring a comps-based counter.
Risks & watch-outs
- Watch-outs: built in 1950 — expect roof / HVAC / electrical / plumbing capex.
- Climate carrying-cost: major flood risk; major wind risk, 76% chance of damaging wind over 30y; extreme-heat days projected 7→19/yr by 2055 (HVAC capex compounding) — expect insurance premiums to compound above CPI over the hold.
Questions for the listing agent
- It's been on market 142 days. Have you received any prior offers? Is the seller open to a 12% concession, seller financing, or rate buy-down credit?
- Built in 1950 — when were the roof, HVAC, electrical panel, plumbing, and water heater last replaced?
- Why hasn't it sold? Are there any deal-killer items the seller is aware of (foundation, flood, title, zoning, code violations)?
- Is there a deadline driving the sale (1031 exchange, divorce, estate, relocation)? That informs how much negotiation room exists.
- Schools are F-rated, which usually means shorter tenancies and higher turnover. Who's the typical renter profile here, and what's been the actual vacancy rate?
- Crime grade is F in this area — have there been break-ins, vandalism, or insurance claims at this property in the last 3 years? What carrier currently insures it and at what premium?
- What's the average days-on-market for RENTAL listings here right now (not sales)? A rising rental-DOM trend means longer vacancies and softer asking-rent achievability than the comps imply.
- What's the recent tenant-quality profile in this submarket — average credit score on applications, eviction rate, late-payment / NSF rate, and stable-employment percentage? A property-management company in the area should have these aggregated.
- How much new for-sale + rental construction is in the pipeline within 1–3 miles? Heavy new supply typically softens prices + rents 12–24 months out; constrained supply supports both.
Investment metrics
- 1% rule
- 1.65% ✓
- Cap rate
- 14.51%
- Cash-on-cash
- 29.35%
- DSCR
- 2.31
- GRM
- 5.0
CMA / ARV
- ARV (median comp)
- $65,030
- List price
- $60,000
- Delta
- -7.74%
- Verdict
- FAIR
- Comps
- 20 within 1.0 mi
Show comp detail 12 sales within ~0.75 mi
| Address | Dist | Beds/Ba | Sqft | Sold | Price | $/sf | Match |
|---|---|---|---|---|---|---|---|
| 2973 Hawthorne Dr | 0.37mi | 3/1.0 | 1,014 (+6%) | 4mo | $68,000 | $67 | 68 |
| 2244 Simmons Ave | 0.59mi | 3/1.0 | 942 (-1%) | 7mo | $10,000 | $11 | 65 |
| 3220 Glenn St | 0.48mi | 3/1.0 | 942 (-1%) | 14mo | $55,000 | $58 | 64 |
| 22 Mason Dr | 0.63mi | 3/1.0 | 966 (+2%) | 11mo | $27,000 | $28 | 59 |
| 13 Patton Dr | 0.59mi | 3/1.0 | 888 (-7%) | 3mo | $36,500 | $41 | 59 |
| 2203 Simmons Ave | 0.52mi | 2/1.0 (-1) | 858 (-10%) | 4mo | $110,000 | $128 | 52 |
| 2241 Bruce Ave | 0.55mi | 2/1.0 (-1) | 858 (-10%) | 5mo | $64,000 | $75 | 49 |
| 2830 Hawthorne Dr | 0.65mi | 3/1.0 | 1,039 (+9%) | 13mo | $65,000 | $63 | 44 |
| 2214 Somerset Ave | 0.61mi | 2/1.0 (-1) | 1,024 (+8%) | 12mo | $57,000 | $56 | 44 |
| 3224 Hendrix St | 0.54mi | 2/1.0 (-1) | 858 (-10%) | 12mo | $45,000 | $52 | 43 |
| 17 Lowe Dr | 0.57mi | 3/2.0 | 1,082 (+14%) | 9mo | $119,900 | $111 | 39 |
| 2248 S Lumpkin Rd | 0.64mi | 3/1.0 | 1,083 (+14%) | 13mo | $50,000 | $46 | 36 |
Match score weights: distance 35% · size 25% · config 20% · recency 20%. Top-matched comps best support the ARV.
Projected returns pro-forma
-3.0% appreciation · 1.82% rent growth · sell at horizon
- IRR
- 22.5%
- Equity multiple
- 1.91×
- Total profit
- $15,273
- Equity at exit
- $8,946
- IRR
- 29.8%
- Equity multiple
- 3.52×
- Total profit
- $42,290
- Equity at exit
- $5,188
Cash invested: $16,800 (down + closing). Projections, not guarantees.
Landlord ↔ Tenant lean methodology
- Overall (STATE)
- 90 Strongly Landlord-Friendly
- State Georgia
- 90 Strongly Landlord-Friendly · R+3
- County
- — inherits STATE
- City
- — inherits STATE
ZIP-level market 31903
- Home prices YoY
- -14.5%
- Rents YoY
- 1.8%
- Active inventory
- 105
- Price-to-rent
- 5.0×
Monthly cashflow live
- Estimated rent
- $992 high interval (Pro) →
- Mortgage (P&I)
- −$315
- Tax from tax record
- −$33 /mo · $395/yr
- Insurance
- −$25
- HOA
- −$0
- Vacancy / Maint / Mgmt
- −$208
- Net cashflow
- $411
Break-even live
Sensitivity live
| Price | -10% $445 | -5% $428 | +0% $411 | +5% $394 | +10% $377 |
|---|---|---|---|---|---|
| Rent | -10% $333 | -5% $372 | +0% $411 | +5% $450 | +10% $489 |
| Rate | -1.0pp $441 | -0.5pp $426 | base $411 | +0.5pp $395 | +1.0pp $380 |
UW: 25.0% down · 7.5% · 30yr · 1.5% tax · 5.0% vac · 8.0% maint · 8.0% mgmt
Financing live
Cash to close
- Down payment
- $15,000
- Closing costs
- $1,800
- Reserves months
- —
- Total cash needed
- —
Loan-product check · same deal, 3 products live
Conventional
25% down · 7.5% · 30yr
- Down + closing
- —
- Monthly P&I
- —
- Monthly cashflow
- —
- DSCR
- —
- Eligible?
- —
Personal DTI + credit; lowest rate.
DSCR
20% down · 8.5% · 30yr
- Down + closing
- —
- Monthly P&I
- —
- Monthly cashflow
- —
- DSCR
- —
- Eligible?
- —
No personal income docs; deal must DSCR.
Hard money
10% down · 12.0% · 12mo
- Down + closing
- —
- Monthly P&I
- —
- Monthly cashflow
- —
- DSCR
- —
- Eligible?
- —
Short-term bridge; refi at stabilization.
Rent comps 27 comps
| Address | Beds | Baths | Sqft | Rent | $/sqft | DOM | Units | Dist |
|---|---|---|---|---|---|---|---|---|
| 2051 Somerset Ave Columbus, GA | 3.0 | 1.0 | 1092 | $1,100 | $1.01 | 46d | 1 | 0.46mi |
| 48 Douglas St Columbus, GA | 3.0 | 1.0 | 1038 | $980 | $0.94 | 15d | 1 | 0.51mi |
| 121 Torch Hill Rd Columbus, GA | 2.0 | 1.0 | 936 | $825 | $0.88 | 46d | 1 | 0.62mi |
| 25 Mason Dr Columbus, GA | 3.0 | 1.0 | 1038 | $1,100 | $1.06 | 23d | 1 | 0.62mi |
| 3053 Blan St Columbus, GA | 2.0 | 1.0 | 868 | $875 | $1.01 | 15d | 1 | 0.69mi |
| 2354 Banks Ave Unit 1 Columbus, GA | 2.0 | 1.0 | 942 | $725 | $0.77 | 15d | 1 | 0.75mi |
| 2329 S Lumpkin Rd Columbus, GA | 2.0 | 1.0 | 816 | $850 | $1.04 | 46d | 1 | 0.75mi |
| 88 Infantry Dr Columbus, GA | 2.0 | 1.0 | 1122 | $900 | $0.80 | 46d | 1 | 0.77mi |
| 171 Munson Dr Columbus, GA | 2.0 | 1.0 | 780 | $800 | $1.03 | 23d | 1 | 0.81mi |
| 1206 Winston Rd Columbus, GA | 2.0 | 1.0 | 868 | $750 | $0.86 | 46d | 1 | 0.84mi |
| 76 Mathews St Columbus, GA | 3.0 | 2.0 | 1100 | $1,100 | $1.00 | 15d | 1 | 0.84mi |
| 3122 Meade St Unit 1 Columbus, GA | 2.0 | 1.0 | 949 | $725 | $0.76 | 15d | 1 | 0.86mi |
| 3014 Drake St Columbus, GA | 2.0 | 1.0 | 858 | $950 | $1.11 | 46d | 1 | 0.87mi |
| 1048 Brooks Rd Columbus, GA | 2.0 | 1.0 | 942 | $925 | $0.98 | 23d | 1 | 0.89mi |
| 58 Stonewall Dr Columbus, GA | 3.0 | 1.0 | 1002 | $1,000 | $1.00 | 46d | 1 | 0.90mi |
| 3028 Meade St Columbus, GA | 2.0 | 1.0 | 1016 | $950 | $0.94 | 46d | 1 | 0.97mi |
| 61 Lanier Dr Columbus, GA | 3.0 | 1.0 | 896 | $875 | $0.98 | 15d | 1 | 1.00mi |
| 1 Engineer Dr Unit H1 Columbus, GA | 2.0 | 1.0 | 816 | $850 | $1.04 | 46d | 1 | 1.01mi |
| 1414 Foye Ave Columbus, GA | 2.0 | 1.0 | 1021 | $895 | $0.88 | 15d | 1 | 1.01mi |
| 3909 Baker Plaza Dr Columbus, GA | 1.0–2.0 | 1.0–2.0 | 869 | $1,010 | $1.16 | 15d | 1 | 1.01mi |
| 2231 Cornell Ave Columbus, GA | 2.0 | 1.0 | 858 | $950 | $1.11 | 23d | 1 | 1.02mi |
| 3390 N Lumpkin Rd Columbus, GA | 2.0–3.0 | 2.0 | 1073 | $1,099 | $1.02 | 15d | 14 | 1.13mi |
| 1459 Ivan Ave Columbus, GA | 3.0 | 1.0 | 1003 | $975 | $0.97 | 46d | 1 | 1.15mi |
| 2840 Walker St Columbus, GA | 3.0 | 1.0 | 1032 | $975 | $0.94 | 46d | 1 | 1.17mi |
| 3320 N Lumpkin Rd Columbus, GA | 2.0–3.0 | 2.0 | 1098 | $1,099 | $1.00 | 15d | 8 | 1.39mi |
| 3217 Lee St Apt 1 Columbus, GA | 2.0 | 1.0 | 688 | $899 | $1.31 | 46d | 1 | 1.47mi |
| 3213 Lee St Unit 3 Columbus, GA | 2.0 | 1.0 | 1100 | $925 | $0.84 | 15d | 1 | 1.48mi |
Listing history 19 events
-
2026-06-22days on market $60,000 Active 142 DOM
-
2026-06-18days on market $60,000 Active 139 DOM
-
2026-06-17days on market $60,000 Active 138 DOM
-
2026-06-16days on market $60,000 Active 137 DOM
-
2026-06-15days on market $60,000 Active 136 DOM
-
2026-06-14days on market $60,000 Active 134 DOM
-
2026-06-13days on market $60,000 Active 133 DOM
-
2026-06-10days on market $60,000 Active 131 DOM
-
2026-06-09days on market $60,000 Active 130 DOM
-
2026-06-08days on market $60,000 Active 129 DOM
-
2026-06-07days on market $60,000 Active 128 DOM
-
2026-06-05days on market $60,000 Active 125 DOM
-
2026-06-03days on market $60,000 Active 124 DOM
-
2026-06-02days on market $60,000 Active 123 DOM
-
2026-06-01days on market $60,000 Active 122 DOM
-
2026-05-31days on market $60,000 Active 121 DOM
-
2026-05-30days on market $60,000 Active 120 DOM
-
2026-01-30$60,000 Active 363-char remark
Show marketing remark (363 chars)
Investor opportunity! 3433 Marathon Dr is a tenant-occupied 3BR/1BA home offering 952 sqft on a 0.19-acre lot—ideal for investors seeking a cash-flowing addition to their portfolio. Convenient location near schools, parks, shopping, dining, major roadways, and minutes to Fort Moore and other key employment hubs supporting strong rental demand. Sold As-Is.
-
2017-11-08$15,000
ⓘ Source: listings_history table (triggers on properties + properties_extension) + one-shot
backfill from property_details.listing_events for pre-trigger history.
Tax reassessment forecast GA · Resets to sale price
- Current annual tax
- $395 · $33/mo
- Projected year-2 tax
- $552 · $46/mo
- Expected delta
- +$157/yr (+$13/mo · 39.7%)
ⓘ Screening estimate from a state-policy table — verify with the county assessor before closing.
Climate risk First Street
- Flood 6/10 Major FEMA zone X (unshaded) · 72% chance over 30 yrs
- Wildfire 3/10 Moderate
- Heat 7/10 Severe 7 d/yr ≥107°F today · 19 d/yr by 30 yrs out
- Wind 6/10 Major 76% chance of damaging wind over 30 yrs
- Air quality 4/10 Moderate 4 unhealthy d/yr today · 5 by 30 yrs out
Nearby sold comps map
Loading sold comps map…
Walkable amenities ~0.75 mi
Loading nearby amenities…
Taxation est. · year 1
- Rental income
- $11,901
- − Mortgage interest
- −$3,361
- − Property taxes
- −$395
- − Insurance
- −$300
- − Repairs & maintenance
- −$952
- − Management
- −$952
- − Depreciation
- −$1,745
- Taxable income
- $4,195
- Est. tax owed @ 24.0%
- −$1,007
- After-tax cash flow
- $3,924/yr
For passive investors: Depreciation is non-cash, so a rental often shows a tax loss while cash-flowing — sheltering income. Rental losses are passive: they offset passive income freely, and up to $25,000/yr can offset ordinary (W-2) income if you actively participate and your MAGI is under $100k (phasing out to $0 by $150k); unused losses carry forward. On sale, claimed depreciation is recaptured at up to 25%, and gains may owe capital-gains tax (a 1031 exchange can defer both). Figures are a year-1 estimate at your 24.0% rate — not tax advice; consult a CPA.
Schools (NCES district)
- District
- Muscogee County
- NCES district ID
- 1303870
- Math proficiency
- 21% ▼ -11.00%
- Reading proficiency
- 30% ▼ -7.00%
- Median HH income
- $41,176
- Composite
- 21.6/100
- National rank
- #8297
- State rank
- #120 of 174 in GA
Livability — Columbus
- Score
- 64/100
- State rank
- #254
- US rank
- #14102
Category grades
Schools grade is shown separately in the Schools card above.
Census & demographics
- Census place
- Columbus, GA
- County
- Muscogee County · 180,764 people
- City population
- 180,764
- Metro
- Columbus, GA-AL
- Population (ZIP)
- 20,644
- Household income
- $32,401
- Rent vs Own
- Severe rent burden
- 1878.0
Population outlook (Muscogee County) Hauer SSP2
- Today (2025)
- 216,729 people
- By 2030
- 224,504 · +3.6%
- By 2040
- 238,318 · +10.0%
- By 2050
- 249,027 · +14.9%
- By 2075
- 264,862 · +22.2%
- By 2100
- 254,786 · +17.6%
Race, ethnicity, and origin ACS 2023
- Neighborhood character
- Predominantly Black (77%)
- Race & ethnicity
- Black 77% Hispanic / Latino 11% White 9% Two or more races 3% Asian 1%
- Hispanic origin (detail)
- Mexican 6% Puerto Rican 2%
- Foreign-born
- 6% · Canada
- Languages at home
- 88% English-only · Spanish 10% Other Indo-European 1%
Political lean MEDSL · Muscogee
- 2024 margin
- Strong D (+23.4) · D 61.4% · R 38.0%
- 2008→2024 swing
- +3.7pp toward D · 2008: 19.7pp · 2024: 23.4pp
- All cycles
- 2024: D+23.4 2020: D+24.0 2016: D+18.6 2012: D+21.3 2008: D+19.7
Not yet ingested
- Civics
- —
Market trends
- HPI YoY
- ▼ -22.30%
- Current HPI
- 131.4761
- Rent YoY
- ▲ 1.82%
- Metro
- Columbus, GA-AL
- State GDP YoY
- ▲ 2.66%
- F500 in state
- 28
Industry mix (Fortune 500 HQ in GA)
| Industry | F500 HQs | Revenue |
|---|---|---|
| Paper / Packaging | 2 | $29B |
|
||
| Retail | 1 | $160B |
|
||
| Transportation / Logistics | 1 | $91B |
|
||
| Airlines | 1 | $62B |
|
||
| Consumer Goods | 1 | $47B |
|
||
| Utilities | 1 | $25B |
|
||
Price history
+300.0% since first listed2 events — show timeline
- 2026-01-30 Listed $60,000 CBOR
- 2017-11-08 Listed $15,000 CBOR
Property tax history
-4.3%/yrLatest (2025): $395 · +0.0% YoY. Source: county tax records.
Cash-flow waterfall
monthlySold comps — $/sqft
last 12 mo · ≤1 miLoading sold comps…