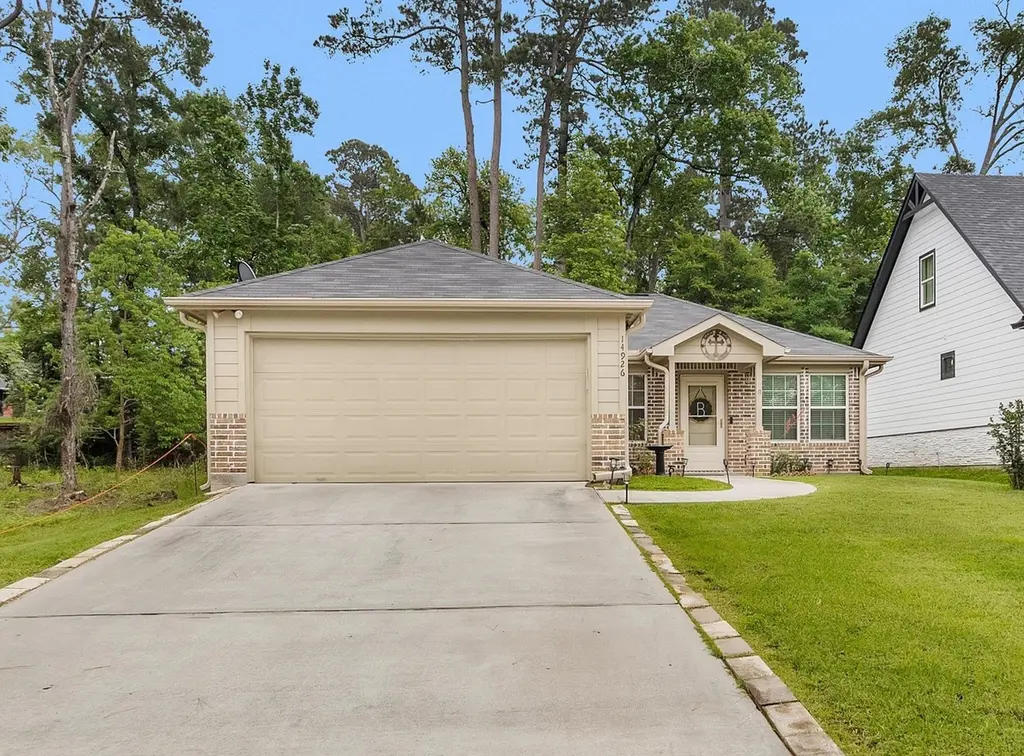
14926 Bowie Ln · Willis, TX
Flood risk 1/10 · Minimal
- FEMA flood zone
- X (unshaded)
- Chance of flooding over 30 yrs
- 0.0%
- Est. flood insurance / yr
- $507 – $1,088
Fire risk 5/10 · Moderate
- Est. fire insurance / yr
- $1,222 – $2,270
Heat risk 8/10 · Major
- Hot days now (above 111°F)
- 7 days/yr
- Hot days in 30 yrs
- 23 days/yr
Wind risk 8/10 · Major
- Chance of severe wind over 30 yrs
- 99.0%
Air-quality risk 2/10 · Minimal
- Unhealthy air days now
- 1 days/yr
- Unhealthy air days in 30 yrs
- 1 days/yr
Risk factors via First Street. Map © Google.
Why this score? — see what drove the D+ grade
The composite is a weighted blend of 9 inputs, each scored 0–100. Each bar is that input's sub-score; the figure is the points it added to the 100-point composite (weight × sub-score).
- Cash flow +17.3/30.0
- ARV discount +8.4/15.0
- DSCR +5.4/10.0
- 1% rule +4.7/10.0
- Condition / age +4.0/5.0
- Schools +3.2/10.0
- Livability +3.1/5.0
- Rent growth +2.7/5.0
- Appreciation +0.9/10.0
$178,000
🖨 Deal sheet (PDF) 📄 Offer letter ✓ Due diligence
Listing remarks
Tucked into the trees in Frontier Lakes, this 3 bedroom, 2 bath, 1-story home sits on a generously sized lot with the kind of quiet setting that’s getting hard to find. Mature trees surround the property, creating a peaceful backdrop while still keeping you close to everything Willis and Conroe have to offer. Inside, the layout is open and easy to live in with the kitchen, dining and living areas all connected. The kitchen offers plenty of cabinet space and stainless steel appliances and the primary suite has an attached ensuite that with an upgraded handicap accessible shower. Out back, you’ve got room to spread out whether it’s pets, play or simply enjoying the park-like
Key facts
- 5,601 sq ft lot
- 2 garage spots
- Built 2019
Tags
Property features AI
Finance
- HOA & community: Frontier Lakes POA; Annual association fee of $88
Exterior
- Parking: Attached garage with garage door opener (2 car spaces)
- Utilities: Public water
- Home design: Residential property; Full ownership; Single-story (entry level: first floor); Built in 2019
- Construction: Brick and cement siding construction; Slab foundation; Composition roof
- Exterior features: Subdivision lot; Asphalt road access; Gutters
Interior
- Kitchen: Dishwasher; Electric oven; Electric range; Disposal; Microwave
- Bedrooms: Primary bedroom on the first floor (approx. 9 x 11); Bedroom on the first floor (approx. 10 x 9); Bedroom on the first floor (approx. 9 x 10); 3 total rooms used as bedrooms possible
- Bathrooms: 2 full bathrooms
- Heating & cooling: Central electric heating; Central air conditioning
- Interior features: Breakfast bar; Kitchen/family room combo; Kitchen/dining combo; Laminate counters; Tub/shower; Ceiling fan(s); Accessible full bath
- Laundry & utility: Washer hookup; Electric dryer hookup
Neighborhood map
What this means for you Summary
Snapshot
- This is a 3-bed/2.0-bath single-family listed at $178k. Condition is rated good.
Deal economics
- At list price, monthly cash flow is $132 ($2k/yr) — positive.
- The deal already cash-flows at list — no discount required.
- To meet the 1% rule (rent ≥ 1% of price), the offer needs to be $173k (2.7% below list).
- Recommended offer: $173k (3.0% below list) — sets the bar for market timing.
- Cap rate 7.2% vs local median 4.7% in Willis — top-decile yield for the area; either an underpriced asset or a hidden risk that comps aren't pricing in. Stress-test before assuming the spread holds.
Location & tenants
- Location reads 62/100 on livability (#933 in TX) — a middle-class / working-renter tenant base. Strengths: cost of living A+, housing A+; Watch: crime C-, employment D+, amenities F.
- Willis ISD (rural): math 33% / reading 40% proficiency, ranked #458 of 826 in TX (top 55%) — families likely to look elsewhere, expect single-tenant / working-renter base with shorter leases.
- Zoned schools: Parmley El (math 39% / reading 34%, grade F, #1,883 of 4,322 statewide, top 44%, 625 students, 72% FRL); Lynn Lucas Middle (math 23% / reading 32%, grade F, #1,156 of 1,662 statewide, top 71%, 971 students, 74% FRL); Willis H S (math 19% / reading 46%, grade F, #1,029 of 1,632 statewide, top 64%, 2,521 students, 57% FRL).
- Market conditions: Rents flat; 721 active listings in the ZIP; 13,259 units permitted in Montgomery County in 2024 (1,402 in 5+ unit buildings).
Forward outlook
- Local home prices are declining (-3.0%/yr); year-one equity from $1k of loan paydown is wiped out by about $5k of value loss. Plan a longer hold.
- Montgomery County population projected at +65% by 2050 — long-run rental-demand tailwind backs the buy-and-hold thesis.
Negotiation context
- It's been on market 55 days — a 3% lower offer ($173k) is reasonable based on typical stale-listing flexibility.
- 2 sale attempts with the ask held roughly flat each time — persistent listings suggest the price (not the market) is what's stuck; bring a comps-based counter.
Risks & watch-outs
- Climate carrying-cost: severe wind risk, 99% chance of damaging wind over 30y; moderate wildfire risk; extreme-heat days projected 7→23/yr by 2055 (HVAC capex compounding) — expect insurance premiums to compound above CPI over the hold.
Questions for the listing agent
- It's been on market 55 days. Have you received any prior offers? Is the seller open to a 3% concession, seller financing, or rate buy-down credit?
- What does the HOA fee cover, when was the last increase, and are there any pending special assessments or reserve-fund shortfalls?
- Is there a deadline driving the sale (1031 exchange, divorce, estate, relocation)? That informs how much negotiation room exists.
- Schools are D-rated, which usually means shorter tenancies and higher turnover. Who's the typical renter profile here, and what's been the actual vacancy rate?
- The area grade is low — what's the realistic commute time and amenity access for the typical tenant pool here? Any planned neighborhood developments (good or bad) we should know about?
- What's the average days-on-market for RENTAL listings here right now (not sales)? A rising rental-DOM trend means longer vacancies and softer asking-rent achievability than the comps imply.
- What's the recent tenant-quality profile in this submarket — average credit score on applications, eviction rate, late-payment / NSF rate, and stable-employment percentage? A property-management company in the area should have these aggregated.
- How much new for-sale + rental construction is in the pipeline within 1–3 miles? Heavy new supply typically softens prices + rents 12–24 months out; constrained supply supports both.
Investment metrics
- 1% rule
- 0.97% ✗
- Cap rate
- 7.18%
- Cash-on-cash
- 3.17%
- DSCR
- 1.14
- GRM
- 8.6
CMA / ARV
- ARV (median comp)
- $181,515
- List price
- $178,000
- Delta
- -1.94%
- Verdict
- FAIR
- Comps
- 20 within 1.0 mi
Show comp detail 11 sales within ~0.75 mi
| Address | Dist | Beds/Ba | Sqft | Sold | Price | $/sf | Match |
|---|---|---|---|---|---|---|---|
| 3940 Frontier Rd | 0.34mi | 3/2.0 | 1,034 (+6%) | 2mo | $175,000 | $169 | 72 |
| 14756 Crockett Rd | 0.13mi | 3/1.0 | 975 (0%) | 22mo | $172,400 | $177 | 72 |
| 14881 Travis Ln | 0.25mi | 3/2.0 | 958 (-2%) | 20mo | $173,900 | $182 | 69 |
| 14777 Bowie Ln | 0.14mi | 3/2.0 | 1,058 (+8%) | 19mo | $184,900 | $175 | 64 |
| 4572 Ben Milam Rd | 0.21mi | 3/2.5 | 1,058 (+8%) | 15mo | $181,900 | $172 | 62 |
| 5440 N Buffalo Cir | 0.71mi | 3/2.0 | 950 (-3%) | 4mo | $185,000 | $195 | 59 |
| 14861 Travis Ln | 0.24mi | 3/2.0 | 1,058 (+8%) | 20mo | $184,900 | $175 | 58 |
| 5540 N Buffalo Cir | 0.63mi | 3/2.0 | 1,000 (+3%) | 13mo | $204,000 | $204 | 56 |
| 4079 Frontier Rd | 0.22mi | 3/2.0 | 1,120 (+15%) | 12mo | $160,000 | $143 | 55 |
| 15229 Travis Ln | 0.54mi | 3/2.0 | 900 (-8%) | 8mo | $150,000 | $167 | 55 |
| 4089 Ben Milam | 0.40mi | 2/1.5 (-1) | 896 (-8%) | 21mo | $167,800 | $187 | 43 |
Match score weights: distance 35% · size 25% · config 20% · recency 20%. Top-matched comps best support the ARV.
Projected returns pro-forma
-3.0% appreciation · 0.98% rent growth · sell at horizon
- IRR
- -13.6%
- Equity multiple
- 0.52×
- Total profit
- $-23,886
- Equity at exit
- $26,540
- IRR
- -8.3%
- Equity multiple
- 0.53×
- Total profit
- $-23,487
- Equity at exit
- $15,390
Cash invested: $49,840 (down + closing). Projections, not guarantees.
Landlord ↔ Tenant lean methodology
- Overall (STATE)
- 87 Strongly Landlord-Friendly
- State Texas
- 87 Strongly Landlord-Friendly · R+5
- County
- — inherits STATE
- City
- — inherits STATE
ZIP-level market 77378
- Home prices YoY
- -3.0%
- Rents YoY
- 1.0%
- Active inventory
- 721
- Price-to-rent
- 8.6×
Monthly cashflow live
- Estimated rent
- $1,733 medium interval (Pro) →
- Mortgage (P&I)
- −$933
- Tax est. 1.5%
- −$222 /mo · $2,670/yr
- Insurance
- −$74
- HOA
- −$7
- Vacancy / Maint / Mgmt
- −$364
- Net cashflow
- $132
Break-even live
Sensitivity live
| Price | -10% $255 | -5% $193 | +0% $132 | +5% $70 | +10% $9 |
|---|---|---|---|---|---|
| Rent | -10% $-5 | -5% $63 | +0% $132 | +5% $200 | +10% $268 |
| Rate | -1.0pp $221 | -0.5pp $177 | base $132 | +0.5pp $85 | +1.0pp $39 |
UW: 25.0% down · 7.5% · 30yr · 1.5% tax · 5.0% vac · 8.0% maint · 8.0% mgmt
Financing live
Cash to close
- Down payment
- $44,500
- Closing costs
- $5,340
- Reserves months
- —
- Total cash needed
- —
Loan-product check · same deal, 3 products live
Conventional
25% down · 7.5% · 30yr
- Down + closing
- —
- Monthly P&I
- —
- Monthly cashflow
- —
- DSCR
- —
- Eligible?
- —
Personal DTI + credit; lowest rate.
DSCR
20% down · 8.5% · 30yr
- Down + closing
- —
- Monthly P&I
- —
- Monthly cashflow
- —
- DSCR
- —
- Eligible?
- —
No personal income docs; deal must DSCR.
Hard money
10% down · 12.0% · 12mo
- Down + closing
- —
- Monthly P&I
- —
- Monthly cashflow
- —
- DSCR
- —
- Eligible?
- —
Short-term bridge; refi at stabilization.
HOA detail
- Monthly dues
- $7 · $84/yr
Listing history 17 events
-
2026-06-21days on market $178,000 Active 55 DOM
-
2026-06-18days on market $178,000 Active 52 DOM
-
2026-06-17days on market $178,000 Active 51 DOM
-
2026-06-16days on market $178,000 Active 50 DOM
-
2026-06-15days on market $178,000 Active 49 DOM
-
2026-06-13days on market $178,000 Active 47 DOM
-
2026-06-09days on market $178,000 Active 43 DOM
-
2026-06-08days on market $178,000 Active 42 DOM
-
2026-06-07days on market $178,000 Active 41 DOM
-
2026-06-04days on market $178,000 Active 38 DOM
-
2026-06-03days on market $178,000 Active 37 DOM
-
2026-06-02days on market $178,000 Active 36 DOM
-
2026-06-01days on market $178,000 Active 35 DOM
-
2026-05-31days on market $178,000 Active 34 DOM
-
2026-05-13status Active 992-char remark
-
2026-05-11status Pending 992-char remark
-
2026-04-27$178,000 Active 992-char remark
ⓘ Source: listings_history table (triggers on properties + properties_extension) + one-shot
backfill from property_details.listing_events for pre-trigger history.
Climate risk First Street
- Flood 1/10 Low FEMA zone X (unshaded) · 0% chance over 30 yrs
- Wildfire 5/10 Major
- Heat 8/10 Severe 7 d/yr ≥111°F today · 23 d/yr by 30 yrs out
- Wind 8/10 Severe 99% chance of damaging wind over 30 yrs
- Air quality 2/10 Low 1 unhealthy d/yr today · 1 by 30 yrs out
Nearby sold comps map
Loading sold comps map…
Walkable amenities ~0.75 mi
Loading nearby amenities…
Taxation est. · year 1
- Rental income
- $20,790
- − Mortgage interest
- −$9,971
- − Property taxes
- −$2,670
- − Insurance
- −$890
- − Repairs & maintenance
- −$1,663
- − Management
- −$1,663
- − HOA
- −$84
- − Depreciation
- −$5,178
- Taxable loss
- −$1,329
- Est. tax savings @ 24.0%
- +$319
- After-tax cash flow
- $1,898/yr
For passive investors: Depreciation is non-cash, so a rental often shows a tax loss while cash-flowing — sheltering income. Rental losses are passive: they offset passive income freely, and up to $25,000/yr can offset ordinary (W-2) income if you actively participate and your MAGI is under $100k (phasing out to $0 by $150k); unused losses carry forward. On sale, claimed depreciation is recaptured at up to 25%, and gains may owe capital-gains tax (a 1031 exchange can defer both). Figures are a year-1 estimate at your 24.0% rate — not tax advice; consult a CPA.
Condition & rehab AI · 12 photos
This 3-bedroom, 2-bath home in Willis, TX, is in good condition with a good rehab level. It offers a spacious layout and is surrounded by mature trees, making it a great investment opportunity.
Value-add opportunities
- Both Paint exterior trim — Enhances curb appeal and value
- Both Replace carpet with hardwood flooring — Improves aesthetics and increases value
- Both Install smart home devices — Enhances convenience and adds modern appeal
Renovation cost estimate screening
Value-add ROI direction
- Both Paint exterior trim — Enhances curb appeal and value ↑
- Both Replace carpet with hardwood flooring — Improves aesthetics and increases value ↑
- Both Install smart home devices — Enhances convenience and adds modern appeal ↑
ⓘ Cost ranges are severity-bucket heuristics (US national rule-of-thumb). Get contractor quotes + a written scope before underwriting a rehab budget.
Schools (NCES district)
- District
- Willis ISD
- NCES district ID
- 4845900
- Math proficiency
- 33% ▼ -15.00%
- Reading proficiency
- 40% ▼ -2.00%
- Median HH income
- $57,828
- Composite
- 32.32/100
- National rank
- #5746
- State rank
- #458 of 826 in TX
Livability — Willis
- Score
- 62/100
- State rank
- #933
- US rank
- #16579
Category grades
Schools grade is shown separately in the Schools card above.
Census & demographics
- County
- Montgomery County · 663,713 people
- City population
- 38,421
- Metro
- Houston-The Woodlands-Sugar Land, TX
- Population (ZIP)
- 17,629
- Household income
- $71,143
- Rent vs Own
- Severe rent burden
- 402.0
Population outlook (Montgomery County) Hauer SSP2
- Today (2025)
- 713,896 people
- By 2030
- 805,263 · +12.8%
- By 2040
- 992,708 · +39.1%
- By 2050
- 1,179,590 · +65.2%
- By 2075
- 1,628,084 · +128.1%
- By 2100
- 1,937,880 · +171.5%
Race, ethnicity, and origin ACS 2023
- Neighborhood character
- Diverse neighborhood (Simpson 0.55)
- Race & ethnicity
- White 58% Hispanic / Latino 32% Two or more races 14% Black 7% Native American 1%
- Hispanic origin (detail)
- Mexican 27%
- Common ancestry
- Romanian 2% Slovak 2% Serbian 1%
- Foreign-born
- 12% · Canada
- Languages at home
- 80% English-only · Spanish 19%
Political lean MEDSL · Montgomery
- 2024 margin
- Solid R (+45.5) · D 26.8% · R 72.3%
- 2008→2024 swing
- +7.2pp toward D · 2008: -52.7pp · 2024: -45.5pp
- All cycles
- 2024: R+45.5 2020: R+43.8 2016: R+51.4 2012: R+60.7 2008: R+52.7
Not yet ingested
- Civics
- —
Market trends
- HPI YoY
- ▼ -8.25%
- Current HPI
- 261.9673
- Rent YoY
- ▲ 0.98%
- Metro
- Houston-The Woodlands-Sugar Land, TX
- State GDP YoY
- ▲ 3.95%
- F500 in state
- 110
Industry mix (Fortune 500 HQ in TX)
| Industry | F500 HQs | Revenue |
|---|---|---|
| Energy | 16 | $1,198B |
|
||
| Technology | 5 | $198B |
|
||
| Engineering / Construction | 4 | $72B |
|
||
| Energy Services | 3 | $60B |
|
||
| Utilities | 3 | $41B |
|
||
| Healthcare | 2 | $330B |
|
||
Price history
3 events — show timeline
- 2026-05-13 Relisted — HARMLS
- 2026-05-11 Pending — HARMLS
- 2026-04-27 Listed $178,000 HARMLS
Cash-flow waterfall
monthlySold comps — $/sqft
last 12 mo · ≤1 miLoading sold comps…