18755 Copperhead Ct N · Lehigh Acres, FL
Flood risk No data
- FEMA flood zone
- —
- Chance of flooding over 30 yrs
- —
- Est. flood insurance / yr
- —
Fire risk No data
- Est. fire insurance / yr
- —
Heat risk No data
- Hot days now (above threshold)
- —
- Hot days in 30 yrs
- —
Wind risk No data
- Chance of severe wind over 30 yrs
- —
Air-quality risk No data
- Unhealthy air days now
- —
- Unhealthy air days in 30 yrs
- —
Risk factors via First Street. Map © Google.
Why this score? — see what drove the D grade
The composite is a weighted blend of 9 inputs, each scored 0–100. Each bar is that input's sub-score; the figure is the points it added to the 100-point composite (weight × sub-score).
- Cash flow +12.4/30.0
- ARV discount +11.4/15.0
- Schools +4.1/10.0
- Condition / age +4.0/5.0
- DSCR +3.7/10.0
- 1% rule +3.5/10.0
- Livability +3.0/5.0
- Rent growth +2.3/5.0
- Appreciation +0.0/10.0
$205,997
🖨 Deal sheet (PDF) 📄 Offer letter ✓ Due diligence
Listing remarks
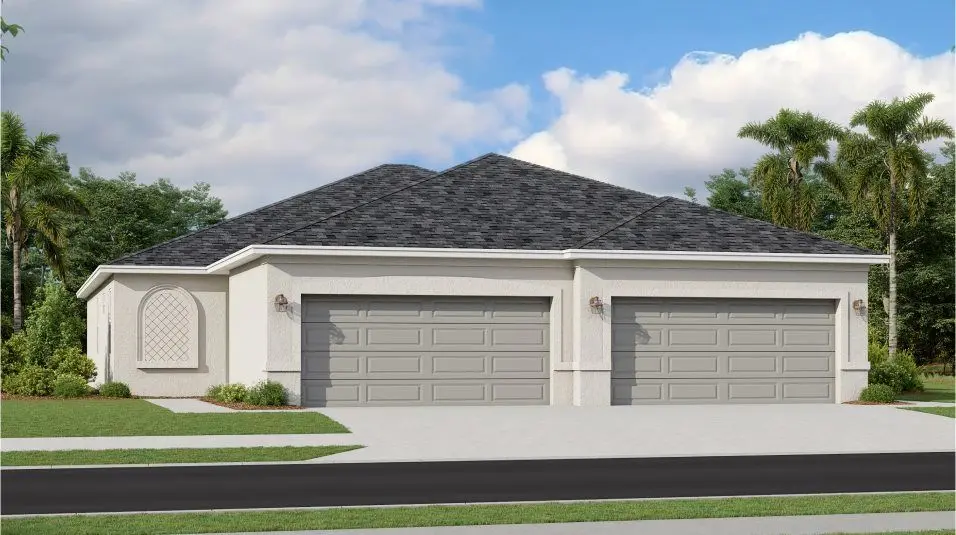
Welcome to Ibis Landing-a true golfer's paradise in Lehigh Acres, FL. This attached single-level home offers an airy design among the kitchen, dining room and living room with an outdoor lanai. The owner's suite at the end of the home offers privacy, while two secondary bedrooms and a full bathroom are tucked toward the front. Completing the layout is a two-car garage to add versatile storage room. Centered around a Gordon Lewis III-designed course, this scenic community features the highest elevated green in Fort Myers and sweeping panoramic views. With year-round sunshine, enjoy an effortless country club lifestyle in a natural oasis designed for your next chapter. The resort-style amenit
Key facts
- Two car garage
- Outdoor lanai
- Sprawling pool
Tags
Property features AI
Finance
- Financial info: List price $217,997
Exterior
- Parking: 2-car garage (2 total parking spaces)
- Home design: Single-family residence, active listing
- Exterior features: Living area of 1,417
Interior
- Bedrooms: 3 bedrooms
- Bathrooms: 2 full bathrooms
- Interior features: Spec-built Magnolia plan
Neighborhood map
What this means for you Summary
Snapshot
- This is a 3-bed/2.0-bath townhouse listed at $206k. Condition is rated good.
Deal economics
- At list price, monthly cash flow is $-35 ($-424/yr) — negative.
- To cash-flow at today's rent, offer at most $201k (2.5% below list).
- To meet the 1% rule (rent ≥ 1% of price), the offer needs to be $176k (14.7% below list).
- Recommended offer: $176k (14.7% below list) — sets the bar for 1% rule.
- Cap rate 6.1% vs local median 4.7% in Lehigh Acres — meaningfully above typical; check what's discounted (condition, days-on-market, listing class) to confirm the premium yield is real.
Location & tenants
- Location reads 59/100 on livability (#826 in FL) — a working-class tenant base; expect higher turnover. Strengths: cost of living A+, housing A+; Watch: crime C-, employment D+, schools D-.
- Lee (suburban): math 47% / reading 50% proficiency, ranked #42 of 73 in FL (top 58%) — families likely to look elsewhere, expect single-tenant / working-renter base with shorter leases.
- Market conditions: Rents soft (-0.8%/yr); 641 active listings in the ZIP; 40 comparable units currently listed for rent nearby; rentals at typical pace (median 25d on market — plan ~3-4 weeks tenant-placement turnaround); 15,411 units permitted in Lee County in 2024 (4,686 in 5+ unit buildings).
- This rent runs 41% of the median local income ($51k/yr) — at the standard rent-burdened threshold; future hikes will face affordability resistance.
Forward outlook
- Local home prices are declining (-3.0%/yr); year-one equity from $1k of loan paydown is wiped out by about $6k of value loss. Plan a longer hold.
- Lee County population projected at +44% by 2050 — long-run rental-demand tailwind backs the buy-and-hold thesis.
Negotiation context
- Only 11 days on market — expect competitive offers; lowballing is unlikely to land.
Questions for the listing agent
- What do current leases actually rent for vs. the listed asking? Can we see a recent rent roll and the last 12 months of T-12 income?
- Is there a deadline driving the sale (1031 exchange, divorce, estate, relocation)? That informs how much negotiation room exists.
- Schools are D-rated, which usually means shorter tenancies and higher turnover. Who's the typical renter profile here, and what's been the actual vacancy rate?
- The area grade is low — what's the realistic commute time and amenity access for the typical tenant pool here? Any planned neighborhood developments (good or bad) we should know about?
- What's the average days-on-market for RENTAL listings here right now (not sales)? A rising rental-DOM trend means longer vacancies and softer asking-rent achievability than the comps imply.
- What's the recent tenant-quality profile in this submarket — average credit score on applications, eviction rate, late-payment / NSF rate, and stable-employment percentage? A property-management company in the area should have these aggregated.
- How much new for-sale + rental construction is in the pipeline within 1–3 miles? Heavy new supply typically softens prices + rents 12–24 months out; constrained supply supports both.
Investment metrics
- 1% rule
- 0.85% ✗
- Cap rate
- 6.09%
- Cash-on-cash
- -0.74%
- DSCR
- 0.97
- GRM
- 9.8
CMA / ARV
- ARV (on-the-fly)
- $225,303
- Comps found
- 2
Show comp detail 2 sales within ~0.75 mi
| Address | Dist | Beds/Ba | Sqft | Sold | Price | $/sf | Match |
|---|---|---|---|---|---|---|---|
| 9322 Aegean Cir | 0.28mi | 3/2.0 | 1,391 (-2%) | 4mo | $195,500 | $141 | 80 |
| 9207 Aegean Cir | 0.29mi | 2/2.0 (-1) | 1,353 (-4%) | 5mo | $214,900 | $159 | 70 |
Match score weights: distance 35% · size 25% · config 20% · recency 20%. Top-matched comps best support the ARV.
Projected returns pro-forma
-3.0% appreciation · 0.0% rent growth · sell at horizon
- IRR
- -20.9%
- Equity multiple
- 0.29×
- Total profit
- $-40,756
- Equity at exit
- $30,715
- IRR
- -23.2%
- Equity multiple
- -0.01×
- Total profit
- $-58,185
- Equity at exit
- $17,811
Cash invested: $57,679 (down + closing). Projections, not guarantees.
Landlord ↔ Tenant lean methodology
- Overall (STATE)
- 87 Strongly Landlord-Friendly
- State Florida
- 87 Strongly Landlord-Friendly · R+3
- County
- — inherits STATE
- City
- — inherits STATE
ZIP-level market 33936
- Home prices YoY
- -19.9%
- Rents YoY
- -0.8%
- Active inventory
- 641
- Price-to-rent
- 9.8×
Monthly cashflow live
- Estimated rent
- $1,757 high interval (Pro) →
- Mortgage (P&I)
- −$1,080
- Tax est. 1.5%
- −$257 /mo · $3,090/yr
- Insurance
- −$86
- HOA
- −$0
- Vacancy / Maint / Mgmt
- −$369
- Net cashflow
- $-35
Break-even live
Sensitivity live
| Price | -10% $107 | -5% $36 | +0% $-35 | +5% $-107 | +10% $-178 |
|---|---|---|---|---|---|
| Rent | -10% $-174 | -5% $-105 | +0% $-35 | +5% $34 | +10% $103 |
| Rate | -1.0pp $68 | -0.5pp $17 | base $-35 | +0.5pp $-89 | +1.0pp $-143 |
UW: 25.0% down · 7.5% · 30yr · 1.5% tax · 5.0% vac · 8.0% maint · 8.0% mgmt
Financing live
Cash to close
- Down payment
- $51,499
- Closing costs
- $6,180
- Reserves months
- —
- Total cash needed
- —
Loan-product check · same deal, 3 products live
Conventional
25% down · 7.5% · 30yr
- Down + closing
- —
- Monthly P&I
- —
- Monthly cashflow
- —
- DSCR
- —
- Eligible?
- —
Personal DTI + credit; lowest rate.
DSCR
20% down · 8.5% · 30yr
- Down + closing
- —
- Monthly P&I
- —
- Monthly cashflow
- —
- DSCR
- —
- Eligible?
- —
No personal income docs; deal must DSCR.
Hard money
10% down · 12.0% · 12mo
- Down + closing
- —
- Monthly P&I
- —
- Monthly cashflow
- —
- DSCR
- —
- Eligible?
- —
Short-term bridge; refi at stabilization.
Rent comps 40 comps
| Address | Beds | Baths | Sqft | Rent | $/sqft | DOM | Units | Dist |
|---|---|---|---|---|---|---|---|---|
| 9249 Aegean Cir Lehigh Acres, FL | 2.0 | 2.0 | 1320 | $1,800 | $1.36 | 24d | 1 | 0.16mi |
| 18451 Copperhead Ct N #535 Lehigh Acres, FL | 2.0 | 2.0 | 1130 | $4,950 | $4.38 | 24d | 1 | 0.17mi |
| 18461 Copperhead Ct N #444 Lehigh Acres, FL | 2.0 | 2.0 | 1120 | $2,300 | $2.05 | 24d | 1 | 0.21mi |
| 18461 Copperhead Dr Unit 1546499P Lehigh Acres, FL | 2.0 | 2.0 | 1194 | $1,941 | $1.63 | 14d | 1 | 0.21mi |
| 9099 Leatherwood Loop Lehigh Acres, FL | 2.0 | 2.0 | 1564 | $2,400 | $1.53 | 24d | 1 | 0.22mi |
| 201 Alabama Rd S Lehigh Acres, FL | 3.0 | 1.0 | 920 | $1,275 | $1.39 | 3d | 1 | 0.25mi |
| 18411 Copperhead Dr #346 Lehigh Acres, FL | 2.0 | 2.0 | 1061 | $1,695 | $1.60 | 22d | 1 | 0.25mi |
| 18421 Copperhead Dr #222 Lehigh Acres, FL | 2.0 | 2.0 | 1154 | $1,700 | $1.47 | 24d | 1 | 0.27mi |
| 18261 Minorea Ln Lehigh Acres, FL | 2.0 | 2.0 | 1402 | $1,595 | $1.14 | 4d | 1 | 0.30mi |
| 18261 Minorea Ln Lehigh Acres, FL | 2.0 | 2.0 | 1402 | $1,800 | $1.28 | 24d | 1 | 0.30mi |
| 18266 Minorea Ln Lehigh Acres, FL | 3.0 | 2.0 | 1408 | $1,650 | $1.17 | 24d | 1 | 0.31mi |
| 18321 Gibraltar Ln Lehigh Acres, FL | 4.0 | 2.0 | 1203 | $1,675 | $1.39 | 24d | 1 | 0.32mi |
| 9177 Aegean Cir Lehigh Acres, FL | 4.0 | 2.0 | 1203 | $1,549 | $1.29 | 24d | 1 | 0.33mi |
| 18303 Gibraltar Ln Lehigh Acres, FL | 4.0 | 2.0 | 1203 | $1,599 | $1.33 | 24d | 1 | 0.33mi |
| 18303 Gibraltar Ln Lehigh Acres, FL | 4.0 | 2.0 | 1203 | $1,549 | $1.29 | 15d | 1 | 0.33mi |
| 9161 Aegean Cir Lehigh Acres, FL | 2.0 | 2.0 | 1120 | $1,650 | $1.47 | 14d | 1 | 0.36mi |
| 9112 Aegean Cir Lehigh Acres, FL | 3.0 | 2.0 | 1409 | $1,600 | $1.14 | 4d | 1 | 0.40mi |
| 10554 Quincy Ct Lehigh Acres, FL | 2.0 | 2.0 | 1004 | $1,300 | $1.29 | 20d | 1 | 0.40mi |
| 9137 Aegean Cir Lehigh Acres, FL | 2.0 | 2.0 | 1120 | $1,474 | $1.32 | 4d | 1 | 0.41mi |
| 9137 Aegean Cir Lehigh Acres, FL | 2.0 | 2.0 | 1120 | $1,474 | $1.32 | 24d | 1 | 0.41mi |
| 9131 Aegean Cir Lehigh Acres, FL | 3.0 | 2.0 | 1400 | $1,574 | $1.12 | 22d | 1 | 0.42mi |
| 9131 Aegean Cir Lehigh Acres, FL | 3.0 | 2.0 | 1400 | $1,574 | $1.12 | 24d | 1 | 0.42mi |
| 9123 Aegean Cir Lehigh Acres, FL | 2.0 | 2.0 | 1120 | $1,474 | $1.32 | 3d | 1 | 0.42mi |
| 26 Alabama Rd S Lehigh Acres, FL | 2.0 | 1.0 | 920 | $1,650 | $1.79 | 22d | 1 | 0.43mi |
| 10578 Quincy Ct Unit 1 Lehigh Acres, FL | 2.0 | 2.0 | 899 | $1,275 | $1.42 | 24d | 1 | 0.43mi |
| 9099 Aegean Cir Lehigh Acres, FL | 2.0 | 2.0 | 1120 | $1,499 | $1.34 | 24d | 1 | 0.44mi |
| 423 Morgan Cir S Lehigh Acres, FL | 3.0 | 1.0 | 920 | $1,450 | $1.58 | 24d | 1 | 0.45mi |
| 10525 Putnam Ct Lehigh Acres, FL | 2.0 | 2.0 | 1014 | $1,250 | $1.23 | 20d | 1 | 0.46mi |
| 423 Canyon Dr S Lehigh Acres, FL | 3.0 | 2.0 | 1830 | $1,550 | $0.85 | 24d | 1 | 0.47mi |
| 1112 Gifford Ave S Lehigh Acres, FL | 2.0 | 2.0 | 880 | $1,350 | $1.53 | 24d | 1 | 0.48mi |
| 1112 Gifford Ave S Lehigh Acres, FL | 2.0 | 2.0 | 880 | $1,350 | $1.53 | 4d | 1 | 0.48mi |
| 10625 Windsmont Ct Lehigh Acres, FL | 3.0 | 2.0 | 1080 | $1,350 | $1.25 | 24d | 1 | 0.49mi |
| 18461 Copperhead Dr #421 Lehigh Acres, FL | 3.0 | 2.0 | 1301 | $1,895 | $1.46 | 24d | 1 | 0.50mi |
| 18461 Copperhead Dr #436 Lehigh Acres, FL | 2.0 | 2.0 | 1154 | $3,495 | $3.03 | 24d | 1 | 0.50mi |
| 18461 Copperhead Dr #431 Lehigh Acres, FL | 3.0 | 2.0 | 1301 | $3,995 | $3.07 | 24d | 1 | 0.50mi |
| 424 Cactus Cir Lehigh Acres, FL | 3.0 | 2.0 | 1173 | $1,495 | $1.27 | 16d | 1 | 0.52mi |
| 59 Camelot Gardens Blvd #110 Lehigh Acres, FL | 2.0 | 2.0 | 1166 | $1,800 | $1.54 | 24d | 1 | 0.53mi |
| 10 Beth Stacey Blvd #206 Lehigh Acres, FL | 2.0 | 2.0 | 1012 | $1,100 | $1.09 | 4d | 1 | 0.59mi |
| 18451 Copperhead Dr #522 Lehigh Acres, FL | 2.0 | 2.0 | 1120 | $1,895 | $1.69 | 24d | 1 | 0.63mi |
| 1120 Vineyard St Lehigh Acres, FL | 2.0 | 1.0 | 1028 | $1,300 | $1.26 | 24d | 1 | 0.66mi |
Nearby sold comps map
Loading sold comps map…
Walkable amenities ~0.75 mi
Loading nearby amenities…
Taxation est. · year 1
- Rental income
- $21,087
- − Mortgage interest
- −$11,539
- − Property taxes
- −$3,090
- − Insurance
- −$1,030
- − Repairs & maintenance
- −$1,687
- − Management
- −$1,687
- − Depreciation
- −$5,993
- Taxable loss
- −$3,939
- Est. tax savings @ 24.0%
- +$945
- After-tax cash flow
- $521/yr
For passive investors: Depreciation is non-cash, so a rental often shows a tax loss while cash-flowing — sheltering income. Rental losses are passive: they offset passive income freely, and up to $25,000/yr can offset ordinary (W-2) income if you actively participate and your MAGI is under $100k (phasing out to $0 by $150k); unused losses carry forward. On sale, claimed depreciation is recaptured at up to 25%, and gains may owe capital-gains tax (a 1031 exchange can defer both). Figures are a year-1 estimate at your 24.0% rate — not tax advice; consult a CPA.
Condition & rehab AI · 12 photos
This attached single-level home in Lehigh Acres, FL, is in good condition with modern amenities and a well-maintained exterior. It offers a good investment opportunity with potential for modest improvements to enhance its curb appeal and value.
Value-add opportunities
- Both Painting exterior siding — Enhances curb appeal and can increase property value.
- Both Landscaping improvements — Enhances curb appeal and can increase property value.
- Both Add a smart home system — Improves convenience and can increase property value.
- Both Install smart thermostat — Saves energy and can increase property value.
- Both Add a smart lock — Enhances security and can increase property value.
Renovation cost estimate screening
Value-add ROI direction
- Both Painting exterior siding — Enhances curb appeal and can increase property value. ↑
- Both Landscaping improvements — Enhances curb appeal and can increase property value. ↑
- Both Add a smart home system — Improves convenience and can increase property value. ↑
- Both Install smart thermostat — Saves energy and can increase property value. ↑
- Both Add a smart lock — Enhances security and can increase property value. ↑
ⓘ Cost ranges are severity-bucket heuristics (US national rule-of-thumb). Get contractor quotes + a written scope before underwriting a rehab budget.
Schools (NCES district)
- District
- Lee
- NCES district ID
- 1201080
- Math proficiency
- 47% ▼ -11.00%
- Reading proficiency
- 50% ▼ -4.00%
- Median HH income
- $49,518
- Composite
- 41.49/100
- National rank
- #3458
- State rank
- #42 of 73 in FL
Livability — Lehigh Acres
- Score
- 59/100
- State rank
- #826
- US rank
- #20055
Category grades
Schools grade is shown separately in the Schools card above.
Census & demographics
- Census place
- Lehigh Acres, FL
- County
- Lee County · 788,662 people
- City population
- 130,638
- Metro
- Cape Coral-Fort Myers, FL
- Population (ZIP)
- 27,967
- Household income
- $51,417
- Rent vs Own
- Severe rent burden
- 1027.0
Population outlook (Lee County) Hauer SSP2
- Today (2025)
- 871,946 people
- By 2030
- 955,468 · +9.6%
- By 2040
- 1,113,587 · +27.7%
- By 2050
- 1,256,891 · +44.1%
- By 2075
- 1,560,270 · +78.9%
- By 2100
- 1,726,848 · +98.0%
Race, ethnicity, and origin ACS 2023
- Neighborhood character
- Diverse neighborhood (Simpson 0.63)
- Race & ethnicity
- Hispanic / Latino 44% White 41% Two or more races 21% Black 9% Asian 1%
- Hispanic origin (detail)
- Mexican 7% Puerto Rican 9% Cuban 18% Dominican 2%
- Common ancestry
- Hispanic 3% Romanian 2% Lithuanian 1%
- Foreign-born
- 28% · Canada, Jamaica
- Languages at home
- 59% English-only · Spanish 36% French/Haitian/Cajun 3% Tagalog/Filipino 1%
Political lean MEDSL · Lee
- 2024 margin
- Strong R (+28.4) · D 35.5% · R 63.9%
- 2008→2024 swing
- -18.0pp toward R · 2008: -10.4pp · 2024: -28.4pp
- All cycles
- 2024: R+28.4 2020: R+19.2 2016: R+20.4 2012: R+16.6 2008: R+10.4
Not yet ingested
- Civics
- —
Market trends
- HPI YoY
- ▼ -86.78%
- Current HPI
- 348.8631
- Rent YoY
- ▼ -0.77%
- Metro
- Cape Coral-Fort Myers, FL
- State GDP YoY
- ▲ 3.28%
- F500 in state
- 36
Industry mix (Fortune 500 HQ in FL)
| Industry | F500 HQs | Revenue |
|---|---|---|
| Industrial Technology | 2 | $29B |
|
||
| Insurance | 2 | $17B |
|
||
| Retail | 1 | $60B |
|
||
| Technology Distribution | 1 | $58B |
|
||
| Homebuilding | 1 | $35B |
|
||
| Technology Manufacturing | 1 | $35B |
|
||
Cash-flow waterfall
monthlySold comps — $/sqft
last 12 mo · ≤1 miLoading sold comps…