 Multi-family
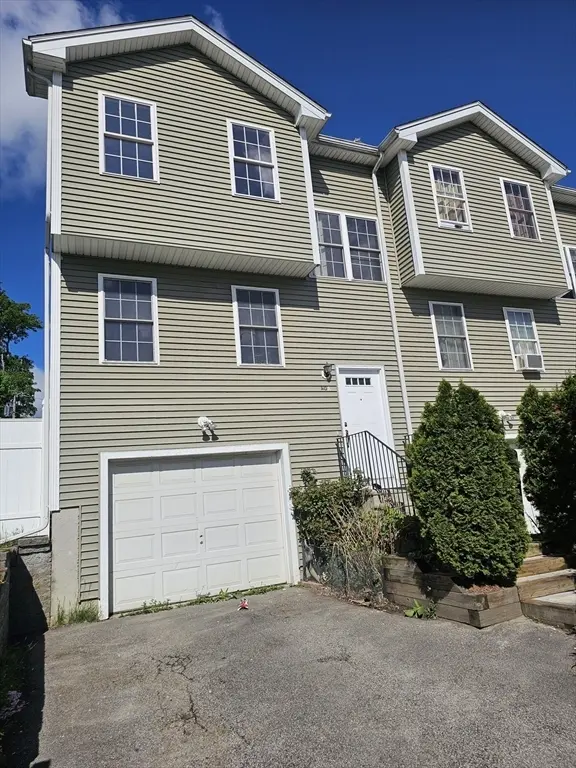
40 Merrick St Unit A · Worcester, MA
Flood risk 1/10 · Minimal
- FEMA flood zone
- X (unshaded)
- Chance of flooding over 30 yrs
- 0.0%
- Est. flood insurance / yr
- $473 – $860
Fire risk 1/10 · Minimal
- Est. fire insurance / yr
- $915 – $1,699
Heat risk 4/10 · Minor
- Hot days now (above 93°F)
- 7 days/yr
- Hot days in 30 yrs
- 16 days/yr
Wind risk 6/10 · Moderate
- Chance of severe wind over 30 yrs
- 27.0%
Air-quality risk 2/10 · Minimal
- Unhealthy air days now
- 1 days/yr
- Unhealthy air days in 30 yrs
- 2 days/yr
Risk factors via First Street. Map © Google.
Why this score? — see what drove the B- grade
The composite is a weighted blend of 9 inputs, each scored 0–100. Each bar is that input's sub-score; the figure is the points it added to the 100-point composite (weight × sub-score).
- Cash flow +25.9/30.0
- ARV discount +15.0/15.0
- DSCR +8.7/10.0
- 1% rule +6.3/10.0
- Livability +4.4/5.0
- Rent growth +3.3/5.0
- Condition / age +2.5/5.0
- Schools +2.0/10.0
- Appreciation +0.0/10.0
$409,000
🖨 Deal sheet (PDF) 📄 Offer letter ✓ Due diligence
Multi-family units
County records classify this as Multi-Family (2-4 Unit). Listing-text estimate: 1 unit. estimate disagrees with records
Listing remarks
Discover this beautifully updated 3-bedroom, 1.5-bath attached Colonial, perfectly located near the new Worcester stadium and surrounded by some of the city’s most breathtaking destinations. This young home features a large living room with gleaming hardwood floors, and a spacious kitchen equipped with stainless steel appliances. The dining room overlooks a private patio directly off the kitchen — ideal for family meals and entertaining. Upstairs, you’ll find 3 spacious bedrooms and 1.5 baths tucked away from the main living area, giving you the privacy and comfort you deserve. Additional highlights include a two-car garage for year-round convenience, plus a patio overlook
Key facts
- Level yard
- Spacious kitchen
- Large living room
Tags
Property features AI
Finance
- HOA & community: Community near public transportation, shopping, parks, walk/jog trails, medical facilities, highway access, houses of worship, public schools, T-Station, and university
Exterior
- Parking: Attached garage with 2 garage spaces; 2 covered spaces; 2 open parking spaces; Total of 4 parking spaces
- Utilities: Public water; Public sewer; 220V electrical service
- Home design: Single-family residence; Attached property
- Construction: Concrete perimeter foundation; Built as recorded in public records
- Exterior features: Public road frontage; Paved driveway and paved surfaces; Off-street parking; Under-cover parking
Interior
- Kitchen: Gas water heater
- Bathrooms: One full bathroom; One half bathroom
- Heating & cooling: Baseboard heating; Window air conditioning units
- Interior features: Five total rooms; Full basement
Neighborhood map
What this means for you Summary
Snapshot
- This is a 3-bed/1.5-bath multifamily listed at $409k.
Deal economics
- At list price, monthly cash flow is $999 ($12k/yr) — positive.
- The deal already cash-flows at list — no discount required.
- Meets the 1% rule at list price ($5k rent vs $409k).
- Recommended offer: $403k (1.5% below list) — sets the bar for market timing.
- Cap rate 9.2% vs local median 4.1% in Worcester — top-decile yield for the area; either an underpriced asset or a hidden risk that comps aren't pricing in. Stress-test before assuming the spread holds.
Location & tenants
- Location reads 87/100 on livability (#9 in MA, #312 nationally) — a professional / high-income tenant draw. Strengths: crime A+, amenities A+, commute A+; Watch: cost of living D.
- Worcester (urban): math 17% / reading 30% proficiency, ranked #280 of 302 in MA (top 93%) — low school quality limits family demand, transient renter base, plan for 1-2y turnover; 66% free/reduced lunch — lower-income household profile, screen leases tightly.
- Zoned schools: Elm Park Community (math 4% / reading 24%, grade F, #881 of 938 statewide, top 94%, 415 students, 0% FRL); Forest Grove Middle (math 19% / reading 31%, grade F, #234 of 305 statewide, top 77%, 897 students, 0% FRL); Doherty Memorial High (math 37% / reading 47%, grade F, #214 of 343 statewide, top 65%, 1,344 students, 0% FRL) — zoned schools average 0% FRL vs 66% district-wide (66 pts lower); this property's tenant base skews higher-income than the district average.
- Market conditions: Rents rising (+3.4%/yr); 50 active listings in the ZIP; 40 comparable units currently listed for rent nearby; rentals at typical pace (median 26d on market — plan ~3-4 weeks tenant-placement turnaround); 45% of comp listings sitting > 30 days — soft ceiling on asking rent; 2,293 units permitted in Worcester County in 2024 (1,205 in 5+ unit buildings).
- At $4,629/mo this rent would consume 81% of the median local household income ($68k/yr) (locally 1183% of renters already pay >50% of income on rent) — very limited rent-growth headroom before tenants either downsize or default.
Forward outlook
- Local home prices are declining (-3.0%/yr); year-one equity from $3k of loan paydown is wiped out by about $12k of value loss. Plan a longer hold.
- At projected returns (-3.0% appreciation + 3.4% rent growth), your $115k cash investment doubles in ~10 years — after that, you're playing with house money.
Negotiation context
- It's been on market 27 days — a 2% lower offer ($403k) is reasonable based on typical stale-listing flexibility.
- Current owner paid $170k; list at $409k implies a 141% gain — meaningful room to come down on a strong offer.
Risks & watch-outs
- Climate carrying-cost: major wind risk, 27% chance of damaging wind over 30y — expect insurance premiums to compound above CPI over the hold.
Questions for the listing agent
- Is there a deadline driving the sale (1031 exchange, divorce, estate, relocation)? That informs how much negotiation room exists.
- What's the average days-on-market for RENTAL listings here right now (not sales)? A rising rental-DOM trend means longer vacancies and softer asking-rent achievability than the comps imply.
- What's the recent tenant-quality profile in this submarket — average credit score on applications, eviction rate, late-payment / NSF rate, and stable-employment percentage? A property-management company in the area should have these aggregated.
- How much new apartment / multifamily construction is in the pipeline within 1–3 miles? Heavy new supply (>2% of stock underway) typically softens rents 12–24 months out; light construction supports rent growth.
Investment metrics
- 1% rule
- 1.13% ✓
- Cap rate
- 9.22%
- Cash-on-cash
- 10.47%
- DSCR
- 1.47
- GRM
- 7.4
CMA / ARV
- ARV (on-the-fly)
- $592,896
- Comps found
- 1
Show comp detail 1 sale within ~0.75 mi
| Address | Dist | Beds/Ba | Sqft | Sold | Price | $/sf | Match |
|---|---|---|---|---|---|---|---|
| 1 Dayton Pl | 0.42mi | 4/2.0 (+1) | 1,425 (-7%) | 10mo | $550,000 | $386 | 53 |
Match score weights: distance 35% · size 25% · config 20% · recency 20%. Top-matched comps best support the ARV.
Projected returns pro-forma
-3.0% appreciation · 3.38% rent growth · sell at horizon
- IRR
- -0.2%
- Equity multiple
- 0.99×
- Total profit
- $-886
- Equity at exit
- $60,983
- IRR
- 9.8%
- Equity multiple
- 1.77×
- Total profit
- $88,393
- Equity at exit
- $35,363
Cash invested: $114,520 (down + closing). Projections, not guarantees.
Landlord ↔ Tenant lean methodology
- Overall (STATE)
- 20 Strongly Tenant-Friendly
- State Massachusetts
- 20 Strongly Tenant-Friendly · D+15
- County
- — inherits STATE
- City
- — inherits STATE
ZIP-level market 01609
- Home prices YoY
- -15.9%
- Rents YoY
- 3.4%
- Active inventory
- 50
- Price-to-rent
- 14.7×
Monthly cashflow live
- Estimated rent
- $4,629 high interval (Pro) →
- Mortgage (P&I)
- −$2,145
- Tax from tax record
- −$342 /mo · $4,108/yr
- Insurance
- −$170
- HOA
- −$0
- Lot rent
- −$0
- Vacancy / Maint / Mgmt
- −$972
- Net cashflow
- $999
Break-even live
Sensitivity live
| Price | -10% $1,231 | -5% $1,115 | +0% $999 | +5% $884 | +10% $768 |
|---|---|---|---|---|---|
| Rent | -10% $634 | -5% $816 | +0% $999 | +5% $1,182 | +10% $1,365 |
| Rate | -1.0pp $1,205 | -0.5pp $1,103 | base $999 | +0.5pp $893 | +1.0pp $786 |
2-unit breakdown (identical units grouped — click to expand)
| Units | Beds | Baths | Est. rent |
|---|---|---|---|
| 2× units | 3 | 1.5 | $4,630 |
| #1 | 3 | 1.5 | $2,315 |
| #2 | 3 | 1.5 | $2,315 |
| Total (2 units) | $4,629 | ||
UW: 25.0% down · 7.5% · 30yr · 1.5% tax · 5.0% vac · 8.0% maint · 8.0% mgmt
Financing live
Cash to close
- Down payment
- $102,250
- Closing costs
- $12,270
- Reserves months
- —
- Total cash needed
- —
Loan-product check · same deal, 3 products live
Conventional
25% down · 7.5% · 30yr
- Down + closing
- —
- Monthly P&I
- —
- Monthly cashflow
- —
- DSCR
- —
- Eligible?
- —
Personal DTI + credit; lowest rate.
DSCR
20% down · 8.5% · 30yr
- Down + closing
- —
- Monthly P&I
- —
- Monthly cashflow
- —
- DSCR
- —
- Eligible?
- —
No personal income docs; deal must DSCR.
Hard money
10% down · 12.0% · 12mo
- Down + closing
- —
- Monthly P&I
- —
- Monthly cashflow
- —
- DSCR
- —
- Eligible?
- —
Short-term bridge; refi at stabilization.
Rent comps 40 comps
| Address | Beds | Baths | Sqft | Rent | $/sqft | DOM | Units | Dist |
|---|---|---|---|---|---|---|---|---|
| 15 Hawley St Unit 1 Worcester, MA | 3.0 | 2.0 | 1948 | $1,075 | $0.55 | 46d | 1 | 0.11mi |
| 15 Hawley St Unit 2 Worcester, MA | 3.0 | 2.0 | 1908 | $1,050 | $0.55 | 46d | 1 | 0.11mi |
| 23 Bellevue St Apt 1 Worcester, MA | 3.0 | 1.0 | 1100 | $2,400 | $2.18 | 25d | 1 | 0.12mi |
| 23 Bellevue St Apt 3 Worcester, MA | 4.0 | 1.0 | 1200 | $2,500 | $2.08 | 25d | 1 | 0.12mi |
| 23 Bellevue St Unit 2 Worcester, MA | 3.0 | 1.0 | 1100 | $2,450 | $2.23 | 25d | 1 | 0.12mi |
| 9 Townsend St Unit 3 Worcester, MA | 4.0 | 1.0 | 1500 | $2,200 | $1.47 | 46d | 1 | 0.12mi |
| 1 Pelham St Unit B Worcester, MA | 3.0 | 3.0 | 1656 | $2,895 | $1.75 | 46d | 1 | 0.14mi |
| 17 Congress St Unit 2 Worcester, MA | 3.0 | 1.0 | 1100 | $1,849 | $1.68 | 16d | 1 | 0.17mi |
| 127 Austin St Unit 3 Worcester, MA | 4.0 | 1.0 | 1100 | $1,900 | $1.73 | 25d | 1 | 0.17mi |
| 230 Pleasant St Unit 1 Worcester, MA | 4.0 | 1.0 | 1200 | $2,350 | $1.96 | 46d | 1 | 0.21mi |
| 230 Pleasant St Unit 2 Worcester, MA | 3.0 | 1.0 | 1600 | $2,150 | $1.34 | 46d | 1 | 0.21mi |
| 10 Cottage St Unit 1 Worcester, MA | 3.0 | 1.0 | 1250 | $2,500 | $2.00 | 46d | 1 | 0.24mi |
| 47 Piedmont St Unit 1 Worcester, MA | 3.0 | 1.0 | 1300 | $2,200 | $1.69 | 46d | 1 | 0.31mi |
| 47 Piedmont St #2 Worcester, MA | 3.0 | 1.0 | 1300 | $2,100 | $1.62 | 46d | 1 | 0.31mi |
| 36 Cedar St Unit 2 Worcester, MA | 2.0 | 2.0 | 1500 | $2,650 | $1.77 | 46d | 1 | 0.39mi |
| 36 Cedar St Unit 2A Worcester, MA | 2.0 | 2.0 | 1500 | $2,300 | $1.53 | 25d | 1 | 0.39mi |
| 345 Park Ave Unit 3R Worcester, MA | 2.0 | 1.0 | 1100 | $2,000 | $1.82 | 16d | 1 | 0.41mi |
| 345 Park Ave Unit 3R Worcester, MA | 2.0 | 1.0 | 1100 | $2,200 | $2.00 | 46d | 1 | 0.41mi |
| 24 Somerset St Unit 2 Worcester, MA | 2.0 | 1.0 | 1440 | $1,900 | $1.32 | 46d | 1 | 0.43mi |
| 36 Roxbury St Unit 1 Worcester, MA | 3.0 | 1.5 | 1100 | $2,450 | $2.23 | 21d | 1 | 0.48mi |
| 54 Woodland St Apt 3 Worcester, MA | 4.0 | 1.0 | 1550 | $2,350 | $1.52 | 25d | 1 | 0.51mi |
| 17 Hermon St Worcester, MA | 2.0 | 1.0–2.0 | 752 | $2,800 | $3.72 | 23d | 11 | 0.51mi |
| 6 Chatham St Worcester, MA | 2.0 | 1.0–2.0 | 943 | $3,700 | $3.92 | 46d | 3 | 0.53mi |
| 5 Madison St Worcester, MA | 2.0 | 1.0–2.0 | 811 | $3,720 | $4.59 | 25d | 1 | 0.57mi |
| 284 Highland St #3 Worcester, MA | 2.0 | 2.0 | 2000 | $4,900 | $2.45 | 23d | 1 | 0.58mi |
| 5 Mount Pleasant St Apt 2 Worcester, MA | 3.0 | 1.0 | 1422 | $2,500 | $1.76 | 46d | 1 | 0.63mi |
| 5 Mount Pleasant St Unit 3 Worcester, MA | 3.0 | 1.0 | 1422 | $2,200 | $1.55 | 16d | 1 | 0.63mi |
| 123 Mayfield St Unit 2 Worcester, MA | 2.0 | 1.0 | 1164 | $1,600 | $1.37 | 25d | 1 | 0.64mi |
| 17 Longfellow Rd Worcester, MA | 3.0 | 1.5 | 1774 | $4,000 | $2.25 | 25d | 1 | 0.65mi |
| 50 Franklin St Worcester, MA | 3.0 | 1.0 | 690 | $2,500 | $3.62 | 16d | 29 | 0.65mi |
| 14 Benefit Ter Unit 2 Worcester, MA | 4.0 | 1.0 | 1200 | $2,400 | $2.00 | 23d | 1 | 0.65mi |
| 16 Norwich St Unit 1 Worcester, MA | 2.0 | 2.0 | 1280 | $2,275 | $1.78 | 25d | 1 | 0.68mi |
| 58 Longfellow Rd Unit 2 Worcester, MA | 3.0 | 2.0 | 1800 | $3,000 | $1.67 | 46d | 1 | 0.69mi |
| 5 Oberlin St #2 Worcester, MA | 2.0 | 1.0 | 1200 | $1,950 | $1.62 | 46d | 1 | 0.69mi |
| 17 Wachusett St Unit 3 Worcester, MA | 3.0 | 1.0 | 1120 | $2,150 | $1.92 | 25d | 1 | 0.70mi |
| 5 Suburban Rd Worcester, MA | 1.0–2.0 | 1.0–2.0 | 1250 | $2,995 | $2.40 | 16d | 10 | 0.72mi |
| 97 Courtland St Unit 2 Worcester, MA | 3.0 | 1.0 | 1141 | $2,100 | $1.84 | 25d | 1 | 0.74mi |
| 352 Chandler St Unit 1 Worcester, MA | 3.0 | 1.0 | 1256 | $2,300 | $1.83 | 46d | 1 | 0.74mi |
| 23 Lancaster St Worcester, MA | 3.0 | 1.5 | 1768 | $2,800 | $1.58 | 16d | 1 | 0.76mi |
| 346 Lovell St Unit 3 Worcester, MA | 3.0 | 2.0 | 1500 | $2,250 | $1.50 | 46d | 1 | 0.76mi |
Listing history 20 events
-
2026-06-23days on market $409,000 Active 27 DOM
-
2026-06-22days on market $409,000 Active 26 DOM
-
2026-06-18days on market $409,000 Active 23 DOM
-
2026-06-17days on market $409,000 Active 22 DOM
-
2026-06-16days on market $409,000 Active 21 DOM
-
2026-06-15statusdays on market $409,000 Active 20 DOM
-
2026-06-14pricestatusdays on market $409,000 Price Changed 18 DOM
-
2026-06-10days on market $429,000 Active 15 DOM
-
2026-06-09days on market $429,000 Active 14 DOM
-
2026-06-08days on market $429,000 Active 13 DOM
-
2026-06-07days on market $429,000 Active 12 DOM
-
2026-06-05days on market $429,000 Active 9 DOM
-
2026-06-03days on market $429,000 Active 8 DOM
-
2026-06-02days on market $429,000 Active 7 DOM
-
2026-06-01days on market $429,000 Active 6 DOM
-
2026-05-31days on market $429,000 Active 5 DOM
-
2026-05-31statusdays on market $429,000 Active 4 DOM
-
2026-05-26$429,000 New
-
2007-08-30soldstatus $170,000
-
1993-11-04soldstatus $75,000
ⓘ Source: listings_history table (triggers on properties + properties_extension) + one-shot
backfill from property_details.listing_events for pre-trigger history.
Tax reassessment forecast MA · Partial reset (capped growth)
- Current annual tax
- $4,108 · $342/mo
- Projected year-2 tax
- $4,569 · $381/mo
- Expected delta
- +$461/yr (+$38/mo · 11.2%)
ⓘ Screening estimate from a state-policy table — verify with the county assessor before closing.
Climate risk First Street
- Flood 1/10 Low FEMA zone X (unshaded) · 0% chance over 30 yrs
- Wildfire 1/10 Low
- Heat 4/10 Moderate 7 d/yr ≥93°F today · 16 d/yr by 30 yrs out
- Wind 6/10 Major 27% chance of damaging wind over 30 yrs
- Air quality 2/10 Low 1 unhealthy d/yr today · 2 by 30 yrs out
Nearby sold comps map
Loading sold comps map…
Walkable amenities ~0.75 mi
Loading nearby amenities…
Taxation est. · year 1
- Rental income
- $55,548
- − Mortgage interest
- −$22,910
- − Property taxes
- −$4,108
- − Insurance
- −$2,045
- − Repairs & maintenance
- −$4,444
- − Management
- −$4,444
- − Depreciation
- −$11,898
- Taxable income
- $5,699
- Est. tax owed @ 24.0%
- −$1,368
- After-tax cash flow
- $10,624/yr
For passive investors: Depreciation is non-cash, so a rental often shows a tax loss while cash-flowing — sheltering income. Rental losses are passive: they offset passive income freely, and up to $25,000/yr can offset ordinary (W-2) income if you actively participate and your MAGI is under $100k (phasing out to $0 by $150k); unused losses carry forward. On sale, claimed depreciation is recaptured at up to 25%, and gains may owe capital-gains tax (a 1031 exchange can defer both). Figures are a year-1 estimate at your 24.0% rate — not tax advice; consult a CPA.
Schools (NCES district)
- District
- Worcester
- NCES district ID
- 2513230
- Math proficiency
- 17% ▼ -15.00%
- Reading proficiency
- 30% ▼ -8.00%
- Median HH income
- $45,063
- Composite
- 20.3/100
- National rank
- #8615
- State rank
- #280 of 302 in MA
Livability — Worcester
- Score
- 87/100
- State rank
- #9
- US rank
- #312
Category grades
Schools grade is shown separately in the Schools card above.
Census & demographics
- Census place
- Worcester, MA
- County
- Worcester County · 487,911 people
- City population
- 207,324
- Metro
- Worcester, MA-CT
- Population (ZIP)
- 22,047
- Household income
- $68,381
- Rent vs Own
- Severe rent burden
- 1183.0
Population outlook (Worcester County) Hauer SSP2
- Today (2025)
- 850,858 people
- By 2030
- 860,403 · +1.1%
- By 2040
- 869,902 · +2.2%
- By 2050
- 869,110 · +2.1%
- By 2075
- 870,120 · +2.3%
- By 2100
- 829,703 · -2.5%
Race, ethnicity, and origin ACS 2023
- Neighborhood character
- Diverse neighborhood (Simpson 0.58)
- Race & ethnicity
- White 61% Hispanic / Latino 18% Two or more races 11% Asian 10% Black 7%
- Hispanic origin (detail)
- Puerto Rican 10%
- Common ancestry
- Lithuanian 7% Romanian 4% Estonian 1%
- Foreign-born
- 22% · Canada, China, Vietnam
- Languages at home
- 66% English-only · Spanish 15% Other Indo-European 8% Vietnamese 3%
Political lean MEDSL · Worcester
- 2024 margin
- D (+10.0) · D 53.9% · R 43.9% · Other 2.2%
- 2008→2024 swing
- -3.8pp toward R · 2008: 13.8pp · 2024: 10.0pp
- All cycles
- 2024: D+10.0 2020: D+17.8 2016: D+10.5 2012: D+9.2 2008: D+13.8
Not yet ingested
- Civics
- —
Market trends
- HPI YoY
- ▼ -51.84%
- Current HPI
- 274.8097
- Rent YoY
- ▲ 3.38%
- Metro
- Worcester, MA-CT
- State GDP YoY
- ▲ 2.28%
- F500 in state
- 38
Industry mix (Fortune 500 HQ in MA)
| Industry | F500 HQs | Revenue |
|---|---|---|
| Technology | 3 | $17B |
|
||
| Insurance | 2 | $84B |
|
||
| Retail | 2 | $76B |
|
||
| Life Sciences | 1 | $43B |
|
||
| Energy Technology | 1 | $31B |
|
||
| Aerospace / Defense | 1 | $18B |
|
||
Price history
+472.0% since first listed3 events — show timeline
- 2026-05-26 Listed $429,000 MLS PIN
- 2007-08-30 Sold (Public Records) $170,000 Public Records
- 1993-11-04 Sold (Public Records) $75,000 Public Records
Property tax history
+4.1%/yrLatest (2023): $4,108 · +9.1% YoY. Source: county tax records.
Cash-flow waterfall
monthlySold comps — $/sqft
last 12 mo · ≤1 miLoading sold comps…