 Duplex
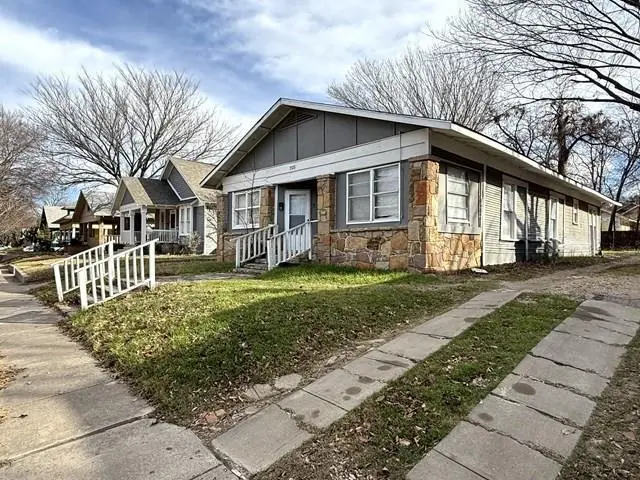
2115 Hurley Ave · Fort Worth, TX
Flood risk 1/10 · Minimal
- FEMA flood zone
- X (unshaded)
- Chance of flooding over 30 yrs
- 0.0%
- Est. flood insurance / yr
- $507 – $1,088
Fire risk 1/10 · Minimal
- Est. fire insurance / yr
- $1,222 – $2,270
Heat risk 8/10 · Major
- Hot days now (above 109°F)
- 7 days/yr
- Hot days in 30 yrs
- 24 days/yr
Wind risk 4/10 · Minor
- Chance of severe wind over 30 yrs
- 21.0%
Air-quality risk 3/10 · Minor
- Unhealthy air days now
- 3 days/yr
- Unhealthy air days in 30 yrs
- 4 days/yr
Risk factors via First Street. Map © Google.
Why this score? — see what drove the C+ grade
The composite is a weighted blend of 9 inputs, each scored 0–100. Each bar is that input's sub-score; the figure is the points it added to the 100-point composite (weight × sub-score).
- Cash flow +21.7/30.0
- ARV discount +15.0/15.0
- DSCR +6.9/10.0
- 1% rule +6.0/10.0
- Livability +4.0/5.0
- Rent growth +2.7/5.0
- Condition / age +2.5/5.0
- Schools +2.0/10.0
- Appreciation +0.0/10.0
$284,900
🖨 Deal sheet (PDF) 📄 Offer letter ✓ Due diligence
Multi-family units
County records classify this as Multi-Family (2-4 Unit). Listing-text estimate: 2 units. confirmed
Listing remarks MLS
Opportunity in the heart of Fort Worth—2115 Hurley Ave offers a duplex with two separate units, each featuring 2 bedrooms and 1 bathroom. Each unit includes its own living area, kitchen, and utility setup with individual gas and water meters. Interior finishes include a mix of carpet, vinyl, and wood flooring. Positioned on a single lot with on-street and open parking. Located near Magnolia Ave, the Near Southside district, Fort Worth Zoo, TCU, and major routes including I-35W and US-287, with access to dining, retail, and city amenities.
Key facts
- On-street parking
- Two separate units
- Access to retail
Tags
Neighborhood map
What this means for you Summary
Snapshot
- This is a 2 × 2-bed/1-bath units multifamily listed at $285k.
Deal economics
- At list price, monthly cash flow is $438 ($5k/yr) — positive. Per door: $219/mo.
- The deal already cash-flows at list — no discount required.
- Meets the 1% rule at list price ($3k rent vs $285k).
- Recommended offer: $268k (6.0% below list) — sets the bar for market timing.
- Cap rate 8.1% vs local median 3.9% in Fort Worth — top-decile yield for the area; either an underpriced asset or a hidden risk that comps aren't pricing in. Stress-test before assuming the spread holds.
Location & tenants
- Location reads 80/100 on livability (#49 in TX, #1,954 nationally) — a professional / high-income tenant draw. Strengths: amenities A+, cost of living A+, housing A+; Watch: schools D+, crime F.
- Fort Worth ISD (urban): math 18% / reading 28% proficiency, ranked #742 of 826 in TX (top 90%) — low school quality limits family demand, transient renter base, plan for 1-2y turnover; 73% free/reduced lunch — lower-income household profile, screen leases tightly.
- Market conditions: Rents flat; 151 active listings in the ZIP; 40 comparable units currently listed for rent nearby; rentals at typical pace (median 26d on market — plan ~3-4 weeks tenant-placement turnaround); 18,938 units permitted in Tarrant County in 2024 (8,336 in 5+ unit buildings).
- At $3,136/mo this rent would consume 54% of the median local household income ($70k/yr) (locally 1471% of renters already pay >50% of income on rent) — very limited rent-growth headroom before tenants either downsize or default.
Forward outlook
- Local home prices are declining (-3.0%/yr); year-one equity from $2k of loan paydown is wiped out by about $9k of value loss. Plan a longer hold.
- Tarrant County population projected at +41% by 2050 — long-run rental-demand tailwind backs the buy-and-hold thesis.
Negotiation context
- It's been on market 61 days — a 6% lower offer ($268k) is reasonable based on typical stale-listing flexibility.
- 3 sale attempts since 5y ago; this cycle's ask has dropped $15k (5%) from the opening price — seller is motivated, your offer sets the floor, not the list.
Risks & watch-outs
- Watch-outs: built in 1930 — expect roof / HVAC / electrical / plumbing capex.
- Climate carrying-cost: extreme-heat days projected 7→24/yr by 2055 (HVAC capex compounding) — expect insurance premiums to compound above CPI over the hold.
Questions for the listing agent
- It's been on market 61 days. Have you received any prior offers? Is the seller open to a 6% concession, seller financing, or rate buy-down credit?
- Can we see the unit-by-unit rent roll, current vacancy, and any below-market leases? What's the average tenancy length?
- What capital expenditures (roof, boiler, parking lot, exteriors) have been made in the last 5 years, and what's planned in the next 2?
- Built in 1930 — when were the roof, HVAC, electrical panel, plumbing, and water heater last replaced?
- Why hasn't it sold? Are there any deal-killer items the seller is aware of (foundation, flood, title, zoning, code violations)?
- Is there a deadline driving the sale (1031 exchange, divorce, estate, relocation)? That informs how much negotiation room exists.
- Schools are D-rated, which usually means shorter tenancies and higher turnover. Who's the typical renter profile here, and what's been the actual vacancy rate?
- Crime grade is F in this area — have there been break-ins, vandalism, or insurance claims at this property in the last 3 years? What carrier currently insures it and at what premium?
- What's the average days-on-market for RENTAL listings here right now (not sales)? A rising rental-DOM trend means longer vacancies and softer asking-rent achievability than the comps imply.
- What's the recent tenant-quality profile in this submarket — average credit score on applications, eviction rate, late-payment / NSF rate, and stable-employment percentage? A property-management company in the area should have these aggregated.
- How much new apartment / multifamily construction is in the pipeline within 1–3 miles? Heavy new supply (>2% of stock underway) typically softens rents 12–24 months out; light construction supports rent growth.
Investment metrics
- 1% rule
- 1.10% ✓
- Cap rate
- 8.14%
- Cash-on-cash
- 6.59%
- DSCR
- 1.29
- GRM
- 7.6
CMA / ARV
- ARV (median comp)
- $419,010
- List price
- $284,900
- Delta
- -32.01%
- Verdict
- UNDERPRICED
- Comps
- 12 within 1.0 mi
Projected returns pro-forma
-3.0% appreciation · 0.7% rent growth · sell at horizon
- IRR
- -8.8%
- Equity multiple
- 0.68×
- Total profit
- $-25,285
- Equity at exit
- $42,480
- IRR
- -2.8%
- Equity multiple
- 0.83×
- Total profit
- $-13,544
- Equity at exit
- $24,633
Cash invested: $79,772 (down + closing). Projections, not guarantees.
Landlord ↔ Tenant lean methodology
- Overall (STATE)
- 87 Strongly Landlord-Friendly
- State Texas
- 87 Strongly Landlord-Friendly · R+5
- County
- — inherits STATE
- City
- — inherits STATE
ZIP-level market 76110
- Rents YoY
- 0.7%
- Active inventory
- 151
- Price-to-rent
- 15.1×
Monthly cashflow live
- Estimated rent
- $3,136 high interval (Pro) →
- Mortgage (P&I)
- −$1,494
- Tax from tax record
- −$427 /mo · $5,122/yr
- Insurance
- −$119
- HOA
- −$0
- Vacancy / Maint / Mgmt
- −$659
- Net cashflow
- $438
Break-even live
Sensitivity live
| Price | -10% $599 | -5% $518 | +0% $438 | +5% $357 | +10% $277 |
|---|---|---|---|---|---|
| Rent | -10% $190 | -5% $314 | +0% $438 | +5% $562 | +10% $686 |
| Rate | -1.0pp $581 | -0.5pp $510 | base $438 | +0.5pp $364 | +1.0pp $289 |
2-unit breakdown (identical units grouped — click to expand)
| Units | Beds | Baths | Est. rent |
|---|---|---|---|
| 2× units | 2 | 1 | $3,136 |
| #1 | 2 | 1 | $1,568 |
| #2 | 2 | 1 | $1,568 |
| Total (2 units) | $3,136 | ||
UW: 25.0% down · 7.5% · 30yr · 1.5% tax · 5.0% vac · 8.0% maint · 8.0% mgmt
Financing live
Cash to close
- Down payment
- $71,225
- Closing costs
- $8,547
- Reserves months
- —
- Total cash needed
- —
Loan-product check · same deal, 3 products live
Conventional
25% down · 7.5% · 30yr
- Down + closing
- —
- Monthly P&I
- —
- Monthly cashflow
- —
- DSCR
- —
- Eligible?
- —
Personal DTI + credit; lowest rate.
DSCR
20% down · 8.5% · 30yr
- Down + closing
- —
- Monthly P&I
- —
- Monthly cashflow
- —
- DSCR
- —
- Eligible?
- —
No personal income docs; deal must DSCR.
Hard money
10% down · 12.0% · 12mo
- Down + closing
- —
- Monthly P&I
- —
- Monthly cashflow
- —
- DSCR
- —
- Eligible?
- —
Short-term bridge; refi at stabilization.
Rent comps 40 comps
| Address | Beds | Baths | Sqft | Rent | $/sqft | DOM | Units | Dist |
|---|---|---|---|---|---|---|---|---|
| 2101 Fairmount Ave Fort Worth, TX | 3.0 | 2.5 | 1516 | $3,200 | $2.11 | 3d | 1 | 0.06mi |
| 2200 6th Ave Fort Worth, TX | 3.0 | 3.0 | 1552 | $2,650 | $1.71 | 45d | 1 | 0.10mi |
| 2311 Warner Rd Fort Worth, TX | 3.0 | 2.0 | 2114 | $3,750 | $1.77 | 7d | 1 | 0.35mi |
| 2311 Warner Rd Fort Worth, TX | 3.0 | 2.0 | 2114 | $3,750 | $1.77 | 20d | 1 | 0.35mi |
| 1921 Ben Hall Ct Fort Worth, TX | 3.0 | 1.0 | 1507 | $2,850 | $1.89 | 11d | 1 | 0.35mi |
| 2532 Ryan Ave Fort Worth, TX | 3.0 | 2.0 | 1416 | $2,100 | $1.48 | 45d | 1 | 0.45mi |
| 2001 Park Hill Dr Fort Worth, TX | 1.0–3.0 | 1.0–2.0 | 1024 | $2,459 | $2.40 | 3d | 50 | 0.56mi |
| 2133 Edwin St Fort Worth, TX | 3.0 | 1.0 | 1225 | $1,595 | $1.30 | 25d | 1 | 0.66mi |
| 1741 W Cantey St Fort Worth, TX | 3.0 | 3.5 | 1882 | $2,400 | $1.28 | 4d | 1 | 0.70mi |
| 1208 W Magnolia Ave Fort Worth, TX | 4.0 | 2.0 | 1967 | $1,800 | $0.92 | 45d | 1 | 0.71mi |
| 2807 Stanley Ave Fort Worth, TX | 3.0 | 2.5 | 1906 | $2,395 | $1.26 | 25d | 1 | 0.73mi |
| 2828 Addison Park Ln Fort Worth, TX | 3.0 | 3.5 | 1936 | $2,495 | $1.29 | 22d | 1 | 0.77mi |
| 2712 Frazier Ave Fort Worth, TX | 3.0 | 2.0 | 1099 | $2,625 | $2.39 | 20d | 1 | 0.78mi |
| 2800 Gordon Ave Fort Worth, TX | 5.0 | 4.0 | 2143 | $4,800 | $2.24 | 45d | 1 | 0.78mi |
| 2806 Gordon Ave Fort Worth, TX | 5.0 | 4.0 | 2143 | $4,800 | $2.24 | 45d | 1 | 0.79mi |
| 1920 Saint Louis Ave Fort Worth, TX | 4.0 | 3.0 | 1484 | $1,745 | $1.18 | 45d | 1 | 0.80mi |
| 2816 Gordon Ave Fort Worth, TX | 3.0 | 3.0 | 1570 | $3,000 | $1.91 | 7d | 1 | 0.81mi |
| 2828 Livingston Ave Fort Worth, TX | 4.0 | 2.5 | 2208 | $3,500 | $1.59 | 0d | 1 | 0.81mi |
| 2911 Ryan Ave Fort Worth, TX | 3.0 | 2.0 | 1790 | $1,750 | $0.98 | 7d | 1 | 0.82mi |
| 1925 Saint Louis Ave Fort Worth, TX | 3.0 | 1.0 | 1219 | $1,695 | $1.39 | 45d | 1 | 0.83mi |
| 2700 Forest Park Blvd Fort Worth, TX | 5.0 | 5.5 | 2235 | $5,000 | $2.24 | 25d | 1 | 0.83mi |
| 2706 Forest Park Blvd Fort Worth, TX | 5.0 | 5.5 | 2230 | $5,000 | $2.24 | 25d | 1 | 0.84mi |
| 2803 Wayside Ave Fort Worth, TX | 3.0 | 2.0 | 1190 | $1,700 | $1.43 | 25d | 1 | 0.86mi |
| 2821 Frazier Ave Unit 2823 Fort Worth, TX | 3.0 | 2.0 | 1200 | $1,600 | $1.33 | 20d | 1 | 0.86mi |
| 2701 McCart Ave #101 Fort Worth, TX | 5.0 | 3.5 | 2095 | $4,500 | $2.15 | 25d | 1 | 0.86mi |
| 2714 McCart Ave Fort Worth, TX | 4.0 | 4.0 | 2090 | $4,800 | $2.30 | 20d | 1 | 0.90mi |
| 2236 Irwin St Fort Worth, TX | 3.0 | 2.5 | 1670 | $2,000 | $1.20 | 45d | 1 | 0.98mi |
| 2234 Irwin St Fort Worth, TX | 3.0 | 2.5 | 1670 | $2,000 | $1.20 | 45d | 1 | 0.99mi |
| 2204 W Rosedale St S Unit 2204 Fort Worth, TX | 3.0 | 2.0 | 1300 | $2,195 | $1.69 | 45d | 1 | 1.00mi |
| 2204 W Rosedale St S Unit 102 Fort Worth, TX | 3.0 | 2.0 | 1300 | $2,095 | $1.61 | 7d | 1 | 1.00mi |
| 2800 Sandage Ave Apt 203 Fort Worth, TX | 3.0 | 3.0 | 1931 | $3,300 | $1.71 | 7d | 1 | 1.01mi |
| 2932 Travis Ave Unit 2932 Fort Worth, TX | 3.0 | 2.0 | 1600 | $1,700 | $1.06 | 22d | 1 | 1.01mi |
| 2932 Forest Park Blvd Fort Worth, TX | 5.0 | 3.0 | 2230 | $4,500 | $2.02 | 25d | 1 | 1.07mi |
| 2821 Parmer Ave #125 Fort Worth, TX | 3.0 | 3.5 | 1898 | $2,350 | $1.24 | 45d | 1 | 1.12mi |
| 642 E Harvey Ave Fort Worth, TX | 4.0 | 2.0 | 1755 | $2,099 | $1.20 | 45d | 1 | 1.13mi |
| 2615 Cockrell Ave Fort Worth, TX | 3.0 | 2.0 | 1813 | $3,495 | $1.93 | 22d | 1 | 1.13mi |
| 2606 Cockrell Ave Fort Worth, TX | 3.0 | 2.0 | 2142 | $4,000 | $1.87 | 45d | 1 | 1.15mi |
| 3201 Ryan Ave Fort Worth, TX | 4.0 | 2.0 | 2000 | $2,100 | $1.05 | 45d | 1 | 1.17mi |
| 2701 Stuart Dr Fort Worth, TX | 3.0 | 3.0 | 2104 | $1,800 | $0.86 | 45d | 1 | 1.19mi |
| 1246 Lowe St Fort Worth, TX | 3.0 | 2.5 | 1752 | $1,895 | $1.08 | 16d | 1 | 1.19mi |
Listing history 24 events
-
2026-06-21days on market $284,900 Active 61 DOM
-
2026-06-18days on market $284,900 Active 58 DOM
-
2026-06-17days on market $284,900 Active 57 DOM
-
2026-06-16days on market $284,900 Active 56 DOM
-
2026-06-15days on market $284,900 Active 55 DOM
-
2026-06-13days on market $284,900 Active 53 DOM
-
2026-06-10price $284,900 Active 49 DOM
-
2026-06-09days on market $299,900 Active 49 DOM
-
2026-06-08days on market $299,900 Active 48 DOM
-
2026-06-07days on market $299,900 Active 47 DOM
-
2026-06-04days on market $299,900 Active 44 DOM
-
2026-06-03days on market $299,900 Active 43 DOM
-
2026-06-02days on market $299,900 Active 42 DOM
-
2026-06-01days on market $299,900 Active 41 DOM
-
2026-05-31days on market $299,900 Active 40 DOM
-
2026-04-21$299,900 Active 550-char remark
Show marketing remark (550 chars)
Opportunity in the heart of Fort Worth—2115 Hurley Ave offers a duplex with two separate units, each featuring 2 bedrooms and 1 bathroom. Each unit includes its own living area, kitchen, and utility setup with individual gas and water meters. Interior finishes include a mix of carpet, vinyl, and wood flooring. Positioned on a single lot with on-street and open parking. Located near Magnolia Ave, the Near Southside district, Fort Worth Zoo, TCU, and major routes including I-35W and US-287, with access to dining, retail, and city amenities.
-
2021-04-30soldstatus Sold 629-char remark
Show marketing remark (629 chars)
Historic full duplex in Fairmount District! This is a property with opportunities. Great area near TCU, Fort Worth Zoo, Downtown, Cultural District, Magnolia St, & medical district. Each unit is 2 Bedroom, 1 Bath. Unit A is occupied & rented below market at $595 month. Unit B is vacant. Market rent in area is $1000 - $1100 per month. Owner pays all utilities. Tenant in Unit A has defaulted on rent. Convert to single family home, keep as rental or live in one side & rent the other. SFR in the area selling for $225-230 Sq Ft. Drive by but do not disturb resident! As is sale. Buyer to verify all information.
-
2021-03-25status Pending 629-char remark
Show marketing remark (629 chars)
Historic full duplex in Fairmount District! This is a property with opportunities. Great area near TCU, Fort Worth Zoo, Downtown, Cultural District, Magnolia St, & medical district. Each unit is 2 Bedroom, 1 Bath. Unit A is occupied & rented below market at $595 month. Unit B is vacant. Market rent in area is $1000 - $1100 per month. Owner pays all utilities. Tenant in Unit A has defaulted on rent. Convert to single family home, keep as rental or live in one side & rent the other. SFR in the area selling for $225-230 Sq Ft. Drive by but do not disturb resident! As is sale. Buyer to verify all information.
-
2021-03-22status Active 629-char remark
Show marketing remark (629 chars)
Historic full duplex in Fairmount District! This is a property with opportunities. Great area near TCU, Fort Worth Zoo, Downtown, Cultural District, Magnolia St, & medical district. Each unit is 2 Bedroom, 1 Bath. Unit A is occupied & rented below market at $595 month. Unit B is vacant. Market rent in area is $1000 - $1100 per month. Owner pays all utilities. Tenant in Unit A has defaulted on rent. Convert to single family home, keep as rental or live in one side & rent the other. SFR in the area selling for $225-230 Sq Ft. Drive by but do not disturb resident! As is sale. Buyer to verify all information.
-
2021-02-25status Pending 629-char remark
Show marketing remark (629 chars)
Historic full duplex in Fairmount District! This is a property with opportunities. Great area near TCU, Fort Worth Zoo, Downtown, Cultural District, Magnolia St, & medical district. Each unit is 2 Bedroom, 1 Bath. Unit A is occupied & rented below market at $595 month. Unit B is vacant. Market rent in area is $1000 - $1100 per month. Owner pays all utilities. Tenant in Unit A has defaulted on rent. Convert to single family home, keep as rental or live in one side & rent the other. SFR in the area selling for $225-230 Sq Ft. Drive by but do not disturb resident! As is sale. Buyer to verify all information.
-
2021-02-05historical Active Option Contract 629-char remark
Show marketing remark (629 chars)
Historic full duplex in Fairmount District! This is a property with opportunities. Great area near TCU, Fort Worth Zoo, Downtown, Cultural District, Magnolia St, & medical district. Each unit is 2 Bedroom, 1 Bath. Unit A is occupied & rented below market at $595 month. Unit B is vacant. Market rent in area is $1000 - $1100 per month. Owner pays all utilities. Tenant in Unit A has defaulted on rent. Convert to single family home, keep as rental or live in one side & rent the other. SFR in the area selling for $225-230 Sq Ft. Drive by but do not disturb resident! As is sale. Buyer to verify all information.
-
2021-01-18$215,000 Active 629-char remark
Show marketing remark (629 chars)
Historic full duplex in Fairmount District! This is a property with opportunities. Great area near TCU, Fort Worth Zoo, Downtown, Cultural District, Magnolia St, & medical district. Each unit is 2 Bedroom, 1 Bath. Unit A is occupied & rented below market at $595 month. Unit B is vacant. Market rent in area is $1000 - $1100 per month. Owner pays all utilities. Tenant in Unit A has defaulted on rent. Convert to single family home, keep as rental or live in one side & rent the other. SFR in the area selling for $225-230 Sq Ft. Drive by but do not disturb resident! As is sale. Buyer to verify all information.
-
1987-10-06soldstatus
-
1987-05-05soldstatus
ⓘ Source: listings_history table (triggers on properties + properties_extension) + one-shot
backfill from property_details.listing_events for pre-trigger history.
Tax reassessment forecast TX · Resets to sale price
- Current annual tax
- $5,122 · $427/mo
- Projected year-2 tax
- $5,214 · $434/mo
- Expected delta
- +$91/yr (+$8/mo · 1.8%)
ⓘ Screening estimate from a state-policy table — verify with the county assessor before closing.
Climate risk First Street
- Flood 1/10 Low FEMA zone X (unshaded) · 0% chance over 30 yrs
- Wildfire 1/10 Low
- Heat 8/10 Severe 7 d/yr ≥109°F today · 24 d/yr by 30 yrs out
- Wind 4/10 Moderate 21% chance of damaging wind over 30 yrs
- Air quality 3/10 Moderate 3 unhealthy d/yr today · 4 by 30 yrs out
Nearby sold comps map
Loading sold comps map…
Walkable amenities ~0.75 mi
Loading nearby amenities…
Taxation est. · year 1
- Rental income
- $37,632
- − Mortgage interest
- −$15,959
- − Property taxes
- −$5,122
- − Insurance
- −$1,424
- − Repairs & maintenance
- −$3,011
- − Management
- −$3,011
- − Depreciation
- −$8,288
- Taxable income
- $817
- Est. tax owed @ 24.0%
- −$196
- After-tax cash flow
- $5,058/yr
For passive investors: Depreciation is non-cash, so a rental often shows a tax loss while cash-flowing — sheltering income. Rental losses are passive: they offset passive income freely, and up to $25,000/yr can offset ordinary (W-2) income if you actively participate and your MAGI is under $100k (phasing out to $0 by $150k); unused losses carry forward. On sale, claimed depreciation is recaptured at up to 25%, and gains may owe capital-gains tax (a 1031 exchange can defer both). Figures are a year-1 estimate at your 24.0% rate — not tax advice; consult a CPA.
Schools (NCES district)
- District
- Fort Worth ISD
- NCES district ID
- 4819700
- Math proficiency
- 18% ▼ -16.00%
- Reading proficiency
- 28% ▼ -6.00%
- Median HH income
- $42,109
- Composite
- 19.61/100
- National rank
- #8753
- State rank
- #742 of 826 in TX
Livability — Fort Worth
- Score
- 80/100
- State rank
- #49
- US rank
- #1954
Category grades
Schools grade is shown separately in the Schools card above.
Census & demographics
- Census place
- Fort Worth, TX
- County
- Tarrant County · 2,033,669 people
- City population
- 911,619
- Metro
- Dallas-Fort Worth-Arlington, TX
- Population (ZIP)
- 33,441
- Household income
- $69,790
- Rent vs Own
- Severe rent burden
- 1471.0
Population outlook (Tarrant County) Hauer SSP2
- Today (2025)
- 2,380,417 people
- By 2030
- 2,578,900 · +8.3%
- By 2040
- 2,974,995 · +25.0%
- By 2050
- 3,350,489 · +40.8%
- By 2075
- 4,216,909 · +77.2%
- By 2100
- 4,741,527 · +99.2%
Race, ethnicity, and origin ACS 2023
- Neighborhood character
- Majority Hispanic (63%)
- Race & ethnicity
- Hispanic / Latino 63% White 30% Two or more races 24% Black 2% Asian 2%
- Hispanic origin (detail)
- Mexican 57%
- Common ancestry
- Slovak 1% Italian 1% Lithuanian 1%
- Foreign-born
- 26% · Canada, China
- Languages at home
- 45% English-only · Spanish 52% Other Asian/Pacific 1% Other Indo-European 1%
Political lean MEDSL · Tarrant
- 2024 margin
- Lean R (+5.1) · D 46.7% · R 51.9% · Other 1.4%
- 2008→2024 swing
- +6.6pp toward D · 2008: -11.7pp · 2024: -5.1pp
- All cycles
- 2024: R+5.1 2020: D+0.2 2016: R+8.7 2012: R+15.7 2008: R+11.7
Not yet ingested
- Civics
- —
Market trends
- HPI YoY
- ▼ -194.46%
- Current HPI
- 274.8888
- Rent YoY
- ▲ 0.70%
- Metro
- Dallas-Fort Worth-Arlington, TX
- State GDP YoY
- ▲ 3.95%
- F500 in state
- 110
Industry mix (Fortune 500 HQ in TX)
| Industry | F500 HQs | Revenue |
|---|---|---|
| Energy | 16 | $1,198B |
|
||
| Technology | 5 | $198B |
|
||
| Engineering / Construction | 4 | $72B |
|
||
| Energy Services | 3 | $60B |
|
||
| Utilities | 3 | $41B |
|
||
| Healthcare | 2 | $330B |
|
||
Price history
+39.5% since first listed9 events — show timeline
- 2026-04-21 Listed $299,900 NTREIS
- 2021-04-30 Sold (MLS) — NTREIS
- 2021-03-25 Pending — NTREIS
- 2021-03-22 Relisted — NTREIS
- 2021-02-25 Pending — NTREIS
- 2021-02-05 Contingent — NTREIS
- 2021-01-18 Listed $215,000 NTREIS
- 1987-10-06 Sold (Public Records) — Public Records
- 1987-05-05 Sold (Public Records) — Public Records
Property tax history
+8.9%/yrLatest (2025): $5,122 · -12.2% YoY. Source: county tax records.
Cash-flow waterfall
monthlySold comps — $/sqft
last 12 mo · ≤1 miLoading sold comps…