 Duplex
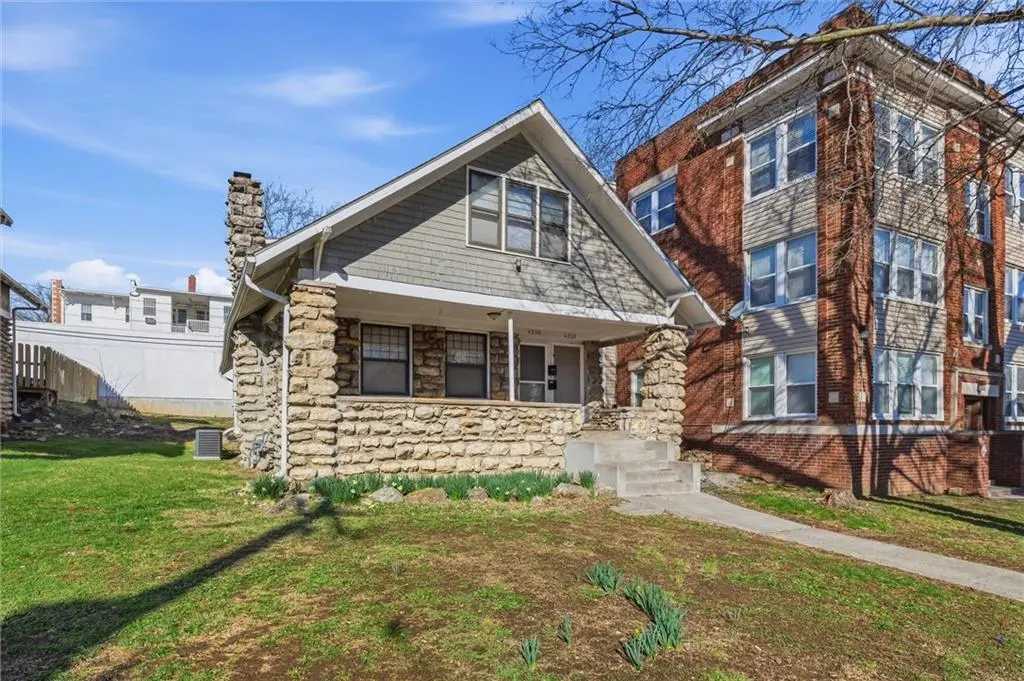
4230 Locust St · Kansas City, MO
Flood risk 1/10 · Minimal
- FEMA flood zone
- X (unshaded)
- Chance of flooding over 30 yrs
- 0.0%
- Est. flood insurance / yr
- $473 – $860
Fire risk 1/10 · Minimal
- Est. fire insurance / yr
- $1,054 – $1,958
Heat risk 4/10 · Minor
- Hot days now (above 106°F)
- 7 days/yr
- Hot days in 30 yrs
- 17 days/yr
Wind risk 2/10 · Minimal
- Chance of severe wind over 30 yrs
- —
Air-quality risk 3/10 · Minor
- Unhealthy air days now
- 2 days/yr
- Unhealthy air days in 30 yrs
- 4 days/yr
Risk factors via First Street. Map © Google.
Why this score? — see what drove the C grade
The composite is a weighted blend of 9 inputs, each scored 0–100. Each bar is that input's sub-score; the figure is the points it added to the 100-point composite (weight × sub-score).
- Cash flow +25.5/30.0
- DSCR +8.4/10.0
- ARV discount +7.5/15.0
- 1% rule +6.7/10.0
- Livability +3.9/5.0
- Rent growth +3.5/5.0
- Condition / age +2.5/5.0
- Schools +1.5/10.0
- Appreciation +0.0/10.0
$225,000
🖨 Deal sheet (PDF) 📄 Offer letter ✓ Due diligence
Multi-family units
County records classify this as Multi-Family (2-4 Unit). Listing-text estimate: 2 units. confirmed
Listing remarks MLS
Charming bungalow duplex in the heart of Midtown Kansas City! This 2,145 sq ft property features two separate units—lower unit offers 2 bedrooms, 1 bath with beautiful hardwood floors and original woodwork, while the upper unit includes 1 bedroom, 1 bath with a recently updated bathroom, each unit has its own private entrance. The property showcases timeless character with a stunning stone exterior, covered front porch, built-ins, and classic architectural details throughout. Situated on a 0.16-acre lot in a prime location near Gillham Park, streetcar stops, and Westport, offering convenient access to dining and entertainment. NOTE: The property is currently owned by a local nonprofit and is subject to an existing Missouri Housing Development Commission (MDHC) agreement through June 5, 2028. Buyer must be approved by MDHC and will be required to maintain reduced rental rates in accordance with the agreement until its expiration. Upon expiration, the property may be transitioned to market-rate rents.
Key facts
- 6,796 sq ft lot
- Built 1910
- Listed 75 days
Neighborhood map
What this means for you Summary
Snapshot
- This is a 1×2bd/1ba + 1×1bd/1ba units multifamily listed at $225k.
Deal economics
- At list price, monthly cash flow is $523 ($6k/yr) — positive. Per door: $261/mo.
- The deal already cash-flows at list — no discount required.
- Meets the 1% rule at list price ($3k rent vs $225k).
- Recommended offer: $212k (6.0% below list) — sets the bar for market timing.
- Cap rate 9.1% vs local median 3.9% in Kansas City — top-decile yield for the area; either an underpriced asset or a hidden risk that comps aren't pricing in. Stress-test before assuming the spread holds.
Location & tenants
- Location reads 78/100 on livability (#28 in MO, #2,671 nationally) — a middle-class / working-renter tenant base. Strengths: amenities A+, commute A+, cost of living A+; Watch: schools C-, crime F.
- Kansas City 33 (urban): math 12% / reading 24% proficiency, ranked #308 of 324 in MO (top 95%) — low school quality limits family demand, transient renter base, plan for 1-2y turnover; 75% free/reduced lunch — lower-income household profile, screen leases tightly.
- Market conditions: Rents rising (+4.0%/yr); tight market (median 1 DOM); 126 active listings in the ZIP; 40 comparable units currently listed for rent nearby; rentals at typical pace (median 17d on market — plan ~3-4 weeks tenant-placement turnaround); 4,002 units permitted in Jackson County in 2024 (2,271 in 5+ unit buildings).
- At $2,630/mo this rent would consume 50% of the median local household income ($63k/yr) (locally 962% of renters already pay >50% of income on rent) — very limited rent-growth headroom before tenants either downsize or default.
Forward outlook
- Local home prices are declining (-3.0%/yr); year-one equity from $2k of loan paydown is wiped out by about $7k of value loss. Plan a longer hold.
- Jackson County population projected at +4% by 2050 — modest demand growth; plan on rents tracking national, not racing it.
- At projected returns (-3.0% appreciation + 4.0% rent growth), your $63k cash investment doubles in ~10 years — after that, you're playing with house money.
Negotiation context
- It's been on market 76 days — a 6% lower offer ($212k) is reasonable based on typical stale-listing flexibility.
- 3 sale attempts since 6y ago with the ask held roughly flat each time — persistent listings suggest the price (not the market) is what's stuck; bring a comps-based counter.
Risks & watch-outs
- Watch-outs: built in 1910 — expect roof / HVAC / electrical / plumbing capex.
Questions for the listing agent
- It's been on market 76 days. Have you received any prior offers? Is the seller open to a 6% concession, seller financing, or rate buy-down credit?
- Can we see the unit-by-unit rent roll, current vacancy, and any below-market leases? What's the average tenancy length?
- What capital expenditures (roof, boiler, parking lot, exteriors) have been made in the last 5 years, and what's planned in the next 2?
- Built in 1910 — when were the roof, HVAC, electrical panel, plumbing, and water heater last replaced?
- Why hasn't it sold? Are there any deal-killer items the seller is aware of (foundation, flood, title, zoning, code violations)?
- Is there a deadline driving the sale (1031 exchange, divorce, estate, relocation)? That informs how much negotiation room exists.
- Crime grade is F in this area — have there been break-ins, vandalism, or insurance claims at this property in the last 3 years? What carrier currently insures it and at what premium?
- What's the average days-on-market for RENTAL listings here right now (not sales)? A rising rental-DOM trend means longer vacancies and softer asking-rent achievability than the comps imply.
- What's the recent tenant-quality profile in this submarket — average credit score on applications, eviction rate, late-payment / NSF rate, and stable-employment percentage? A property-management company in the area should have these aggregated.
- How much new apartment / multifamily construction is in the pipeline within 1–3 miles? Heavy new supply (>2% of stock underway) typically softens rents 12–24 months out; light construction supports rent growth.
Investment metrics
- 1% rule
- 1.17% ✓
- Cap rate
- 9.08%
- Cash-on-cash
- 9.96%
- DSCR
- 1.44
- GRM
- 7.1
CMA / ARV
- ARV (median comp)
- $622,254
- List price
- $225,000
- Delta
- -63.84%
- Verdict
- UNDERPRICED
- Comps
- 20 within 1.0 mi
Show comp detail 1 sale within ~0.75 mi
| Address | Dist | Beds/Ba | Sqft | Sold | Price | $/sf | Match |
|---|---|---|---|---|---|---|---|
| 4014 Oak St | 0.22mi | 2/2.0 (-1) | 1,844 (+6%) | 24mo | $261,000 | $142 | 54 |
Match score weights: distance 35% · size 25% · config 20% · recency 20%. Top-matched comps best support the ARV.
Projected returns pro-forma
-3.0% appreciation · 3.95% rent growth · sell at horizon
- IRR
- -0.2%
- Equity multiple
- 0.99×
- Total profit
- $-587
- Equity at exit
- $33,548
- IRR
- 10.4%
- Equity multiple
- 1.84×
- Total profit
- $53,140
- Equity at exit
- $19,454
Cash invested: $63,000 (down + closing). Projections, not guarantees.
Landlord ↔ Tenant lean methodology
- Overall (STATE)
- 81 Strongly Landlord-Friendly
- State Missouri
- 81 Strongly Landlord-Friendly · R+10
- County
- — inherits STATE
- City
- — inherits STATE
ZIP-level market 64110
- Rents YoY
- 4.0%
- Median DOM (111 sales)
- 1 d
- Active inventory
- 126
- Price-to-rent
- 13.8×
Monthly cashflow live
- Estimated rent
- $2,630 high interval (Pro) →
- Mortgage (P&I)
- −$1,180
- Tax est. 1.5%
- −$281 /mo · $3,375/yr
- Insurance
- −$94
- HOA
- −$0
- Vacancy / Maint / Mgmt
- −$552
- Net cashflow
- $523
Break-even live
Sensitivity live
| Price | -10% $678 | -5% $601 | +0% $523 | +5% $445 | +10% $367 |
|---|---|---|---|---|---|
| Rent | -10% $315 | -5% $419 | +0% $523 | +5% $627 | +10% $731 |
| Rate | -1.0pp $636 | -0.5pp $580 | base $523 | +0.5pp $464 | +1.0pp $405 |
2-unit breakdown (identical units grouped — click to expand)
| Units | Beds | Baths | Est. rent |
|---|---|---|---|
| 1× unit | 2 | 1 | $1,364 |
| 1× unit | 1 | 1 | $1,267 |
| Total (2 units) | $2,630 | ||
UW: 25.0% down · 7.5% · 30yr · 1.5% tax · 5.0% vac · 8.0% maint · 8.0% mgmt
Financing live
Cash to close
- Down payment
- $56,250
- Closing costs
- $6,750
- Reserves months
- —
- Total cash needed
- —
Loan-product check · same deal, 3 products live
Conventional
25% down · 7.5% · 30yr
- Down + closing
- —
- Monthly P&I
- —
- Monthly cashflow
- —
- DSCR
- —
- Eligible?
- —
Personal DTI + credit; lowest rate.
DSCR
20% down · 8.5% · 30yr
- Down + closing
- —
- Monthly P&I
- —
- Monthly cashflow
- —
- DSCR
- —
- Eligible?
- —
No personal income docs; deal must DSCR.
Hard money
10% down · 12.0% · 12mo
- Down + closing
- —
- Monthly P&I
- —
- Monthly cashflow
- —
- DSCR
- —
- Eligible?
- —
Short-term bridge; refi at stabilization.
Rent comps 40 comps
| Address | Beds | Baths | Sqft | Rent | $/sqft | DOM | Units | Dist |
|---|---|---|---|---|---|---|---|---|
| 406 E 43rd St Unit 3E Kansas City, MO | 2.0 | 1.0 | 1100 | $1,675 | $1.52 | 44d | 1 | 0.05mi |
| 4138 Locust St Kansas City, MO | 4.0 | 2.0 | 1763 | $2,600 | $1.47 | 8d | 1 | 0.09mi |
| 319 E 43rd St Unit 1 Kansas City, MO | 2.0 | 1.0 | 1100 | $1,470 | $1.34 | 15d | 1 | 0.09mi |
| 4333 Oak St Kansas City, MO | 2.0 | 2.0 | 1250 | $1,295 | $1.04 | 44d | 1 | 0.12mi |
| 4105 Oak St Kansas City, MO | 2.0 | 1.0 | 1200 | $1,250 | $1.04 | 44d | 1 | 0.18mi |
| 404 E 41st St Kansas City, MO | 4.0 | 3.0 | 1711 | $2,650 | $1.55 | 20d | 1 | 0.21mi |
| 4116 Walnut St Kansas City, MO | 2.0 | 2.0 | 1367 | $1,950 | $1.43 | 44d | 1 | 0.26mi |
| 4220 Harrison St Unit 1S Kansas City, MO | 3.0 | 2.0 | 1200 | $1,795 | $1.50 | 8d | 1 | 0.38mi |
| 4154 Harrison St Kansas City, MO | 2.0 | 1.0 | 1100 | $1,395 | $1.27 | 44d | 1 | 0.39mi |
| 3933 Kenwood Ave Kansas City, MO | 2.0 | 2.0 | 1050 | $2,295 | $2.19 | 5d | 1 | 0.39mi |
| 4031 Campbell St Kansas City, MO | 4.0 | 1.5 | 2074 | $2,500 | $1.21 | 17d | 1 | 0.42mi |
| 4111 Broadway Blvd Kansas City, MO | 2.0 | 1.0–2.0 | 881 | $2,090 | $2.37 | 2d | 38 | 0.48mi |
| 3830 Warwick Blvd Unit 1S Kansas City, MO | 3.0 | 2.0 | 1500 | $1,600 | $1.07 | 15d | 1 | 0.51mi |
| 4434 Mill Creek Pkwy Kansas City, MO | 3.0 | 2.0 | 1196 | $1,950 | $1.63 | 44d | 1 | 0.53mi |
| 133 E 46th St Kansas City, MO | 2.0 | 1.0 | 1300 | $1,295 | $1.00 | 8d | 1 | 0.54mi |
| 127 E 46th St Kansas City, MO | 2.0 | 1.0 | 1300 | $1,295 | $1.00 | 5d | 1 | 0.54mi |
| 4117 Forest Ave Kansas City, MO | 2.0 | 2.0 | 1300 | $1,390 | $1.07 | 24d | 1 | 0.56mi |
| 4545 Wornall Rd Kansas City, MO | 1.0–2.0 | 1.0–2.0 | 954 | $1,902 | $1.99 | 44d | 3 | 0.59mi |
| 4545 Wornall Rd Kansas City, MO | 2.0 | 2.0 | 1062 | $1,901 | $1.79 | 24d | 2 | 0.59mi |
| 918 E 39th St Kansas City, MO | 2.0 | 1.0 | 1050 | $1,175 | $1.12 | 44d | 1 | 0.59mi |
| 4228 Virginia Ave Kansas City, MO | 3.0 | 1.0 | 1200 | $1,250 | $1.04 | 11d | 1 | 0.63mi |
| 4232 Virginia Ave Unit 3 Kansas City, MO | 3.0 | 1.0 | 1296 | $1,100 | $0.85 | 13d | 1 | 0.63mi |
| 551 W 44th St Kansas City, MO | 1.0–3.0 | 1.0–3.5 | 1293 | $4,866 | $3.76 | 3d | 12 | 0.67mi |
| 4610 Forest Ave Kansas City, MO | 3.0 | 2.0 | 1365 | $2,450 | $1.79 | 44d | 1 | 0.69mi |
| 4800 Oak St Kansas City, MO | 1.0–3.0 | 1.0–2.0 | 967 | $2,604 | $2.69 | 2d | 18 | 0.69mi |
| 4614 Forest Ave Kansas City, MO | 2.0 | 2.0 | 1265 | $1,995 | $1.58 | 17d | 1 | 0.69mi |
| 333 W 46th Ter Kansas City, MO | 2.0 | 1.0–2.0 | 941 | $5,930 | $6.30 | 12d | 1 | 0.72mi |
| 4551 Pennsylvania Ave Kansas City, MO | 1.0–2.0 | 1.0–2.0 | 1080 | $7,459 | $6.90 | 11d | 1 | 0.73mi |
| 4415 Jefferson St #101 Kansas City, MO | 3.0 | 2.0 | 1304 | $2,125 | $1.63 | 44d | 1 | 0.73mi |
| 701 Westport Rd Kansas City, MO | 1.0–2.0 | 1.0–2.0 | 961 | $1,998 | $2.08 | 3d | 17 | 0.74mi |
| 610 W 46th St Kansas City, MO | 3.0 | 1.0–3.5 | 1824 | $2,600 | $1.43 | 3d | 3 | 0.80mi |
| 229 Ward Pkwy Unit 1 Kansas City, MO | 2.0 | 2.0 | 1100 | $2,400 | $2.18 | 44d | 1 | 0.85mi |
| 4505 Summit St Kansas City, MO | 2.0 | 2.0 | 1288 | $2,980 | $2.31 | 44d | 1 | 0.85mi |
| 641 W 39th Ter Kansas City, MO | 3.0 | 2.5 | 2187 | $2,790 | $1.28 | 8d | 1 | 0.86mi |
| 235 Ward Pkwy Kansas City, MO | 1.0–2.0 | 1.0–2.0 | 831 | $1,800 | $2.16 | 24d | 1 | 0.87mi |
| 4445 Madison Ave Kansas City, MO | 1.0–3.0 | 1.0–2.0 | 978 | $2,472 | $2.53 | 2d | 18 | 0.88mi |
| 760 W 46th St Kansas City, MO | 1.0–3.0 | 1.0–2.0 | 1342 | $3,140 | $2.34 | 15d | 1 | 0.88mi |
| 301 E Armour Blvd Kansas City, MO | 2.0 | 1.0–2.0 | 1023 | $2,050 | $2.00 | 2d | 9 | 0.91mi |
| 301 E Armour Blvd Kansas City, MO | 2.0 | 1.0–2.0 | 1023 | $2,105 | $2.06 | 44d | 8 | 0.91mi |
| 4541 Madison Ave Kansas City, MO | 2.0 | 2.5 | 1500 | $2,150 | $1.43 | 44d | 1 | 0.92mi |
Listing history 22 events
-
2026-06-21days on market $225,000 Active 76 DOM
-
2026-06-18days on market $225,000 Active 73 DOM
-
2026-06-17days on market $225,000 Active 72 DOM
-
2026-06-16days on market $225,000 Active 71 DOM
-
2026-06-15days on market $225,000 Active 70 DOM
-
2026-06-13days on market $225,000 Active 68 DOM
-
2026-06-09days on market $225,000 Active 64 DOM
-
2026-06-08days on market $225,000 Active 63 DOM
-
2026-06-07days on market $225,000 Active 62 DOM
-
2026-06-05days on market $225,000 Active 59 DOM
-
2026-06-03days on market $225,000 Active 58 DOM
-
2026-06-02days on market $225,000 Active 57 DOM
-
2026-06-01days on market $225,000 Active 56 DOM
-
2026-05-31days on market $225,000 Active 55 DOM
-
2026-04-07$225,000 Active 1020-char remark
Show marketing remark (1020 chars)
Charming bungalow duplex in the heart of Midtown Kansas City! This 2,145 sq ft property features two separate units—lower unit offers 2 bedrooms, 1 bath with beautiful hardwood floors and original woodwork, while the upper unit includes 1 bedroom, 1 bath with a recently updated bathroom, each unit has its own private entrance. The property showcases timeless character with a stunning stone exterior, covered front porch, built-ins, and classic architectural details throughout. Situated on a 0.16-acre lot in a prime location near Gillham Park, streetcar stops, and Westport, offering convenient access to dining and entertainment. NOTE: The property is currently owned by a local nonprofit and is subject to an existing Missouri Housing Development Commission (MDHC) agreement through June 5, 2028. Buyer must be approved by MDHC and will be required to maintain reduced rental rates in accordance with the agreement until its expiration. Upon expiration, the property may be transitioned to market-rate rents.
-
2026-04-06historical $225,000 1020-char remark
Show marketing remark (1020 chars)
Charming bungalow duplex in the heart of Midtown Kansas City! This 2,145 sq ft property features two separate units—lower unit offers 2 bedrooms, 1 bath with beautiful hardwood floors and original woodwork, while the upper unit includes 1 bedroom, 1 bath with a recently updated bathroom, each unit has its own private entrance. The property showcases timeless character with a stunning stone exterior, covered front porch, built-ins, and classic architectural details throughout. Situated on a 0.16-acre lot in a prime location near Gillham Park, streetcar stops, and Westport, offering convenient access to dining and entertainment. NOTE: The property is currently owned by a local nonprofit and is subject to an existing Missouri Housing Development Commission (MDHC) agreement through June 5, 2028. Buyer must be approved by MDHC and will be required to maintain reduced rental rates in accordance with the agreement until its expiration. Upon expiration, the property may be transitioned to market-rate rents.
-
2021-02-25historical
-
2021-02-24status Active
-
2020-11-07status Pending
-
2020-10-22$225,000 Active
-
1997-06-30soldstatus
-
1984-02-01soldstatus
ⓘ Source: listings_history table (triggers on properties + properties_extension) + one-shot
backfill from property_details.listing_events for pre-trigger history.
Climate risk First Street
- Flood 1/10 Low FEMA zone X (unshaded) · 0% chance over 30 yrs
- Wildfire 1/10 Low
- Heat 4/10 Moderate 7 d/yr ≥106°F today · 17 d/yr by 30 yrs out
- Wind 2/10 Low
- Air quality 3/10 Moderate 2 unhealthy d/yr today · 4 by 30 yrs out
Nearby sold comps map
Loading sold comps map…
Walkable amenities ~0.75 mi
Loading nearby amenities…
Taxation est. · year 1
- Rental income
- $31,560
- − Mortgage interest
- −$12,603
- − Property taxes
- −$3,375
- − Insurance
- −$1,125
- − Repairs & maintenance
- −$2,525
- − Management
- −$2,525
- − Depreciation
- −$6,545
- Taxable income
- $2,861
- Est. tax owed @ 24.0%
- −$687
- After-tax cash flow
- $5,587/yr
For passive investors: Depreciation is non-cash, so a rental often shows a tax loss while cash-flowing — sheltering income. Rental losses are passive: they offset passive income freely, and up to $25,000/yr can offset ordinary (W-2) income if you actively participate and your MAGI is under $100k (phasing out to $0 by $150k); unused losses carry forward. On sale, claimed depreciation is recaptured at up to 25%, and gains may owe capital-gains tax (a 1031 exchange can defer both). Figures are a year-1 estimate at your 24.0% rate — not tax advice; consult a CPA.
Schools (NCES district)
- District
- Kansas City 33
- NCES district ID
- 2916400
- Math proficiency
- 12% ▼ -8.00%
- Reading proficiency
- 24% ▬ 0.00%
- Median HH income
- $35,227
- Composite
- 14.8/100
- National rank
- #9387
- State rank
- #308 of 324 in MO
Livability — Kansas City
- Score
- 78/100
- State rank
- #28
- US rank
- #2671
Category grades
Schools grade is shown separately in the Schools card above.
Census & demographics
- Census place
- Kansas City, MO
- County
- Jackson County · 687,798 people
- City population
- 439,467
- Metro
- Kansas City, MO-KS
- Population (ZIP)
- 16,878
- Household income
- $63,044
- Rent vs Own
- Severe rent burden
- 962.0
Population outlook (Jackson County) Hauer SSP2
- Today (2025)
- 719,589 people
- By 2030
- 731,456 · +1.6%
- By 2040
- 746,689 · +3.8%
- By 2050
- 749,289 · +4.1%
- By 2075
- 736,227 · +2.3%
- By 2100
- 668,210 · -7.1%
Race, ethnicity, and origin ACS 2023
- Neighborhood character
- Diverse neighborhood (Simpson 0.63)
- Race & ethnicity
- White 49% Black 34% Two or more races 10% Hispanic / Latino 9% Asian 2%
- Hispanic origin (detail)
- Mexican 6%
- Common ancestry
- Romanian 2% Lithuanian 2% Italian 2%
- Foreign-born
- 4% · Canada
- Languages at home
- 92% English-only · Spanish 6% French/Haitian/Cajun 1% Other Indo-European 1%
Political lean MEDSL · Jackson
- 2024 margin
- D (+19.3) · D 58.9% · R 39.5% · Other 1.6%
- 2008→2024 swing
- -6.1pp toward R · 2008: 25.4pp · 2024: 19.3pp
- All cycles
- 2024: D+19.3 2020: D+22.0 2016: D+16.6 2012: D+19.0 2008: D+25.4
Not yet ingested
- Civics
- —
Market trends
- HPI YoY
- ▼ -514.37%
- Current HPI
- 371.8501
- Rent YoY
- ▲ 3.95%
- Metro
- Kansas City, MO-KS
- State GDP YoY
- ▲ 1.84%
- F500 in state
- 20
Industry mix (Fortune 500 HQ in MO)
| Industry | F500 HQs | Revenue |
|---|---|---|
| Healthcare | 1 | $163B |
|
||
| Insurance | 1 | $21B |
|
||
| Industrial Technology | 1 | $17B |
|
||
| Retail | 1 | $16B |
|
||
| Industrial Distribution | 1 | $10B |
|
||
| Utilities | 1 | $9B |
|
||
Price history
+0.0% since first listed8 events — show timeline
- 2026-04-07 Listed $225,000 Heartland MLS as Distributed by MLS Grid
- 2026-04-06 Coming Soon $225,000 Heartland MLS as Distributed by MLS Grid
- 2021-02-25 Listing Removed — Heartland MLS as Distributed by MLS Grid
- 2021-02-24 Relisted — Heartland MLS as Distributed by MLS Grid
- 2020-11-07 Pending — Heartland MLS as Distributed by MLS Grid
- 2020-10-22 Listed $225,000 Heartland MLS as Distributed by MLS Grid
- 1997-06-30 Sold (Public Records) — Public Records
- 1984-02-01 Sold (Public Records) — Public Records
Cash-flow waterfall
monthlySold comps — $/sqft
last 12 mo · ≤1 miLoading sold comps…