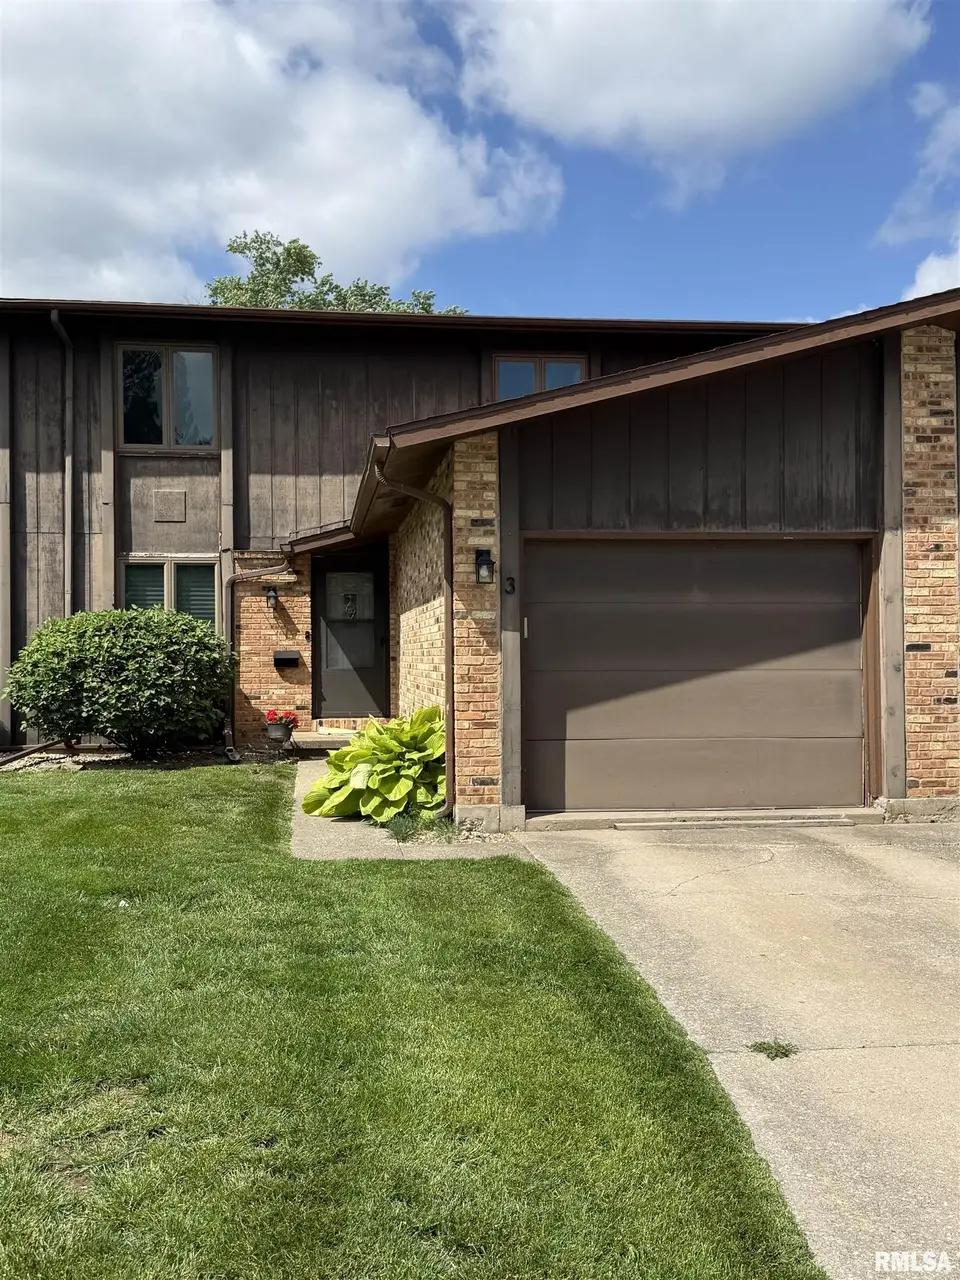
3 Cedar Dr · Macomb, IL
Flood risk 1/10 · Minimal
- FEMA flood zone
- —
- Chance of flooding over 30 yrs
- 0.0%
- Est. flood insurance / yr
- —
Fire risk 3/10 · Minor
- Est. fire insurance / yr
- $804 – $1,492
Heat risk 3/10 · Minor
- Hot days now (above 107°F)
- 7 days/yr
- Hot days in 30 yrs
- 17 days/yr
Wind risk 2/10 · Minimal
- Chance of severe wind over 30 yrs
- —
Air-quality risk 2/10 · Minimal
- Unhealthy air days now
- 1 days/yr
- Unhealthy air days in 30 yrs
- 1 days/yr
Risk factors via First Street. Map © Google.
Why this score? — see what drove the F grade
The composite is a weighted blend of 9 inputs, each scored 0–100. Each bar is that input's sub-score; the figure is the points it added to the 100-point composite (weight × sub-score).
- ARV discount +7.5/15.0
- Cash flow +5.4/30.0
- 1% rule +4.9/10.0
- Livability +3.5/5.0
- Rent growth +2.5/5.0
- Condition / age +2.5/5.0
- Schools +1.8/10.0
- DSCR +0.0/10.0
- Appreciation +0.0/10.0
$89,900
🖨 Deal sheet 📄 Offer letter ✓ Due diligence
Listing remarks
This move-in ready 3 bed - 3 bath home offers comfortable living with the convenience of a HOA that takes care of the mowing and much of the exterior maintenance. This home offers updated windows and doors. The main level has luxury vinyl plank throughout and a 1/2 bath for the guests. The kitchen is tastefully updated and includes all appliances. The upstairs has newer carpeting and there are 3 bedrooms. The primary bedroom is good size and offers double closets and 1/2 bath en-suite. There is also a tastefully updated full bath on the upper level. The basement is wide open and is great for storage and could easily have a Rec Room or Theater Room created. Outside you can enjoy your private
Key facts
- Updated windows
- Luxury vinyl plank
- Double closets
Tags
Property features AI
Finance
- HOA & community: Association fee of $100 that includes lawn care
Exterior
- Parking: Attached 1-car garage
- Utilities: Public water and public sewer
- Home design: Single-family residence; Two levels; Built in 1975; Property faces within R1 single-family zoning
- Construction: Shingle roof
- Exterior features: Level lot; Paved road access
Interior
- Kitchen: Kitchen includes refrigerator and microwave
- Bedrooms: Three bedrooms (all on upper level)
- Flooring: Carpet in bedrooms; Luxury vinyl plank in living, dining, and kitchen
- Bathrooms: One full bathroom and two half bathrooms
- Heating & cooling: Forced air heating (electric); Central air conditioning
- Interior features: Full, unfinished basement; Replacement windows; Dishwasher, Dryer, Microwave, Refrigerator, Washer
- Laundry & utility: Washer and dryer included
Neighborhood map
What this means for you Summary
Snapshot
- This is a 3-bed/2.0-bath other listed at $90k.
Deal economics
- At list price, monthly cash flow is $-198 ($-2k/yr) — negative.
- To cash-flow at today's rent, offer at most $71k (21.5% below list).
- To meet the 1% rule (rent ≥ 1% of price), the offer needs to be $89k (0.7% below list).
- Recommended offer: $71k (21.5% below list) — sets the bar for cash-flow.
- Cap rate 3.7% vs local median 6.2% in Macomb — below-typical yield; the buyer is paying a premium for something (appreciation thesis, condition, location) that the cap rate doesn't capture.
Location & tenants
- Location reads 70/100 on livability (#379 in IL) — a middle-class / working-renter tenant base. Strengths: cost of living A+, health & safety A+, housing B; Watch: crime D, amenities D, commute F.
- Macomb CUSD 185 (town): math 19% / reading 26% proficiency, ranked #410 of 620 in IL (top 66%) — low school quality limits family demand, transient renter base, plan for 1-2y turnover.
- Zoned schools: Macomb Junior High School (math 21% / reading 32%, grade F, #312 of 665 statewide, top 48%, 308 students, 0% FRL); Macomb Senior High School (math 27% / reading 37%, grade F, #157 of 693 statewide, top 25%, 622 students, 0% FRL) — zoned schools average 0% FRL vs 40% district-wide (40 pts lower); this property's tenant base skews higher-income than the district average.
- Market conditions: 135 active listings in the ZIP.
Forward outlook
- Local home prices are declining (-3.0%/yr); year-one equity from $622 of loan paydown is wiped out by about $3k of value loss. Plan a longer hold.
Negotiation context
- It's been on market 28 days — a 2% lower offer ($89k) is reasonable based on typical stale-listing flexibility.
Risks & watch-outs
- Watch-outs: property tax is 3.9% of price.
Questions for the listing agent
- What do current leases actually rent for vs. the listed asking? Can we see a recent rent roll and the last 12 months of T-12 income?
- Built in 1975 — when were the roof, HVAC, electrical panel, plumbing, and water heater last replaced?
- Property tax is high relative to price — has the assessment been appealed recently, and will the sale trigger a re-assessment?
- What does the HOA fee cover, when was the last increase, and are there any pending special assessments or reserve-fund shortfalls?
- Is there a deadline driving the sale (1031 exchange, divorce, estate, relocation)? That informs how much negotiation room exists.
- Schools are D-rated, which usually means shorter tenancies and higher turnover. Who's the typical renter profile here, and what's been the actual vacancy rate?
- Crime grade is D in this area — have there been break-ins, vandalism, or insurance claims at this property in the last 3 years? What carrier currently insures it and at what premium?
- The area grade is low — what's the realistic commute time and amenity access for the typical tenant pool here? Any planned neighborhood developments (good or bad) we should know about?
- What's the average days-on-market for RENTAL listings here right now (not sales)? A rising rental-DOM trend means longer vacancies and softer asking-rent achievability than the comps imply.
- What's the recent tenant-quality profile in this submarket — average credit score on applications, eviction rate, late-payment / NSF rate, and stable-employment percentage? A property-management company in the area should have these aggregated.
- How much new for-sale + rental construction is in the pipeline within 1–3 miles? Heavy new supply typically softens prices + rents 12–24 months out; constrained supply supports both.
Investment metrics
- 1% rule
- 0.99% ✗
- Cap rate
- 3.65%
- Cash-on-cash
- -9.43%
- DSCR
- 0.58
- GRM
- 8.4
CMA / ARV
No comps found within radius.
Projected returns pro-forma
-3.0% appreciation · 3.0% rent growth · sell at horizon
- IRR
- -32.8%
- Equity multiple
- -0.07×
- Total profit
- $-26,974
- Equity at exit
- $13,404
- IRR
- -37.1%
- Equity multiple
- -0.55×
- Total profit
- $-38,946
- Equity at exit
- $7,773
Cash invested: $25,172 (down + closing). Projections, not guarantees.
Landlord ↔ Tenant lean methodology
- Overall (STATE)
- 43 Moderately Tenant-Leaning
- State Illinois
- 43 Moderately Tenant-Leaning · D+7
- County
- — inherits STATE
- City
- — inherits STATE
ZIP-level market 61455
- Home prices YoY
- -33.3%
- Active inventory
- 135
- Price-to-rent
- 8.4×
Monthly cashflow live
- Estimated rent
- $893 medium interval (Pro) →
- Mortgage (P&I)
- −$471
- Tax from tax record
- −$294 /mo · $3,527/yr
- Insurance
- −$37
- HOA
- −$100
- Vacancy / Maint / Mgmt
- −$187
- Net cashflow
- $-198
Break-even live
UW: 25.0% down · 7.5% · 30yr · 1.5% tax · 5.0% vac · 8.0% maint · 8.0% mgmt
Financing live
Cash to close
- Down payment
- $22,475
- Closing costs
- $2,697
- Reserves months
- —
- Total cash needed
- —
Loan-product check · same deal, 3 products live
Conventional
25% down · 7.5% · 30yr
- Down + closing
- —
- Monthly P&I
- —
- Monthly cashflow
- —
- DSCR
- —
- Eligible?
- —
Personal DTI + credit; lowest rate.
DSCR
20% down · 8.5% · 30yr
- Down + closing
- —
- Monthly P&I
- —
- Monthly cashflow
- —
- DSCR
- —
- Eligible?
- —
No personal income docs; deal must DSCR.
Hard money
10% down · 12.0% · 12mo
- Down + closing
- —
- Monthly P&I
- —
- Monthly cashflow
- —
- DSCR
- —
- Eligible?
- —
Short-term bridge; refi at stabilization.
HOA detail
- Monthly dues
- $100 · $1,200/yr
- Likely covers
- exterior maint.
Listing history 17 events
-
2026-06-19days on market $89,900 Active 28 DOM
-
2026-06-18days on market $89,900 Active 27 DOM
-
2026-06-17days on market $89,900 Active 26 DOM
-
2026-06-16days on market $89,900 Active 25 DOM
-
2026-06-15days on market $89,900 Active 24 DOM
-
2026-06-14days on market $89,900 Active 22 DOM
-
2026-06-12days on market $89,900 Active 21 DOM
-
2026-06-09days on market $89,900 Active 18 DOM
-
2026-06-08days on market $89,900 Active 17 DOM
-
2026-06-07days on market $89,900 Active 16 DOM
-
2026-06-04days on market $89,900 Active 12 DOM
-
2026-06-02days on market $89,900 Active 11 DOM
-
2026-06-01days on market $89,900 Active 10 DOM
-
2026-05-31days on market $89,900 Active 9 DOM
-
2026-05-31days on market $89,900 Active 8 DOM
-
2026-05-22$89,900 Active
-
2021-08-06historical
ⓘ Source: listings_history table (triggers on properties + properties_extension) + one-shot
backfill from property_details.listing_events for pre-trigger history.
Tax reassessment forecast IL · Partial reset (capped growth)
- Current annual tax
- $3,527 · $294/mo
- Projected year-2 tax
- $3,527 · $294/mo
- Expected delta
- $0/yr ($0/mo · 0.0%)
ⓘ Screening estimate from a state-policy table — verify with the county assessor before closing.
Climate risk First Street
- Flood 1/10 Low 0% chance over 30 yrs
- Wildfire 3/10 Moderate
- Heat 3/10 Moderate 7 d/yr ≥107°F today · 17 d/yr by 30 yrs out
- Wind 2/10 Low
- Air quality 2/10 Low 1 unhealthy d/yr today · 1 by 30 yrs out
Nearby sold comps map
Loading sold comps map…
Walkable amenities ~0.75 mi
Loading nearby amenities…
Taxation est. · year 1
- Rental income
- $10,711
- − Mortgage interest
- −$5,036
- − Property taxes
- −$3,527
- − Insurance
- −$450
- − Repairs & maintenance
- −$857
- − Management
- −$857
- − HOA
- −$1,200
- − Depreciation
- −$2,615
- Taxable loss
- −$3,831
- Est. tax savings @ 24.0%
- +$919
- After-tax cash flow
- $-1,453/yr
For passive investors: Depreciation is non-cash, so a rental often shows a tax loss while cash-flowing — sheltering income. Rental losses are passive: they offset passive income freely, and up to $25,000/yr can offset ordinary (W-2) income if you actively participate and your MAGI is under $100k (phasing out to $0 by $150k); unused losses carry forward. On sale, claimed depreciation is recaptured at up to 25%, and gains may owe capital-gains tax (a 1031 exchange can defer both). Figures are a year-1 estimate at your 24.0% rate — not tax advice; consult a CPA.
Schools (NCES district)
- District
- Macomb CUSD 185
- NCES district ID
- 1723920
- Math proficiency
- 19% ▼ -7.00%
- Reading proficiency
- 26% ▼ -8.00%
- Median HH income
- $34,162
- Composite
- 18.45/100
- National rank
- #8927
- State rank
- #410 of 620 in IL
Livability — Macomb
- Score
- 70/100
- State rank
- #379
- US rank
- #7918
Category grades
Schools grade is shown separately in the Schools card above.
Census & demographics
- Census place
- Macomb, IL
- County
- McDonough County · 17,317 people
- City population
- 17,317
- Metro
- Macomb, IL
- Population (ZIP)
- 17,317
- Household income
- $48,679
- Rent vs Own
- Severe rent burden
- 1062.0
Population outlook (McDonough County) Hauer SSP2
- Today (2025)
- 33,242 people
- By 2030
- 33,318 · +0.2%
- By 2040
- 33,520 · +0.8%
- By 2050
- 33,630 · +1.2%
- By 2075
- 33,657 · +1.2%
- By 2100
- 33,127 · -0.3%
Race, ethnicity, and origin ACS 2023
- Neighborhood character
- Predominantly White (81%)
- Race & ethnicity
- White 81% Black 9% Two or more races 5% Hispanic / Latino 5% Asian 3%
- Common ancestry
- Romanian 3% Italian 3% Iranian 2%
- Foreign-born
- 4% · Canada, South Korea, China
- Languages at home
- 94% English-only · Spanish 2% Other Indo-European 1% Russian/Polish/Slavic 1%
Political lean MEDSL · McDonough
- 2024 margin
- R (+18.9) · D 39.7% · R 58.5% · Other 1.8%
- 2008→2024 swing
- -24.4pp toward R · 2008: 5.6pp · 2024: -18.9pp
- All cycles
- 2024: R+18.9 2020: R+16.6 2016: R+11.7 2012: R+1.5 2008: D+5.6
Not yet ingested
- Civics
- —
Market trends
- HPI YoY
- ▼ -70.20%
- Current HPI
- 140.4351
- Rent YoY
- —
- Metro
- Macomb, IL
- State GDP YoY
- ▲ 1.59%
- F500 in state
- 60
Industry mix (Fortune 500 HQ in IL)
| Industry | F500 HQs | Revenue |
|---|---|---|
| Insurance | 4 | $201B |
|
||
| Consumer Goods | 4 | $87B |
|
||
| Industrial Machinery | 3 | $64B |
|
||
| Healthcare | 2 | $55B |
|
||
| Retail / Pharmacy | 1 | $148B |
|
||
| Agriculture / Food | 1 | $86B |
|
||
Price history
2 events — show timeline
- 2026-05-22 Listed $89,900 RMLSA as Distributed by MLS Grid
- 2021-08-06 Listing Removed — RMLSA as Distributed by MLS Grid
Property tax history
+7.1%/yrLatest (2024): $3,527 · -2.5% YoY. Source: county tax records.
Cash-flow waterfall
monthlySold comps — $/sqft
last 12 mo · ≤1 miLoading sold comps…