139 W Academy St · San Antonio, TX
Flood risk 1/10 · Minimal
- FEMA flood zone
- X (unshaded)
- Chance of flooding over 30 yrs
- 0.0%
- Est. flood insurance / yr
- $507 – $1,088
Fire risk 1/10 · Minimal
- Est. fire insurance / yr
- $1,222 – $2,270
Heat risk 8/10 · Major
- Hot days now (above 108°F)
- 7 days/yr
- Hot days in 30 yrs
- 22 days/yr
Wind risk 8/10 · Major
- Chance of severe wind over 30 yrs
- 80.0%
Air-quality risk 2/10 · Minimal
- Unhealthy air days now
- 1 days/yr
- Unhealthy air days in 30 yrs
- 2 days/yr
Risk factors via First Street. Map © Google.
Why this score? — see what drove the F grade
The composite is a weighted blend of 9 inputs, each scored 0–100. Each bar is that input's sub-score; the figure is the points it added to the 100-point composite (weight × sub-score).
- Cash flow +6.8/30.0
- ARV discount +5.4/15.0
- Livability +4.0/5.0
- Appreciation +3.9/10.0
- Rent growth +2.5/5.0
- Condition / age +2.5/5.0
- 1% rule +2.3/10.0
- Schools +1.3/10.0
- DSCR +1.0/10.0
$189,000
🖨 Deal sheet (PDF) 📄 Offer letter ✓ Due diligence
Listing remarks MLS
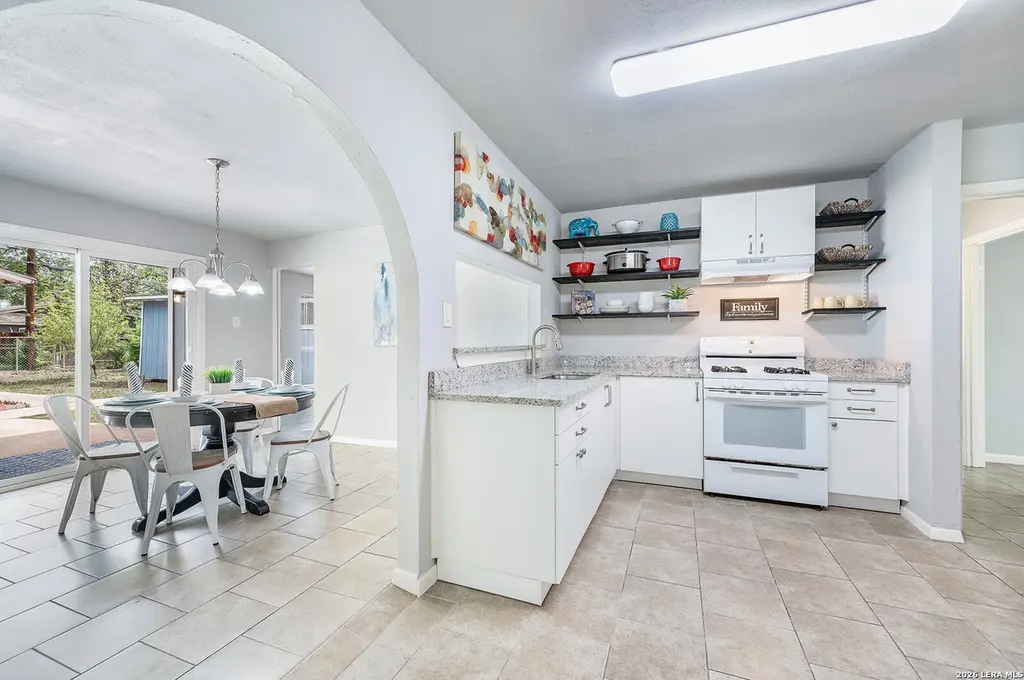
POTENTIAL, POTENTIAL, POTENTIAL!! Come check out this 2/2 investor's special featuring a detached apartment/mother-in-law suite with its own kitchen, living area, and full bath.
Key facts
- Large concrete patio
- Walk-in closet
- New kitchen cabinets
Tags
Property features AI
Finance
- Other: Possession at closing/funding; For sale
- Financial info: Down payment assistance resources available
- HOA & community: Located in the EDGEWOOD subdivision
Exterior
- Utilities: Water system; Sewer system; Natural gas available
- Home design: Pre-owned single-family style; Approximate age: 69 years
- Construction: Siding exterior; Composition roof; Slab foundation
- Exterior features: Shed; Additional kitchen (main level); Additional living room (main level)
Interior
- Kitchen: Gas cooking; Stove/Range; Kitchen 12 x 11
- Bedrooms: Master bedroom (split): 17 x 13; Bedroom 2: 11 x 11; Bedroom 3: 10 x 11; Bedroom 4: 9 x 11
- Flooring: Ceramic tile; Vinyl
- Bathrooms: 3 full bathrooms; Master bathroom with shower only and single vanity (8 x 8)
- Heating & cooling: Electric and natural gas heating; Window unit heating; 3+ window air conditioning units
- Interior features: Ceiling fans; Chandelier; Two living areas; Separate dining room; Utility room inside; All window coverings remain; Solid counter tops; City garbage service
- Laundry & utility: Washer connection; Dryer connection
Neighborhood map
What this means for you Summary
Snapshot
- This is a 2-bed/1.0-bath single-family listed at $189k.
Deal economics
- At list price, monthly cash flow is $-294 ($-4k/yr) — negative.
- To cash-flow at today's rent, offer at most $137k (27.5% below list).
- To meet the 1% rule (rent ≥ 1% of price), the offer needs to be $137k (27.5% below list).
- Recommended offer: $137k (27.5% below list) — sets the bar for 1% rule.
Location & tenants
- Location reads 80/100 on livability (#31 in TX, #1,616 nationally) — a professional / high-income tenant draw. Strengths: amenities A+, commute A+, cost of living A+; Watch: crime F.
- Edgewood ISD (urban): math 12% / reading 21% proficiency, ranked #812 of 826 in TX (top 98%) — low school quality limits family demand, transient renter base, plan for 1-2y turnover.
- Zoned schools: Winston Int of Excellence (209 students, 88% FRL, charter); Brentwood Middle (math 12% / reading 21%, grade F, #1,536 of 1,662 statewide, top 93%, 600 students, 95% FRL, charter); John F Kennedy H S (math 17% / reading 18%, grade F, #1,451 of 1,632 statewide, top 89%, 1,042 students, 92% FRL) — zoned schools average 92% FRL vs 24% district-wide (67 pts higher); higher-poverty schools than district average — tighter screening recommended.
- Market conditions: 9 active listings in the ZIP; 14 comparable units currently listed for rent nearby; rentals at typical pace (median 26d on market — plan ~3-4 weeks tenant-placement turnaround); 8,308 units permitted in Bexar County in 2024 (2,506 in 5+ unit buildings).
Forward outlook
- Local home prices are declining (-2.3%/yr); year-one equity from $1k of loan paydown is wiped out by about $4k of value loss. Plan a longer hold.
- Bexar County population projected at +50% by 2050 — long-run rental-demand tailwind backs the buy-and-hold thesis.
Negotiation context
- It's been on market 17 days — a 2% lower offer ($186k) is reasonable based on typical stale-listing flexibility.
- 4 sale attempts since 7y ago with the ask held roughly flat each time — persistent listings suggest the price (not the market) is what's stuck; bring a comps-based counter.
Risks & watch-outs
- Watch-outs: built in 1957 — expect roof / HVAC / electrical / plumbing capex.
- Climate carrying-cost: severe wind risk, 80% chance of damaging wind over 30y; extreme-heat days projected 7→22/yr by 2055 (HVAC capex compounding) — expect insurance premiums to compound above CPI over the hold.
Questions for the listing agent
- What do current leases actually rent for vs. the listed asking? Can we see a recent rent roll and the last 12 months of T-12 income?
- Built in 1957 — when were the roof, HVAC, electrical panel, plumbing, and water heater last replaced?
- Is there a deadline driving the sale (1031 exchange, divorce, estate, relocation)? That informs how much negotiation room exists.
- Crime grade is F in this area — have there been break-ins, vandalism, or insurance claims at this property in the last 3 years? What carrier currently insures it and at what premium?
- The area grade is low — what's the realistic commute time and amenity access for the typical tenant pool here? Any planned neighborhood developments (good or bad) we should know about?
- What's the average days-on-market for RENTAL listings here right now (not sales)? A rising rental-DOM trend means longer vacancies and softer asking-rent achievability than the comps imply.
- What's the recent tenant-quality profile in this submarket — average credit score on applications, eviction rate, late-payment / NSF rate, and stable-employment percentage? A property-management company in the area should have these aggregated.
- How much new for-sale + rental construction is in the pipeline within 1–3 miles? Heavy new supply typically softens prices + rents 12–24 months out; constrained supply supports both.
Investment metrics
- 1% rule
- 0.73% ✗
- Cap rate
- 4.43%
- Cash-on-cash
- -6.66%
- DSCR
- 0.70
- GRM
- 11.5
CMA / ARV
- ARV (on-the-fly)
- $180,624
- Comps found
- 7
Show comp detail 7 sales within ~0.75 mi
| Address | Dist | Beds/Ba | Sqft | Sold | Price | $/sf | Match |
|---|---|---|---|---|---|---|---|
| 3123 Neptune St | 0.27mi | 3/2.0 (+1) | 1,296 (+2%) | 5mo | $239,000 | $184 | 71 |
| 2143 Calle Del Sol | 0.28mi | 3/2.0 (+1) | 1,292 (+2%) | 5mo | $184,999 | $143 | 71 |
| 2115 SW 19th St | 0.62mi | 3/2.0 (+1) | 1,334 (+5%) | 2mo | $230,000 | $172 | 52 |
| 1051 Kirk Pl | 0.29mi | 3/2.0 (+1) | 1,421 (+12%) | 22mo | $165,000 | $116 | 40 |
| 830 Cavalier Ave | 0.65mi | 2/2.0 | 1,167 (-8%) | 21mo | $165,500 | $142 | 34 |
| 1350 Barclay | 0.63mi | 3/1.0 (+1) | 1,120 (-12%) | 14mo | $110,000 | $98 | 34 |
| 818 Cavalier Ave | 0.65mi | 2/2.0 | 1,102 (-13%) | 15mo | $135,000 | $123 | 31 |
Match score weights: distance 35% · size 25% · config 20% · recency 20%. Top-matched comps best support the ARV.
Projected returns pro-forma
-2.26% appreciation · 3.0% rent growth · sell at horizon
- IRR
- -22.1%
- Equity multiple
- 0.18×
- Total profit
- $-43,397
- Equity at exit
- $34,434
- IRR
- -16.0%
- Equity multiple
- -0.07×
- Total profit
- $-56,453
- Equity at exit
- $27,288
Cash invested: $52,920 (down + closing). Projections, not guarantees.
Landlord ↔ Tenant lean methodology
- Overall (STATE)
- 87 Strongly Landlord-Friendly
- State Texas
- 87 Strongly Landlord-Friendly · R+5
- County
- — inherits STATE
- City
- — inherits STATE
ZIP-level market 78226
- Home prices YoY
- -0.9%
- Active inventory
- 9
- Price-to-rent
- 11.5×
Monthly cashflow live
- Estimated rent
- $1,371 high interval (Pro) →
- Mortgage (P&I)
- −$991
- Tax from tax record
- −$307 /mo · $3,680/yr
- Insurance
- −$79
- HOA
- −$0
- Vacancy / Maint / Mgmt
- −$288
- Net cashflow
- $-294
Break-even live
Sensitivity live
| Price | -10% $-187 | -5% $-240 | +0% $-294 | +5% $-347 | +10% $-401 |
|---|---|---|---|---|---|
| Rent | -10% $-402 | -5% $-348 | +0% $-294 | +5% $-240 | +10% $-186 |
| Rate | -1.0pp $-199 | -0.5pp $-246 | base $-294 | +0.5pp $-343 | +1.0pp $-393 |
UW: 25.0% down · 7.5% · 30yr · 1.5% tax · 5.0% vac · 8.0% maint · 8.0% mgmt
Financing live
Cash to close
- Down payment
- $47,250
- Closing costs
- $5,670
- Reserves months
- —
- Total cash needed
- —
Loan-product check · same deal, 3 products live
Conventional
25% down · 7.5% · 30yr
- Down + closing
- —
- Monthly P&I
- —
- Monthly cashflow
- —
- DSCR
- —
- Eligible?
- —
Personal DTI + credit; lowest rate.
DSCR
20% down · 8.5% · 30yr
- Down + closing
- —
- Monthly P&I
- —
- Monthly cashflow
- —
- DSCR
- —
- Eligible?
- —
No personal income docs; deal must DSCR.
Hard money
10% down · 12.0% · 12mo
- Down + closing
- —
- Monthly P&I
- —
- Monthly cashflow
- —
- DSCR
- —
- Eligible?
- —
Short-term bridge; refi at stabilization.
Rent comps 14 comps
| Address | Beds | Baths | Sqft | Rent | $/sqft | DOM | Units | Dist |
|---|---|---|---|---|---|---|---|---|
| 3103 Neptune St San Antonio, TX | 3.0 | 2.0 | 1008 | $1,350 | $1.34 | 45d | 1 | 0.33mi |
| 2114 Jupiter St San Antonio, TX | 3.0 | 3.0 | 1233 | $1,457 | $1.18 | 23d | 1 | 0.35mi |
| 463 Linares St San Antonio, TX | 3.0 | 1.0 | 1220 | $1,400 | $1.15 | 25d | 1 | 0.87mi |
| 118 Carthage Ct San Antonio, TX | 3.0 | 2.0 | 1368 | $1,450 | $1.06 | 19d | 1 | 0.88mi |
| 626 Kirk Pl San Antonio, TX | 2.0 | 1.0 | 912 | $1,100 | $1.21 | 21d | 1 | 0.94mi |
| 1135 Ceralvo St San Antonio, TX | 3.0 | 2.0 | 1164 | $1,450 | $1.25 | 23d | 1 | 0.94mi |
| 1135 Ceralvo St San Antonio, TX | 3.0 | 2.0 | 1164 | $1,450 | $1.25 | 6d | 1 | 0.94mi |
| 2003 S Zarzamora St San Antonio, TX | 1.0–4.0 | 1.0–2.0 | 1028 | $1,120 | $1.09 | 25d | 1 | 1.14mi |
| 450 Taft Blvd San Antonio, TX | 3.0 | 1.0 | 883 | $1,295 | $1.47 | 45d | 1 | 1.15mi |
| 1938 S Zarzamora St Unit 710 San Antonio, TX | 2.0 | 2.0 | 955 | $1,094 | $1.15 | 0d | 1 | 1.19mi |
| 1130 Sims Ave San Antonio, TX | 3.0 | 2.0 | 1206 | $1,300 | $1.08 | 25d | 1 | 1.25mi |
| 150 Hearne San Antonio, TX | 2.0 | 1.0 | 1044 | $1,400 | $1.34 | 25d | 1 | 1.35mi |
| 319 Noria St San Antonio, TX | 3.0 | 1.0 | 1002 | $1,100 | $1.10 | 25d | 1 | 1.38mi |
| 542 Drake Ave San Antonio, TX | 3.0 | 2.0 | 1368 | $1,875 | $1.37 | 45d | 1 | 1.40mi |
Listing history 2 events
-
2026-05-31remarks 699-char remark
-
2026-05-31$189,000 Pending 17 DOM
ⓘ Source: listings_history table (triggers on properties + properties_extension) + one-shot
backfill from property_details.listing_events for pre-trigger history.
Tax reassessment forecast TX · Resets to sale price
- Current annual tax
- $3,680 · $307/mo
- Projected year-2 tax
- $3,680 · $307/mo
- Expected delta
- $0/yr ($0/mo · 0.0%)
ⓘ Screening estimate from a state-policy table — verify with the county assessor before closing.
Climate risk First Street
- Flood 1/10 Low FEMA zone X (unshaded) · 0% chance over 30 yrs
- Wildfire 1/10 Low
- Heat 8/10 Severe 7 d/yr ≥108°F today · 22 d/yr by 30 yrs out
- Wind 8/10 Severe 80% chance of damaging wind over 30 yrs
- Air quality 2/10 Low 1 unhealthy d/yr today · 2 by 30 yrs out
Nearby sold comps map
Loading sold comps map…
Walkable amenities ~0.75 mi
Loading nearby amenities…
Taxation est. · year 1
- Rental income
- $16,446
- − Mortgage interest
- −$10,587
- − Property taxes
- −$3,680
- − Insurance
- −$945
- − Repairs & maintenance
- −$1,316
- − Management
- −$1,316
- − Depreciation
- −$5,498
- Taxable loss
- −$6,895
- Est. tax savings @ 24.0%
- +$1,655
- After-tax cash flow
- $-1,871/yr
For passive investors: Depreciation is non-cash, so a rental often shows a tax loss while cash-flowing — sheltering income. Rental losses are passive: they offset passive income freely, and up to $25,000/yr can offset ordinary (W-2) income if you actively participate and your MAGI is under $100k (phasing out to $0 by $150k); unused losses carry forward. On sale, claimed depreciation is recaptured at up to 25%, and gains may owe capital-gains tax (a 1031 exchange can defer both). Figures are a year-1 estimate at your 24.0% rate — not tax advice; consult a CPA.
Schools (NCES district)
- District
- Edgewood ISD
- NCES district ID
- 4818150
- Math proficiency
- 12% ▼ -18.00%
- Reading proficiency
- 21% ▼ -5.00%
- Median HH income
- $27,419
- Composite
- 12.82/100
- National rank
- #9597
- State rank
- #812 of 826 in TX
Livability — San Antonio
- Score
- 80/100
- State rank
- #31
- US rank
- #1616
Category grades
Schools grade is shown separately in the Schools card above.
Census & demographics
- Census place
- San Antonio, TX
- City population
- 1,806,925
- Population (ZIP)
- 6,907
Population outlook (Bexar County) Hauer SSP2
- Today (2025)
- 2,336,851 people
- By 2030
- 2,560,728 · +9.6%
- By 2040
- 3,020,569 · +29.3%
- By 2050
- 3,493,522 · +49.5%
- By 2075
- 4,668,459 · +99.8%
- By 2100
- 5,533,242 · +136.8%
Race, ethnicity, and origin ACS 2023
- Neighborhood character
- Predominantly Hispanic (87%)
- Race & ethnicity
- Hispanic / Latino 87% Two or more races 27% White 8% Black 4% Native American 2%
- Hispanic origin (detail)
- Mexican 73%
- Common ancestry
- Portuguese 1%
- Foreign-born
- 12% · Canada
- Languages at home
- 50% English-only · Spanish 50%
Political lean MEDSL · Bexar
- 2024 margin
- Lean D (+9.8) · D 54.3% · R 44.6% · Other 1.1%
- 2008→2024 swing
- +4.2pp toward D · 2008: 5.6pp · 2024: 9.8pp
- All cycles
- 2024: D+9.8 2020: D+18.2 2016: D+13.5 2012: D+4.6 2008: D+5.6
Not yet ingested
- Civics
- —
Market trends
- HPI YoY
- ▼ -2.26%
- Current HPI
- 244.9905
- Rent YoY
- —
- Metro
- —
- State GDP YoY
- ▲ 3.95%
- F500 in state
- 110
Industry mix (Fortune 500 HQ in TX)
| Industry | F500 HQs | Revenue |
|---|---|---|
| Energy | 16 | $1,198B |
|
||
| Technology | 5 | $198B |
|
||
| Engineering / Construction | 4 | $72B |
|
||
| Energy Services | 3 | $60B |
|
||
| Utilities | 3 | $41B |
|
||
| Healthcare | 2 | $330B |
|
||
Price history
+122.4% since first listed12 events — show timeline
- 2026-05-13 Pending — LERA
- 2026-05-01 Contingent — LERA
- 2026-04-26 Listed $189,000 LERA
- 2019-08-15 Relisted — LERA
- 2019-08-15 Sold (MLS) — LERA
- 2019-08-15 Sold (Public Records) — Public Records
- 2019-07-31 Listing Removed — LERA
- 2019-07-06 Contingent — LERA
- 2019-06-21 Relisted — LERA
- 2019-06-14 Listing Removed — LERA
- 2019-03-15 Listed $85,000 LERA
- 2016-11-18 Sold (Public Records) — Public Records
Property tax history
+4.8%/yrLatest (2025): $3,680 · -11.3% YoY. Source: county tax records.
Cash-flow waterfall
monthlySold comps — $/sqft
last 12 mo · ≤1 miLoading sold comps…