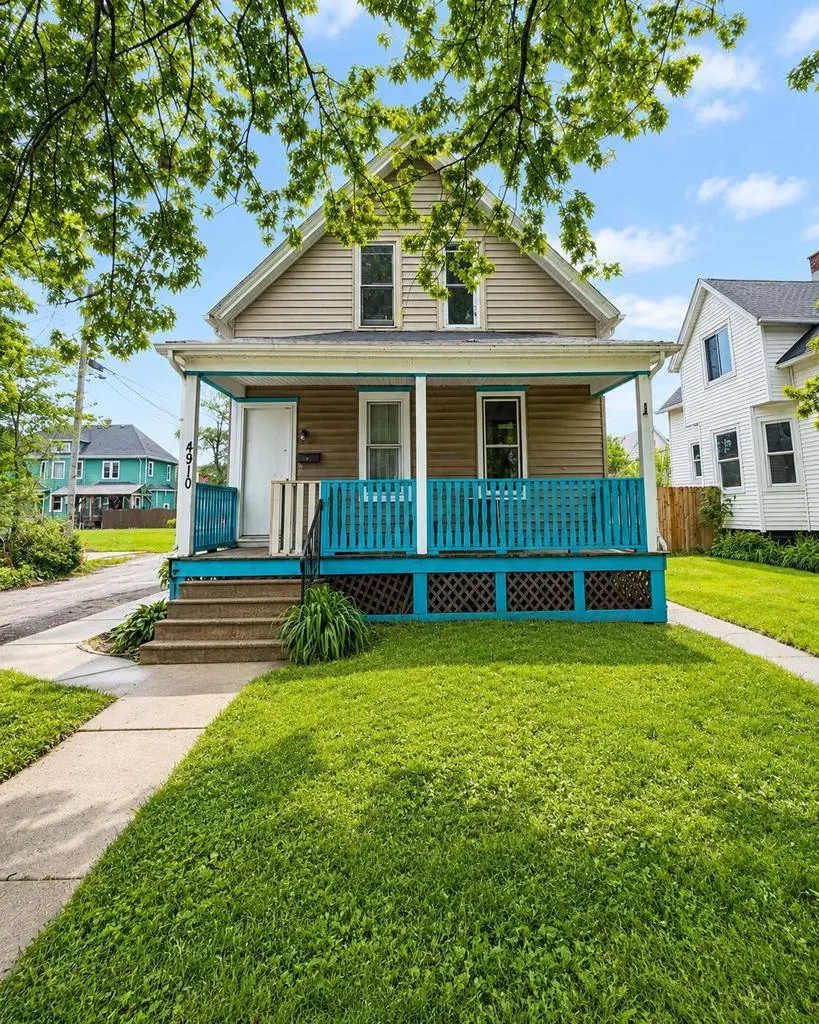
4910 17th Ave · Kenosha, WI
Flood risk 1/10 · Minimal
- FEMA flood zone
- X (unshaded)
- Chance of flooding over 30 yrs
- 0.0%
- Est. flood insurance / yr
- $473 – $860
Fire risk 1/10 · Minimal
- Est. fire insurance / yr
- $636 – $1,182
Heat risk 2/10 · Minimal
- Hot days now (above 96°F)
- 7 days/yr
- Hot days in 30 yrs
- 14 days/yr
Wind risk 2/10 · Minimal
- Chance of severe wind over 30 yrs
- —
Air-quality risk 3/10 · Minor
- Unhealthy air days now
- 2 days/yr
- Unhealthy air days in 30 yrs
- 3 days/yr
Risk factors via First Street. Map © Google.
Why this score? — see what drove the B+ grade
The composite is a weighted blend of 9 inputs, each scored 0–100. Each bar is that input's sub-score; the figure is the points it added to the 100-point composite (weight × sub-score).
- Cash flow +30.0/30.0
- ARV discount +15.0/15.0
- 1% rule +10.0/10.0
- DSCR +10.0/10.0
- Livability +4.2/5.0
- Rent growth +4.0/5.0
- Schools +2.5/10.0
- Condition / age +2.5/5.0
- Appreciation +0.0/10.0
$114,900
🖨 Deal sheet (PDF) 📄 Offer letter ✓ Due diligence
Listing remarks MLS
No More Showings. .. property was withdrawn (rented).
Key facts
- 4,356 sq ft lot
- Parking
- Built 1907
Property features AI
Finance
- Other: Information source for year built: Assessor/Public Record
Exterior
- Parking: 1 parking space
- Utilities: Municipal water; Municipal sewer
- Home design: 1.5‑story single‑family home; Estimated above‑grade living area ~1,527
- Construction: Less than 1/2 acre lot (about 0.1 acre); Zoning: RG2
- Exterior features: Vinyl exterior; Sidewalks
Interior
- Kitchen: Kitchen on main level (10 x 13)
- Bedrooms: Main-level primary bedroom (9 x 13); Main-level bedroom 2 (9 x 9); Upper-level bedroom 3 (10 x 9); Upper-level bedroom 4 (12 x 9)
- Bathrooms: 1 full bathroom
- Heating & cooling: Forced air heating; Natural gas heat
- Interior features: Cable/satellite available; High‑speed internet; Walk‑through bedroom; Full basement
Neighborhood map
What this means for you Summary
Snapshot
- This is a 3-bed/1.0-bath single-family listed at $115k.
Deal economics
- At list price, monthly cash flow is $875 ($10k/yr) — positive.
- The deal already cash-flows at list — no discount required.
- Meets the 1% rule at list price ($2k rent vs $115k).
- Recommended offer: $113k (1.5% below list) — sets the bar for market timing.
- Cap rate 15.4% vs local median 4.0% in Kenosha — top-decile yield for the area; either an underpriced asset or a hidden risk that comps aren't pricing in. Stress-test before assuming the spread holds.
Location & tenants
- Location reads 84/100 on livability (#31 in WI, #680 nationally) — a professional / high-income tenant draw. Strengths: commute A+, cost of living A+, housing A+; Watch: employment C-.
- Kenosha School District (suburban): math 26% / reading 31% proficiency, ranked #287 of 342 in WI (top 84%) — low school quality limits family demand, transient renter base, plan for 1-2y turnover.
- Zoned schools: Grant Elementary (math 17% / reading 12%, grade F, #910 of 1,041 statewide, top 88%, 190 students, 79% FRL); Bradford High (math 11% / reading 21%, grade F, #412 of 483 statewide, top 85%, 1,389 students, 66% FRL) — zoned schools average 73% FRL vs 45% district-wide (28 pts higher); higher-poverty schools than district average — tighter screening recommended.
- Zoned-school proficiency averages 15% at this address vs 28% district-wide (-13 pts) — the specific schools serving this property underperform the Kenosha School District average; the district grade overstates school quality for this exact location.
- Market conditions: Rents rising fast (+6.0%/yr); 43 active listings in the ZIP; 16 comparable units currently listed for rent nearby; rentals at typical pace (median 21d on market — plan ~3-4 weeks tenant-placement turnaround); 259 units permitted in Kenosha County in 2024 (8 in 5+ unit buildings).
- This rent runs 44% of the median local income ($58k/yr) — at the standard rent-burdened threshold; future hikes will face affordability resistance.
Forward outlook
- Local home prices are declining (-3.0%/yr); year-one equity from $794 of loan paydown is wiped out by about $3k of value loss. Plan a longer hold.
- At projected returns (-3.0% appreciation + 6.0% rent growth), your $32k cash investment doubles in ~4 years — after that, you're playing with house money.
Negotiation context
- It's been on market 20 days — a 2% lower offer ($113k) is reasonable based on typical stale-listing flexibility.
- 2 sale attempts since 13y ago; this cycle's ask has dropped $35k (23%) from the opening price — seller is motivated, your offer sets the floor, not the list.
Risks & watch-outs
- Watch-outs: built in 1907 — expect roof / HVAC / electrical / plumbing capex.
Questions for the listing agent
- Built in 1907 — when were the roof, HVAC, electrical panel, plumbing, and water heater last replaced?
- Is there a deadline driving the sale (1031 exchange, divorce, estate, relocation)? That informs how much negotiation room exists.
- Schools are D-rated, which usually means shorter tenancies and higher turnover. Who's the typical renter profile here, and what's been the actual vacancy rate?
- What's the average days-on-market for RENTAL listings here right now (not sales)? A rising rental-DOM trend means longer vacancies and softer asking-rent achievability than the comps imply.
- What's the recent tenant-quality profile in this submarket — average credit score on applications, eviction rate, late-payment / NSF rate, and stable-employment percentage? A property-management company in the area should have these aggregated.
- How much new for-sale + rental construction is in the pipeline within 1–3 miles? Heavy new supply typically softens prices + rents 12–24 months out; constrained supply supports both.
Investment metrics
- 1% rule
- 1.84% ✓
- Cap rate
- 15.43%
- Cash-on-cash
- 32.62%
- DSCR
- 2.45
- GRM
- 4.5
CMA / ARV
- ARV (on-the-fly)
- $229,050
- Comps found
- 12
Show comp detail 12 sales within ~0.75 mi
| Address | Dist | Beds/Ba | Sqft | Sold | Price | $/sf | Match |
|---|---|---|---|---|---|---|---|
| 5012 23rd Ave | 0.36mi | 3/2.0 | 1,450 (-5%) | 1mo | $200,000 | $138 | 70 |
| 5116 20th Ave | 0.24mi | 3/2.5 | 1,441 (-6%) | 6mo | $234,900 | $163 | 68 |
| 1700 43rd St | 0.41mi | 3/2.0 | 1,606 (+5%) | 2mo | $236,000 | $147 | 66 |
| 4310 21st Ave | 0.43mi | 3/2.0 | 1,560 (+2%) | 7mo | $180,000 | $115 | 66 |
| 5110 19th Ave | 0.20mi | 4/2.0 (+1) | 1,666 (+9%) | 3mo | $164,900 | $99 | 64 |
| 5422 22nd Ave | 0.51mi | 3/2.5 | 1,584 (+4%) | 1mo | $312,000 | $197 | 63 |
| 5537 24th Ave | 0.64mi | 3/1.5 | 1,600 (+5%) | 5mo | $240,000 | $150 | 56 |
| 4013 11th Ave | 0.67mi | 3/2.0 | 1,471 (-4%) | 4mo | $214,000 | $145 | 56 |
| 3829 16th Ave | 0.71mi | 2/1.5 (-1) | 1,511 (-1%) | 8mo | $240,000 | $159 | 51 |
| 4215 21st Ave | 0.47mi | 4/1.5 (+1) | 1,679 (+10%) | 8mo | $225,900 | $135 | 48 |
| 1724 39th St | 0.71mi | 3/1.0 | 1,368 (-10%) | 3mo | $265,000 | $194 | 47 |
| 5807 22nd Ave | 0.71mi | 3/2.0 | 1,343 (-12%) | 0mo | $257,000 | $191 | 42 |
Match score weights: distance 35% · size 25% · config 20% · recency 20%. Top-matched comps best support the ARV.
Projected returns pro-forma
-3.0% appreciation · 5.98% rent growth · sell at horizon
- IRR
- 31.1%
- Equity multiple
- 2.36×
- Total profit
- $43,661
- Equity at exit
- $17,132
- IRR
- 39.9%
- Equity multiple
- 5.30×
- Total profit
- $138,426
- Equity at exit
- $9,934
Cash invested: $32,172 (down + closing). Projections, not guarantees.
Landlord ↔ Tenant lean methodology
- Overall (STATE)
- 73 Landlord-Friendly
- State Wisconsin
- 73 Landlord-Friendly · R+2
- County
- — inherits STATE
- City
- — inherits STATE
ZIP-level market 53140
- Rents YoY
- 6.0%
- Active inventory
- 43
- Price-to-rent
- 4.5×
Monthly cashflow live
- Estimated rent
- $2,119 high interval (Pro) →
- Mortgage (P&I)
- −$603
- Tax from tax record
- −$149 /mo · $1,783/yr
- Insurance
- −$48
- HOA
- −$0
- Vacancy / Maint / Mgmt
- −$445
- Net cashflow
- $875
Break-even live
Sensitivity live
| Price | -10% $940 | -5% $907 | +0% $875 | +5% $842 | +10% $810 |
|---|---|---|---|---|---|
| Rent | -10% $707 | -5% $791 | +0% $875 | +5% $958 | +10% $1,042 |
| Rate | -1.0pp $932 | -0.5pp $904 | base $875 | +0.5pp $845 | +1.0pp $815 |
UW: 25.0% down · 7.5% · 30yr · 1.5% tax · 5.0% vac · 8.0% maint · 8.0% mgmt
Financing live
Cash to close
- Down payment
- $28,725
- Closing costs
- $3,447
- Reserves months
- —
- Total cash needed
- —
Loan-product check · same deal, 3 products live
Conventional
25% down · 7.5% · 30yr
- Down + closing
- —
- Monthly P&I
- —
- Monthly cashflow
- —
- DSCR
- —
- Eligible?
- —
Personal DTI + credit; lowest rate.
DSCR
20% down · 8.5% · 30yr
- Down + closing
- —
- Monthly P&I
- —
- Monthly cashflow
- —
- DSCR
- —
- Eligible?
- —
No personal income docs; deal must DSCR.
Hard money
10% down · 12.0% · 12mo
- Down + closing
- —
- Monthly P&I
- —
- Monthly cashflow
- —
- DSCR
- —
- Eligible?
- —
Short-term bridge; refi at stabilization.
Rent comps 16 comps
| Address | Beds | Baths | Sqft | Rent | $/sqft | DOM | Units | Dist |
|---|---|---|---|---|---|---|---|---|
| 5432 23rd Ave Kenosha, WI | 4.0 | 2.0 | 1400 | $1,695 | $1.21 | 4d | 1 | 0.55mi |
| 1510 57th St Unit 2 Kenosha, WI | 4.0 | 2.0 | 1700 | $1,800 | $1.06 | 44d | 1 | 0.55mi |
| 5522 7th Ave Kenosha, WI | 2.0 | 1.0–2.0 | 858 | $2,660 | $3.10 | 3d | 60 | 0.61mi |
| 2708 48th St Kenosha, WI | 4.0 | 2.0 | 1200 | $2,500 | $2.08 | 23d | 1 | 0.65mi |
| 5807 20th Ave Unit 2 Kenosha, WI | 3.0 | 1.0 | 1064 | $2,400 | $2.26 | 19d | 1 | 0.65mi |
| 5807 20th Ave Unit 1 Kenosha, WI | 2.0 | 1.0 | 1064 | $2,000 | $1.88 | 19d | 1 | 0.65mi |
| 1809 60th St Kenosha, WI | 3.0 | 1.0 | 1100 | $1,500 | $1.36 | 44d | 1 | 0.73mi |
| 5945 6th Ave Kenosha, WI | 2.0 | 1.0–2.0 | 800 | $2,575 | $3.22 | 2d | 13 | 0.90mi |
| 5900 4th Ave Unit 309 Kenosha, WI | 2.0 | 2.0 | 1083 | $1,895 | $1.75 | 20d | 1 | 0.91mi |
| 5900 4th Ave Apt 414 Kenosha, WI | 2.0 | 2.0 | 1160 | $2,675 | $2.31 | 13d | 1 | 0.92mi |
| 5900 4th Ave Unit 512 Kenosha, WI | 2.0 | 2.0 | 1224 | $2,495 | $2.04 | 20d | 1 | 0.92mi |
| 5900 4th Ave Unit 509 Kenosha, WI | 2.0 | 2.0 | 1083 | $2,035 | $1.88 | 25d | 1 | 0.92mi |
| 5900 4th Ave Unit 212 Kenosha, WI | 2.0 | 2.0 | 1224 | $1,999 | $1.63 | 44d | 1 | 0.92mi |
| 5900 4th Ave Unit 217 Kenosha, WI | 2.0 | 2.0 | 1083 | $2,195 | $2.03 | 19d | 1 | 0.92mi |
| 2114 36th St Kenosha, WI | 3.0 | 2.0 | 1889 | $3,200 | $1.69 | 44d | 1 | 0.97mi |
| 3905 29th Ave Kenosha, WI | 3.0 | 2.0 | 1550 | $1,600 | $1.03 | 19d | 1 | 1.03mi |
Listing history 13 events
-
2026-06-18days on market $114,900 Active 20 DOM
-
2026-06-17pricedays on market $114,900 Active 19 DOM
-
2026-06-16days on market $149,900 Active 18 DOM
-
2026-06-15days on market $149,900 Active 17 DOM
-
2026-06-13days on market $149,900 Active 15 DOM
-
2026-06-09days on market $149,900 Active 11 DOM
-
2026-06-08days on market $149,900 Active 10 DOM
-
2026-06-07days on market $149,900 Active 9 DOM
-
2026-06-04days on market $149,900 Active 6 DOM
-
2026-06-03days on market $149,900 Active 5 DOM
-
2026-06-02days on market $149,900 Active 4 DOM
-
2026-06-01days on market $149,900 Active 3 DOM
-
2026-05-31days on market $149,900 Active 2 DOM
ⓘ Source: listings_history table (triggers on properties + properties_extension) + one-shot
backfill from property_details.listing_events for pre-trigger history.
Tax reassessment forecast WI · Partial reset (capped growth)
- Current annual tax
- $1,783 · $149/mo
- Projected year-2 tax
- $1,955 · $163/mo
- Expected delta
- +$171/yr (+$14/mo · 9.6%)
ⓘ Screening estimate from a state-policy table — verify with the county assessor before closing.
Climate risk First Street
- Flood 1/10 Low FEMA zone X (unshaded) · 0% chance over 30 yrs
- Wildfire 1/10 Low
- Heat 2/10 Low 7 d/yr ≥96°F today · 14 d/yr by 30 yrs out
- Wind 2/10 Low
- Air quality 3/10 Moderate 2 unhealthy d/yr today · 3 by 30 yrs out
Nearby sold comps map
Loading sold comps map…
Walkable amenities ~0.75 mi
Loading nearby amenities…
Taxation est. · year 1
- Rental income
- $25,422
- − Mortgage interest
- −$6,436
- − Property taxes
- −$1,783
- − Insurance
- −$574
- − Repairs & maintenance
- −$2,034
- − Management
- −$2,034
- − Depreciation
- −$3,343
- Taxable income
- $9,218
- Est. tax owed @ 24.0%
- −$2,212
- After-tax cash flow
- $8,283/yr
For passive investors: Depreciation is non-cash, so a rental often shows a tax loss while cash-flowing — sheltering income. Rental losses are passive: they offset passive income freely, and up to $25,000/yr can offset ordinary (W-2) income if you actively participate and your MAGI is under $100k (phasing out to $0 by $150k); unused losses carry forward. On sale, claimed depreciation is recaptured at up to 25%, and gains may owe capital-gains tax (a 1031 exchange can defer both). Figures are a year-1 estimate at your 24.0% rate — not tax advice; consult a CPA.
Schools (NCES district)
- District
- Kenosha School District
- NCES district ID
- 5507320
- Math proficiency
- 26% ▼ -9.00%
- Reading proficiency
- 31% ▼ -6.00%
- Median HH income
- $52,407
- Composite
- 25.17/100
- National rank
- #7516
- State rank
- #287 of 342 in WI
Livability — Kenosha
- Score
- 84/100
- State rank
- #31
- US rank
- #680
Category grades
Schools grade is shown separately in the Schools card above.
Census & demographics
- Census place
- Kenosha, WI
- County
- Kenosha County · 130,343 people
- City population
- 85,271
- Metro
- Chicago-Naperville-Elgin, IL-IN-WI
- Population (ZIP)
- 30,238
- Household income
- $58,006
- Rent vs Own
- Severe rent burden
- 1576.0
Population outlook (Kenosha County) Hauer SSP2
- Today (2025)
- 174,032 people
- By 2030
- 174,923 · +0.5%
- By 2040
- 173,895 · -0.1%
- By 2050
- 170,102 · -2.3%
- By 2075
- 162,952 · -6.4%
- By 2100
- 154,781 · -11.1%
Race, ethnicity, and origin ACS 2023
- Neighborhood character
- Predominantly White (66%)
- Race & ethnicity
- White 66% Hispanic / Latino 19% Two or more races 14% Black 9% Asian 2%
- Hispanic origin (detail)
- Mexican 14% Puerto Rican 2%
- Common ancestry
- Romanian 7% Lithuanian 3% Portuguese 3%
- Foreign-born
- 10% · Canada
- Languages at home
- 83% English-only · Spanish 12% Other Indo-European 3% Other Asian/Pacific 1%
Political lean MEDSL · Kenosha
- 2024 margin
- Lean R (+6.2) · D 46.2% · R 52.5% · Other 1.3%
- 2008→2024 swing
- -24.3pp toward R · 2008: 18.1pp · 2024: -6.2pp
- All cycles
- 2024: R+6.2 2020: R+3.1 2016: R+0.3 2012: D+12.3 2008: D+18.1
Not yet ingested
- Civics
- —
Market trends
- HPI YoY
- ▼ -187.92%
- Current HPI
- 235.0929
- Rent YoY
- ▲ 5.98%
- Metro
- Chicago-Naperville-Elgin, IL-IN-WI
- State GDP YoY
- ▲ 2.10%
- F500 in state
- 20
Industry mix (Fortune 500 HQ in WI)
| Industry | F500 HQs | Revenue |
|---|---|---|
| Industrial Machinery | 4 | $23B |
|
||
| Industrial Technology | 2 | $36B |
|
||
| Insurance | 1 | $36B |
|
||
| Professional Services | 1 | $19B |
|
||
| Utilities | 1 | $9B |
|
||
| Consumer Goods | 1 | $3B |
|
||
Price history
+168.2% since first listed3 events — show timeline
- 2026-05-27 Listed $149,900 METROMLS
- 2013-02-09 Listing Removed — METROMLS
- 2013-02-09 Listed $55,900 METROMLS
Property tax history
+1.0%/yrLatest (2025): $1,783 · +5.6% YoY. Source: county tax records.
Cash-flow waterfall
monthlySold comps — $/sqft
last 12 mo · ≤1 miLoading sold comps…