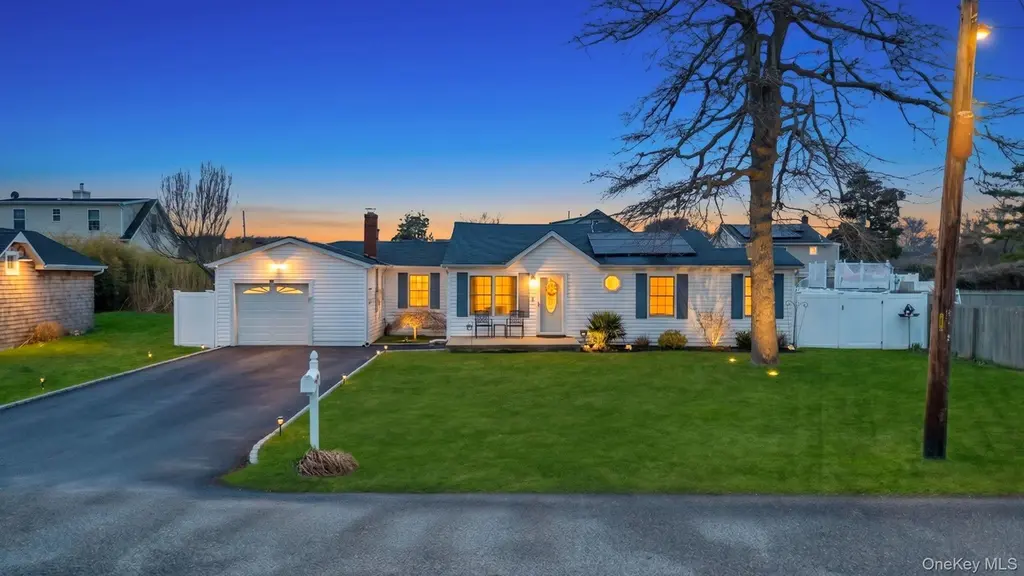
76 Huntington Dr · Mastic Beach, NY
Flood risk 10/10 · Severe
- FEMA flood zone
- AE
- Chance of flooding over 30 yrs
- 0.99%
- Est. flood insurance / yr
- $2,026 – $9,024
Fire risk 1/10 · Minimal
- Est. fire insurance / yr
- $691 – $1,283
Heat risk 4/10 · Minor
- Hot days now (above 92°F)
- 7 days/yr
- Hot days in 30 yrs
- 20 days/yr
Wind risk 8/10 · Major
- Chance of severe wind over 30 yrs
- 80.0%
Air-quality risk 3/10 · Minor
- Unhealthy air days now
- 3 days/yr
- Unhealthy air days in 30 yrs
- 3 days/yr
Risk factors via First Street. Map © Google.
Why this score? — see what drove the D+ grade
The composite is a weighted blend of 9 inputs, each scored 0–100. Each bar is that input's sub-score; the figure is the points it added to the 100-point composite (weight × sub-score).
- Cash flow +12.4/30.0
- Appreciation +10.0/10.0
- ARV discount +6.7/15.0
- Schools +4.7/10.0
- DSCR +3.7/10.0
- Livability +3.1/5.0
- 1% rule +3.0/10.0
- Rent growth +2.5/5.0
- Condition / age +2.5/5.0
$449,999
🖨 Deal sheet (PDF) 📄 Offer letter ✓ Due diligence
Listing remarks MLS
This Is A Fanniemae Homepath Property. Sprawling 4 Bedroom Ranch, 2 Full Baths, Fdr, Lr, Den, Kit, Attached Garage On Slab. Large Level Back With Shed. Short Walk To Great South Bay And Beach.
Key facts
- Custom cabinetry
- Large center island
- Updated kitchen
Tags
Property features AI
Exterior
- Parking: Driveway; 1-car garage; No carport
- Utilities: Electricity connected (PSEG); Water connected; Cesspool sewer
- Home design: Single family residence; One level; Full attic
- Construction: Frame construction; Crawl space basement
- Exterior features: Frame construction; Not waterfront
Interior
- Kitchen: Dishwasher; Microwave; Range; Refrigerator; Eat-in kitchen
- Bedrooms: Includes a first-floor bedroom
- Bathrooms: 2 full bathrooms
- Heating & cooling: Baseboard heating; Central air; Ductless cooling
- Interior features: First-floor bedroom and full bath; Eat-in kitchen; Entrance foyer; Formal dining room; Open floorplan with open kitchen; Primary bathroom; Storage; Washer/dryer hookup
- Laundry & utility: Washer and dryer included (washer, dryer); Washer/dryer hookup
Neighborhood map
What this means for you Summary
Snapshot
- This is a 3-bed/2.0-bath single-family listed at $450k.
Deal economics
- At list price, monthly cash flow is $-534 ($-6k/yr) — negative.
- To cash-flow at today's rent, offer at most $356k (21.0% below list).
- To meet the 1% rule (rent ≥ 1% of price), the offer needs to be $360k (20.1% below list).
- Recommended offer: $356k (21.0% below list) — sets the bar for cash-flow.
- Cap rate 6.1% vs local median 4.7% in Mastic Beach — meaningfully above typical; check what's discounted (condition, days-on-market, listing class) to confirm the premium yield is real.
Location & tenants
- Location reads 61/100 on livability (#936 in NY) — a middle-class / working-renter tenant base. Strengths: employment A+, housing A+; Watch: crime D, amenities F, commute F.
- William Floyd Union Free School District (suburban): math 48% / reading 57% proficiency, ranked #309 of 590 in NY (top 52%) — acceptable for families but not a draw, mixed tenant base, ~2y average lease.
- Zoned schools: John S Hobart Elementary School (math 48% / reading 42%, grade D-, #1,274 of 2,108 statewide, top 61%, 798 students, 58% FRL); William Paca Middle School (math 31% / reading 37%, grade F, #497 of 729 statewide, top 69%, 1,009 students, 59% FRL); William Floyd High School (math 65% / reading 87%, grade A-, #616 of 1,100 statewide, top 57%, 3,013 students, 54% FRL).
- Market conditions: 135 active listings in the ZIP; 3 comparable units currently listed for rent nearby; rentals at typical pace (median 19d on market — plan ~3-4 weeks tenant-placement turnaround); 1,366 units permitted in Suffolk County in 2024 (216 in 5+ unit buildings).
Forward outlook
- In year one you build about $48k of equity ($3k loan paydown + $45k appreciation (10.0% local appreciation)).
- Suffolk County population projected to shrink 5% by 2050 — rents likely to lag national; underwrite the cash flow, not the appreciation.
- By year 2, paydown + projected appreciation supports a ~$77k cash-out refi (75% LTV) — recoverable capital for the next deal without selling this one.
Negotiation context
- It's been on market 25 days — a 2% lower offer ($443k) is reasonable based on typical stale-listing flexibility.
- 6 sale attempts since 12y ago; this cycle's ask has dropped $30k (6%) from the opening price — seller is motivated, your offer sets the floor, not the list.
- Current owner paid $95k; list at $450k implies a 374% gain — meaningful room to come down on a strong offer.
Risks & watch-outs
- Watch-outs: flood insurance adds $460/mo; built in 1936 — expect roof / HVAC / electrical / plumbing capex.
- Climate carrying-cost: in FEMA flood zone AE (mandatory federal flood insurance); severe wind risk, 80% chance of damaging wind over 30y — expect insurance premiums to compound above CPI over the hold.
Questions for the listing agent
- What do current leases actually rent for vs. the listed asking? Can we see a recent rent roll and the last 12 months of T-12 income?
- Built in 1936 — when were the roof, HVAC, electrical panel, plumbing, and water heater last replaced?
- What's the actual annual flood-insurance premium (NFIP or private), and is the property in a SFHA with mandatory coverage?
- Is there a deadline driving the sale (1031 exchange, divorce, estate, relocation)? That informs how much negotiation room exists.
- Schools are D-rated, which usually means shorter tenancies and higher turnover. Who's the typical renter profile here, and what's been the actual vacancy rate?
- Crime grade is D in this area — have there been break-ins, vandalism, or insurance claims at this property in the last 3 years? What carrier currently insures it and at what premium?
- The area grade is low — what's the realistic commute time and amenity access for the typical tenant pool here? Any planned neighborhood developments (good or bad) we should know about?
- What's the average days-on-market for RENTAL listings here right now (not sales)? A rising rental-DOM trend means longer vacancies and softer asking-rent achievability than the comps imply.
- What's the recent tenant-quality profile in this submarket — average credit score on applications, eviction rate, late-payment / NSF rate, and stable-employment percentage? A property-management company in the area should have these aggregated.
- How much new for-sale + rental construction is in the pipeline within 1–3 miles? Heavy new supply typically softens prices + rents 12–24 months out; constrained supply supports both.
Investment metrics
- 1% rule
- 0.80% ✗
- Cap rate
- 6.10%
- Cash-on-cash
- -0.70%
- DSCR
- 0.97
- GRM
- 10.4
CMA / ARV
- ARV (median comp)
- $442,315
- List price
- $449,999
- Delta
- 1.74%
- Verdict
- FAIR
- Comps
- 20 within 1.0 mi
Show comp detail 12 sales within ~0.75 mi
| Address | Dist | Beds/Ba | Sqft | Sold | Price | $/sf | Match |
|---|---|---|---|---|---|---|---|
| 17 Bellport Rd | 0.14mi | 3/1.0 | 1,224 (+2%) | 4mo | $465,000 | $380 | 82 |
| 8 Astoria Rd | 0.15mi | 3/1.0 | 1,116 (-7%) | 5mo | $434,600 | $389 | 73 |
| 31 Stanley Dr | 0.41mi | 3/1.0 | 1,092 (-9%) | 1mo | $460,000 | $421 | 61 |
| 77 Diana Dr | 0.42mi | 3/1.0 | 1,100 (-8%) | 4mo | $400,000 | $364 | 59 |
| 62 Moriches Dr | 0.38mi | 2/1.0 (-1) | 1,095 (-9%) | 1mo | $360,000 | $329 | 58 |
| 231 Elm Rd W | 0.60mi | 3/1.0 | 1,100 (-8%) | 2mo | $477,000 | $434 | 53 |
| 20 Bogota Rd | 0.55mi | 3/1.0 | 1,088 (-9%) | 3mo | $460,000 | $423 | 52 |
| 184 Bayview Dr | 0.63mi | 3/2.0 | 1,302 (+9%) | 5mo | $280,000 | $215 | 52 |
| 2 Lafayette Dr | 0.55mi | 3/1.5 | 1,334 (+11%) | 2mo | $400,000 | $300 | 51 |
| 344 Elm Rd W | 0.52mi | 4/1.0 (+1) | 1,092 (-9%) | 1mo | $415,000 | $380 | 51 |
| 193 Laurelton Dr | 0.51mi | 3/2.0 | 1,349 (+13%) | 5mo | $465,000 | $345 | 51 |
| 40 Fairview Dr | 0.50mi | 3/1.0 | 1,050 (-12%) | 2mo | $400,000 | $381 | 50 |
Match score weights: distance 35% · size 25% · config 20% · recency 20%. Top-matched comps best support the ARV.
Projected returns pro-forma
10.0% appreciation · 3.0% rent growth · sell at horizon
- IRR
- 20.7%
- Equity multiple
- 2.68×
- Total profit
- $211,290
- Equity at exit
- $405,395
- IRR
- 18.8%
- Equity multiple
- 6.15×
- Total profit
- $649,392
- Equity at exit
- $874,249
Cash invested: $126,000 (down + closing). Projections, not guarantees.
Landlord ↔ Tenant lean methodology
- Overall (STATE)
- 15 Strongly Tenant-Friendly
- State New York
- 15 Strongly Tenant-Friendly · D+10
- County
- — inherits STATE
- City
- — inherits STATE
ZIP-level market 11951
- Home prices YoY
- 4.3%
- Active inventory
- 135
- Price-to-rent
- 10.4×
Monthly cashflow live
- Estimated rent
- $3,598 medium interval (Pro) →
- Mortgage (P&I)
- −$2,360
- Tax from tax record
- −$368 /mo · $4,420/yr
- Insurance
- −$187
- Flood insurance flood zone
- −$460 /mo · $5,525/yr
- HOA
- −$0
- Vacancy / Maint / Mgmt
- −$755
- Net cashflow
- $-534
Break-even live
Sensitivity live
| Price | -10% $-279 | -5% $-407 | +0% $-534 | +5% $-661 | +10% $-789 |
|---|---|---|---|---|---|
| Rent | -10% $-818 | -5% $-676 | +0% $-534 | +5% $-392 | +10% $-250 |
| Rate | -1.0pp $-307 | -0.5pp $-420 | base $-534 | +0.5pp $-651 | +1.0pp $-769 |
UW: 25.0% down · 7.5% · 30yr · 1.5% tax · 5.0% vac · 8.0% maint · 8.0% mgmt
Financing live
Cash to close
- Down payment
- $112,500
- Closing costs
- $13,500
- Reserves months
- —
- Total cash needed
- —
Loan-product check · same deal, 3 products live
Conventional
25% down · 7.5% · 30yr
- Down + closing
- —
- Monthly P&I
- —
- Monthly cashflow
- —
- DSCR
- —
- Eligible?
- —
Personal DTI + credit; lowest rate.
DSCR
20% down · 8.5% · 30yr
- Down + closing
- —
- Monthly P&I
- —
- Monthly cashflow
- —
- DSCR
- —
- Eligible?
- —
No personal income docs; deal must DSCR.
Hard money
10% down · 12.0% · 12mo
- Down + closing
- —
- Monthly P&I
- —
- Monthly cashflow
- —
- DSCR
- —
- Eligible?
- —
Short-term bridge; refi at stabilization.
Rent comps 3 comps
| Address | Beds | Baths | Sqft | Rent | $/sqft | DOM | Units | Dist |
|---|---|---|---|---|---|---|---|---|
| 12 Hackensack Rd Mastic Beach, NY | 3.0 | 1.0 | 792 | $3,150 | $3.98 | 18d | 1 | 0.54mi |
| 6 Fairview Dr Shirley, NY | 4.0 | 2.0 | 1302 | $4,299 | $3.30 | 4d | 1 | 0.62mi |
| 67 Saint George Dr Shirley, NY | 2.0 | 1.0 | 714 | $2,750 | $3.85 | 46d | 1 | 1.00mi |
Listing history 16 events
-
2026-05-11price $449,999 1346-char remark
-
2026-04-24$479,999 Active 1346-char remark
-
2015-03-24historical 192-char remark
Show marketing remark (191 chars)
This Is A Fanniemae Homepath Property.Sprawling 4 Bedroom Ranch, 2 Full Baths, Fdr, Lr, Den, Kit, Attached Garage On Slab. Large Level Back With Shed. Short Walk To Great South Bay And Beach.
-
2015-03-24soldstatus $95,000 Closed 192-char remark
Show marketing remark (191 chars)
This Is A Fanniemae Homepath Property.Sprawling 4 Bedroom Ranch, 2 Full Baths, Fdr, Lr, Den, Kit, Attached Garage On Slab. Large Level Back With Shed. Short Walk To Great South Bay And Beach.
-
2015-03-24soldstatus $95,000
Show marketing remark (191 chars)
This Is A Fanniemae Homepath Property.Sprawling 4 Bedroom Ranch, 2 Full Baths, Fdr, Lr, Den, Kit, Attached Garage On Slab. Large Level Back With Shed. Short Walk To Great South Bay And Beach.
-
2015-03-16status Under Contract 192-char remark
Show marketing remark (192 chars)
This Is A Fanniemae Homepath Property. Sprawling 4 Bedroom Ranch, 2 Full Baths, Fdr, Lr, Den, Kit, Attached Garage On Slab. Large Level Back With Shed. Short Walk To Great South Bay And Beach.
-
2015-03-02status Back On Market 192-char remark
Show marketing remark (192 chars)
This Is A Fanniemae Homepath Property. Sprawling 4 Bedroom Ranch, 2 Full Baths, Fdr, Lr, Den, Kit, Attached Garage On Slab. Large Level Back With Shed. Short Walk To Great South Bay And Beach.
-
2014-10-29status Under Contract 192-char remark
Show marketing remark (192 chars)
This Is A Fanniemae Homepath Property. Sprawling 4 Bedroom Ranch, 2 Full Baths, Fdr, Lr, Den, Kit, Attached Garage On Slab. Large Level Back With Shed. Short Walk To Great South Bay And Beach.
-
2014-09-19status Back On Market 192-char remark
Show marketing remark (192 chars)
This Is A Fanniemae Homepath Property. Sprawling 4 Bedroom Ranch, 2 Full Baths, Fdr, Lr, Den, Kit, Attached Garage On Slab. Large Level Back With Shed. Short Walk To Great South Bay And Beach.
-
2014-09-03status Under Contract 192-char remark
Show marketing remark (192 chars)
This Is A Fanniemae Homepath Property. Sprawling 4 Bedroom Ranch, 2 Full Baths, Fdr, Lr, Den, Kit, Attached Garage On Slab. Large Level Back With Shed. Short Walk To Great South Bay And Beach.
-
2014-08-14$94,900 New 192-char remark
Show marketing remark (191 chars)
This Is A Fanniemae Homepath Property.Sprawling 4 Bedroom Ranch, 2 Full Baths, Fdr, Lr, Den, Kit, Attached Garage On Slab. Large Level Back With Shed. Short Walk To Great South Bay And Beach.
-
2014-08-14$94,900
Show marketing remark (191 chars)
This Is A Fanniemae Homepath Property.Sprawling 4 Bedroom Ranch, 2 Full Baths, Fdr, Lr, Den, Kit, Attached Garage On Slab. Large Level Back With Shed. Short Walk To Great South Bay And Beach.
-
2014-05-27historical
-
2014-02-09$69,900
-
2005-07-08soldstatus $173,000
-
1987-05-28soldstatus $35,000
ⓘ Source: listings_history table (triggers on properties + properties_extension) + one-shot
backfill from property_details.listing_events for pre-trigger history.
Tax reassessment forecast NY · Partial reset (capped growth)
- Current annual tax
- $4,420 · $368/mo
- Projected year-2 tax
- $6,012 · $501/mo
- Expected delta
- +$1,593/yr (+$133/mo · 36.0%)
ⓘ Screening estimate from a state-policy table — verify with the county assessor before closing.
Climate risk First Street
- Flood 10/10 Extreme FEMA zone AE · 99% chance over 30 yrs
- Wildfire 1/10 Low
- Heat 4/10 Moderate 7 d/yr ≥92°F today · 20 d/yr by 30 yrs out
- Wind 8/10 Severe 80% chance of damaging wind over 30 yrs
- Air quality 3/10 Moderate 3 unhealthy d/yr today · 3 by 30 yrs out
Nearby sold comps map
Loading sold comps map…
Walkable amenities ~0.75 mi
Loading nearby amenities…
Taxation est. · year 1
- Rental income
- $43,171
- − Mortgage interest
- −$25,207
- − Property taxes
- −$4,420
- − Insurance
- −$7,775
- − Repairs & maintenance
- −$3,454
- − Management
- −$3,454
- − Depreciation
- −$13,091
- Taxable loss
- −$14,229
- Est. tax savings @ 24.0%
- +$3,415
- After-tax cash flow
- $-2,993/yr
For passive investors: Depreciation is non-cash, so a rental often shows a tax loss while cash-flowing — sheltering income. Rental losses are passive: they offset passive income freely, and up to $25,000/yr can offset ordinary (W-2) income if you actively participate and your MAGI is under $100k (phasing out to $0 by $150k); unused losses carry forward. On sale, claimed depreciation is recaptured at up to 25%, and gains may owe capital-gains tax (a 1031 exchange can defer both). Figures are a year-1 estimate at your 24.0% rate — not tax advice; consult a CPA.
Schools (NCES district)
- District
- William Floyd Union Free School District
- NCES district ID
- 3618690
- Math proficiency
- 48% ▲ 3.00%
- Reading proficiency
- 57% ▲ 11.00%
- Median HH income
- $70,564
- Composite
- 46.79/100
- National rank
- #2383
- State rank
- #309 of 590 in NY
Livability — Mastic Beach
- Score
- 61/100
- State rank
- #936
- US rank
- #18216
Category grades
Schools grade is shown separately in the Schools card above.
Census & demographics
- Census place
- Mastic Beach, NY
- City population
- 15,830
- Population (ZIP)
- 15,830
Population outlook (Suffolk County) Hauer SSP2
- Today (2025)
- 1,505,262 people
- By 2030
- 1,498,318 · -0.5%
- By 2040
- 1,471,101 · -2.3%
- By 2050
- 1,424,848 · -5.3%
- By 2075
- 1,337,157 · -11.2%
- By 2100
- 1,217,720 · -19.1%
Race, ethnicity, and origin ACS 2023
- Neighborhood character
- Predominantly White (68%)
- Race & ethnicity
- White 68% Hispanic / Latino 17% Two or more races 9% Black 6% Asian 2%
- Hispanic origin (detail)
- Mexican 1% Puerto Rican 6% Cuban 2%
- Common ancestry
- Lithuanian 3% Romanian 2% Italian 2%
- Foreign-born
- 7% · Canada, Vietnam
- Languages at home
- 84% English-only · Spanish 10% Other Indo-European 3% Chinese 1%
Political lean MEDSL · Suffolk
- 2024 margin
- Lean R (+10.0) · D 45.0% · R 55.0%
- 2008→2024 swing
- -16.0pp toward R · 2008: 6.0pp · 2024: -10.0pp
- All cycles
- 2024: R+10.0 2020: R+0.0 2016: R+8.2 2012: D+2.9 2008: D+6.0
Not yet ingested
- Civics
- —
Market trends
- HPI YoY
- ▲ 34.46%
- Current HPI
- 829.86
- Rent YoY
- —
- Metro
- —
- State GDP YoY
- ▲ 2.60%
- F500 in state
- 92
Industry mix (Fortune 500 HQ in NY)
| Industry | F500 HQs | Revenue |
|---|---|---|
| Financial Services | 10 | $950B |
|
||
| Consumer Goods | 9 | $162B |
|
||
| Insurance | 4 | $225B |
|
||
| Telecommunications | 2 | $144B |
|
||
| Pharmaceuticals | 2 | $112B |
|
||
| Media / Entertainment | 2 | $69B |
|
||
Price history
+1185.7% since first listed17 events — show timeline
- 2026-05-19 Pending — OneKey® MLS as Distributed by MLS Grid
- 2026-05-11 Price Changed $449,999 OneKey® MLS as Distributed by MLS Grid
- 2026-04-24 Listed $479,999 OneKey® MLS as Distributed by MLS Grid
- 2015-03-24 Delisted — MLSLI
- 2015-03-24 Sold (MLS) $95,000 OneKey® MLS as Distributed by MLS Grid
- 2015-03-24 Sold (MLS) $95,000 MLSLI
- 2015-03-16 Pending — MLSLI
- 2015-03-02 Relisted — MLSLI
- 2014-10-29 Pending — MLSLI
- 2014-09-19 Relisted — MLSLI
- 2014-09-03 Pending — MLSLI
- 2014-08-14 Listed $94,900 MLSLI
- 2014-08-14 Listed $94,900 OneKey® MLS as Distributed by MLS Grid
- 2014-05-27 Listing Removed — OneKey® MLS as Distributed by MLS Grid
- 2014-02-09 Listed $69,900 OneKey® MLS as Distributed by MLS Grid
- 2005-07-08 Sold (Public Records) $173,000 Public Records
- 1987-05-28 Sold (Public Records) $35,000 Public Records
Property tax history
+5.4%/yrLatest (2025): $4,420 · +0.0% YoY. Source: county tax records.
Cash-flow waterfall
monthlySold comps — $/sqft
last 12 mo · ≤1 miLoading sold comps…