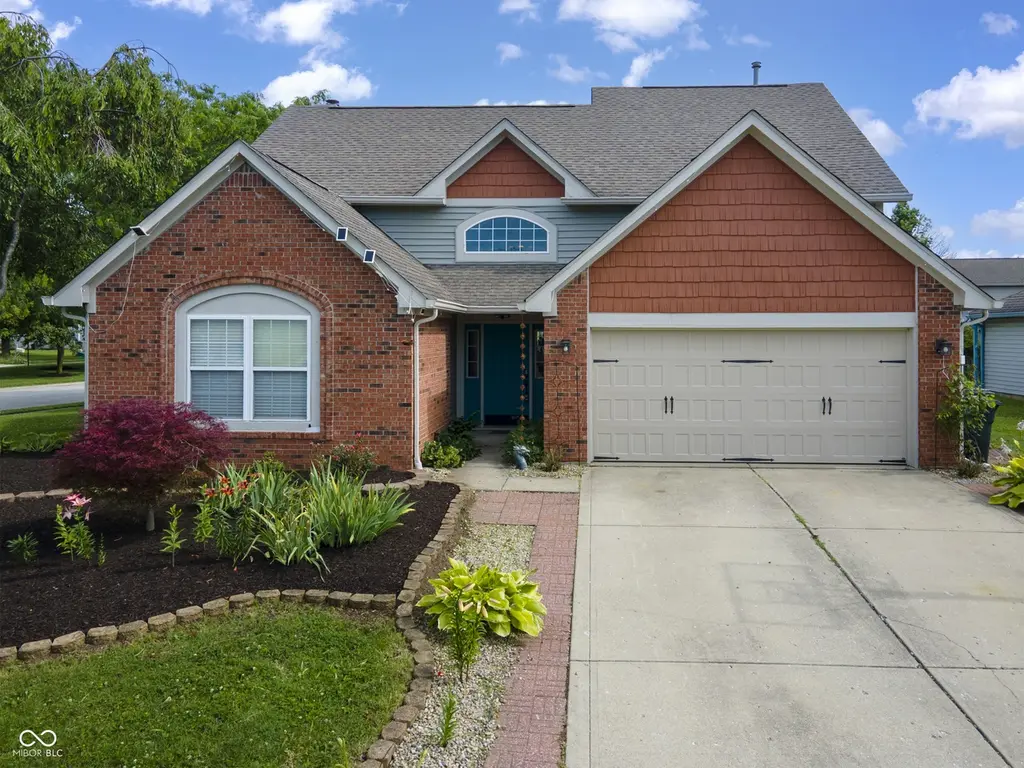
706 Woodcote Ln · Brownsburg, IN
Flood risk 1/10 · Minimal
- FEMA flood zone
- X (unshaded)
- Chance of flooding over 30 yrs
- 0.0%
- Est. flood insurance / yr
- $507 – $1,088
Fire risk 1/10 · Minimal
- Est. fire insurance / yr
- $717 – $1,331
Heat risk 3/10 · Minor
- Hot days now (above 100°F)
- 7 days/yr
- Hot days in 30 yrs
- 19 days/yr
Wind risk 2/10 · Minimal
- Chance of severe wind over 30 yrs
- 1.0%
Air-quality risk 3/10 · Minor
- Unhealthy air days now
- 2 days/yr
- Unhealthy air days in 30 yrs
- 3 days/yr
Risk factors via First Street. Map © Google.
Why this score? — see what drove the D+ grade
The composite is a weighted blend of 9 inputs, each scored 0–100. Each bar is that input's sub-score; the figure is the points it added to the 100-point composite (weight × sub-score).
- ARV discount +15.0/15.0
- Cash flow +10.7/30.0
- Schools +6.3/10.0
- Rent growth +4.1/5.0
- Livability +3.8/5.0
- DSCR +3.1/10.0
- 1% rule +2.7/10.0
- Condition / age +2.5/5.0
- Appreciation +0.0/10.0
$309,900
🖨 Deal sheet (PDF) 📄 Offer letter ✓ Due diligence
Listing remarks MLS
Conveniently located on B'burg's North side! Convenient to shopping/restrnts and I-74. When you step into this home, you will love the floor plan. 2 level entry with winding open staircase that overlooks the 2 story Great Room. Main Lvl Master with Whirlpool tub/sep shower/ dbl sinks, and 2 closets. Upstairs is heaven with 2 great sized bdrm's and BONUS ROOM for extra entertaining space. Large corner lot and landscaping that wraps around the home. Great Value, make an appt. today!
Key facts
- Firepit
- Raised garden beds
- Pergola
Tags
Property features AI
Finance
- Other: Property is residential single family within Whittington Estates
- HOA & community: HOA present with annual fee; Annual association fee $220; HOA covers insurance, maintenance, and snow removal; Covenants and restrictions
Exterior
- Parking: Attached 2-car garage (approximately 462 sq ft)
- Security: Smoke alarm
- Utilities: Public water; Municipal sewer connected; No solid waste service listed
- Home design: Single family residence in a planned unit development; Two levels
- Construction: Brick and vinyl siding exterior; Slab foundation
- Exterior features: Covered patio; Patio; Mature trees; Sidewalks; Rural subdivision setting
Interior
- Kitchen: Electric oven; Microwave; Dishwasher; Pantry
- Bedrooms: Primary bedroom with walk-in closet; Three bedrooms total (one on the main level, two on the upper level)
- Bathrooms: Two full bathrooms; One half bathroom; Primary bath with whirlpool tub, double sinks, and full shower stall
- Heating & cooling: Forced air heating (natural gas); Central air conditioning
- Interior features: Breakfast bar; Cathedral ceilings; Pantry; Walk-in closets; Gas log fireplace in the great room (one fireplace)
- Laundry & utility: Main level laundry; Water softener (owned); Gas water heater
Neighborhood map
What this means for you Summary
Snapshot
- This is a 3-bed/2.5-bath single-family listed at $310k.
Deal economics
- At list price, monthly cash flow is $-149 ($-2k/yr) — negative.
- To cash-flow at today's rent, offer at most $284k (8.5% below list).
- To meet the 1% rule (rent ≥ 1% of price), the offer needs to be $238k (23.4% below list).
- Recommended offer: $238k (23.4% below list) — sets the bar for 1% rule.
- Cap rate 5.7% vs local median 3.8% in Brownsburg — top-decile yield for the area; either an underpriced asset or a hidden risk that comps aren't pricing in. Stress-test before assuming the spread holds.
Location & tenants
- Location reads 75/100 on livability (#61 in IN, #4,105 nationally) — a middle-class / working-renter tenant base. Strengths: crime A+, employment A+, cost of living A+; Watch: amenities F, commute F, health & safety F.
- Brownsburg Community School Corporation (suburban): math 72% / reading 72% proficiency, ranked #2 of 301 in IN (top 1%) — strong family-tenant draw, lease renewals of 3-5y typical; only 17% free/reduced lunch — higher-income household profile.
- Zoned schools: Brownsburg High School (math 61% / reading 83%, grade B+, #12 of 369 statewide, top 4%, 3,177 students, 33% FRL) — zoned schools average 33% FRL vs 17% district-wide (16 pts higher); higher-poverty schools than district average — tighter screening recommended.
- Market conditions: Rents rising fast (+6.3%/yr); 340 active listings in the ZIP; 5 comparable units currently listed for rent nearby; rentals at typical pace (median 17d on market — plan ~3-4 weeks tenant-placement turnaround); high-income renter base; 1,294 units permitted in Hendricks County in 2024 (18 in 5+ unit buildings).
Forward outlook
- Local home prices are declining (-3.0%/yr); year-one equity from $2k of loan paydown is wiped out by about $9k of value loss. Plan a longer hold.
- Hendricks County population projected at +35% by 2050 — long-run rental-demand tailwind backs the buy-and-hold thesis.
Negotiation context
- Only 3 days on market — expect competitive offers; lowballing is unlikely to land.
- 4 sale attempts since 22y ago with the ask held roughly flat each time — persistent listings suggest the price (not the market) is what's stuck; bring a comps-based counter.
- Current owner paid $144k; list at $310k implies a 115% gain — meaningful room to come down on a strong offer.
Questions for the listing agent
- What do current leases actually rent for vs. the listed asking? Can we see a recent rent roll and the last 12 months of T-12 income?
- What does the HOA fee cover, when was the last increase, and are there any pending special assessments or reserve-fund shortfalls?
- Is there a deadline driving the sale (1031 exchange, divorce, estate, relocation)? That informs how much negotiation room exists.
- Schools are A-rated — typically a magnet for longer-tenancy family renters. What's the average tenant stay here, and is there a school-zone premium baked into asking?
- The area grade is low — what's the realistic commute time and amenity access for the typical tenant pool here? Any planned neighborhood developments (good or bad) we should know about?
- What's the average days-on-market for RENTAL listings here right now (not sales)? A rising rental-DOM trend means longer vacancies and softer asking-rent achievability than the comps imply.
- What's the recent tenant-quality profile in this submarket — average credit score on applications, eviction rate, late-payment / NSF rate, and stable-employment percentage? A property-management company in the area should have these aggregated.
- How much new for-sale + rental construction is in the pipeline within 1–3 miles? Heavy new supply typically softens prices + rents 12–24 months out; constrained supply supports both.
Investment metrics
- 1% rule
- 0.77% ✗
- Cap rate
- 5.72%
- Cash-on-cash
- -2.06%
- DSCR
- 0.91
- GRM
- 10.9
CMA / ARV
- ARV (on-the-fly)
- $372,564
- Comps found
- 12
Show comp detail 12 sales within ~0.75 mi
| Address | Dist | Beds/Ba | Sqft | Sold | Price | $/sf | Match |
|---|---|---|---|---|---|---|---|
| 752 Summersby Ln | 0.10mi | 4/2.5 (+1) | 2,316 (-2%) | 2mo | $270,000 | $117 | 86 |
| 1450 Auburn Dr | 0.04mi | 4/2.5 (+1) | 2,206 (-6%) | 3mo | $375,000 | $170 | 80 |
| 57 Carriage Lake Dr | 0.30mi | 3/2.5 | 2,247 (-5%) | 2mo | $370,000 | $165 | 77 |
| 6937 Weil Dr | 0.24mi | 3/2.0 | 2,180 (-8%) | 1mo | $378,000 | $173 | 73 |
| 703 Rose Ln | 0.23mi | 3/2.5 | 2,142 (-9%) | 3mo | $320,000 | $149 | 72 |
| 745 Woodcote Ln | 0.08mi | 4/2.5 (+1) | 2,060 (-13%) | 3mo | $325,000 | $158 | 68 |
| 1284 Summer Ridge Ln | 0.48mi | 4/2.5 (+1) | 2,282 (-3%) | 2mo | $340,000 | $149 | 66 |
| 6585 Crown Dr | 0.45mi | 4/3.5 (+1) | 2,431 (+3%) | 1mo | $420,000 | $173 | 64 |
| 7166 Rhapsody Way | 0.53mi | 4/2.5 (+1) | 2,402 (+2%) | 5mo | $420,000 | $175 | 63 |
| 1280 Summer Ridge Ln | 0.49mi | 4/2.5 (+1) | 2,424 (+3%) | 6mo | $330,000 | $136 | 63 |
| 760 Rose Ln | 0.23mi | 4/2.5 (+1) | 2,007 (-15%) | 5mo | $300,000 | $149 | 56 |
| 1113 River Ridge Dr | 0.60mi | 4/2.5 (+1) | 2,499 (+6%) | 7mo | $330,000 | $132 | 51 |
Match score weights: distance 35% · size 25% · config 20% · recency 20%. Top-matched comps best support the ARV.
Projected returns pro-forma
-3.0% appreciation · 6.31% rent growth · sell at horizon
- IRR
- -16.3%
- Equity multiple
- 0.41×
- Total profit
- $-51,583
- Equity at exit
- $46,207
- IRR
- -3.2%
- Equity multiple
- 0.75×
- Total profit
- $-21,398
- Equity at exit
- $26,794
Cash invested: $86,772 (down + closing). Projections, not guarantees.
Landlord ↔ Tenant lean methodology
- Overall (STATE)
- 90 Strongly Landlord-Friendly
- State Indiana
- 90 Strongly Landlord-Friendly · R+11
- County
- — inherits STATE
- City
- — inherits STATE
ZIP-level market 46112
- Rents YoY
- 6.3%
- Active inventory
- 340
- Price-to-rent
- 10.9×
Monthly cashflow live
- Estimated rent
- $2,375 high interval (Pro) →
- Mortgage (P&I)
- −$1,625
- Tax from tax record
- −$254 /mo · $3,042/yr
- Insurance
- −$129
- HOA
- −$18
- Vacancy / Maint / Mgmt
- −$499
- Net cashflow
- $-149
Break-even live
Sensitivity live
| Price | -10% $26 | -5% $-62 | +0% $-149 | +5% $-237 | +10% $-325 |
|---|---|---|---|---|---|
| Rent | -10% $-337 | -5% $-243 | +0% $-149 | +5% $-55 | +10% $38 |
| Rate | -1.0pp $7 | -0.5pp $-70 | base $-149 | +0.5pp $-230 | +1.0pp $-311 |
UW: 25.0% down · 7.5% · 30yr · 1.5% tax · 5.0% vac · 8.0% maint · 8.0% mgmt
Financing live
Cash to close
- Down payment
- $77,475
- Closing costs
- $9,297
- Reserves months
- —
- Total cash needed
- —
Loan-product check · same deal, 3 products live
Conventional
25% down · 7.5% · 30yr
- Down + closing
- —
- Monthly P&I
- —
- Monthly cashflow
- —
- DSCR
- —
- Eligible?
- —
Personal DTI + credit; lowest rate.
DSCR
20% down · 8.5% · 30yr
- Down + closing
- —
- Monthly P&I
- —
- Monthly cashflow
- —
- DSCR
- —
- Eligible?
- —
No personal income docs; deal must DSCR.
Hard money
10% down · 12.0% · 12mo
- Down + closing
- —
- Monthly P&I
- —
- Monthly cashflow
- —
- DSCR
- —
- Eligible?
- —
Short-term bridge; refi at stabilization.
Rent comps 5 comps
| Address | Beds | Baths | Sqft | Rent | $/sqft | DOM | Units | Dist |
|---|---|---|---|---|---|---|---|---|
| 1573 Winding Creek Trl Brownsburg, IN | 4.0 | 2.5 | 1836 | $2,211 | $1.20 | 16d | 1 | 0.46mi |
| 263 Brooks Bnd Brownsburg, IN | 4.0 | 3.0 | 1920 | $2,250 | $1.17 | 4d | 1 | 0.65mi |
| 7249 Arbuckle Cmns Brownsburg, IN | 1.0–2.0 | 1.0–2.5 | 1548 | $2,545 | $1.64 | 0d | 19 | 1.31mi |
| 443 N Odell St Brownsburg, IN | 4.0 | 2.5 | 1984 | $2,391 | $1.21 | 23d | 1 | 1.35mi |
| 275 Lazy Hollow Dr Brownsburg, IN | 4.0 | 2.5 | 2190 | $2,571 | $1.17 | 45d | 1 | 1.43mi |
HOA detail
- Monthly dues
- $18 · $216/yr
- Likely covers
- landscapingpool
Listing history 3 events
-
2026-06-21days on market $309,900 Active 3 DOM
-
2026-06-18remarks 462-char remark
-
2026-06-18$309,900 Active 1 DOM
ⓘ Source: listings_history table (triggers on properties + properties_extension) + one-shot
backfill from property_details.listing_events for pre-trigger history.
Tax reassessment forecast IN · Partial reset (capped growth)
- Current annual tax
- $3,042 · $254/mo
- Projected year-2 tax
- $3,042 · $254/mo
- Expected delta
- $0/yr ($0/mo · 0.0%)
ⓘ Screening estimate from a state-policy table — verify with the county assessor before closing.
Climate risk First Street
- Flood 1/10 Low FEMA zone X (unshaded) · 0% chance over 30 yrs
- Wildfire 1/10 Low
- Heat 3/10 Moderate 7 d/yr ≥100°F today · 19 d/yr by 30 yrs out
- Wind 2/10 Low 100% chance of damaging wind over 30 yrs
- Air quality 3/10 Moderate 2 unhealthy d/yr today · 3 by 30 yrs out
Nearby sold comps map
Loading sold comps map…
Walkable amenities ~0.75 mi
Loading nearby amenities…
Taxation est. · year 1
- Rental income
- $28,505
- − Mortgage interest
- −$17,359
- − Property taxes
- −$3,042
- − Insurance
- −$1,550
- − Repairs & maintenance
- −$2,280
- − Management
- −$2,280
- − HOA
- −$216
- − Depreciation
- −$9,015
- Taxable loss
- −$7,238
- Est. tax savings @ 24.0%
- +$1,737
- After-tax cash flow
- $-54/yr
For passive investors: Depreciation is non-cash, so a rental often shows a tax loss while cash-flowing — sheltering income. Rental losses are passive: they offset passive income freely, and up to $25,000/yr can offset ordinary (W-2) income if you actively participate and your MAGI is under $100k (phasing out to $0 by $150k); unused losses carry forward. On sale, claimed depreciation is recaptured at up to 25%, and gains may owe capital-gains tax (a 1031 exchange can defer both). Figures are a year-1 estimate at your 24.0% rate — not tax advice; consult a CPA.
Schools (NCES district)
- District
- Brownsburg Community School Corporation
- NCES district ID
- 1801020
- Math proficiency
- 72% ▼ -5.00%
- Reading proficiency
- 72% ▼ -4.00%
- Median HH income
- $75,304
- Composite
- 63.45/100
- National rank
- #616
- State rank
- #2 of 301 in IN
Livability — Brownsburg
- Score
- 75/100
- State rank
- #61
- US rank
- #4105
Category grades
Schools grade is shown separately in the Schools card above.
Census & demographics
- Census place
- Brownsburg, IN
- County
- Hendricks County · 143,373 people
- City population
- 44,220
- Metro
- Indianapolis-Carmel-Anderson, IN
- Population (ZIP)
- 44,220
- Household income
- $112,565
- Rent vs Own
- Severe rent burden
- 614.0
Population outlook (Hendricks County) Hauer SSP2
- Today (2025)
- 187,418 people
- By 2030
- 201,494 · +7.5%
- By 2040
- 228,487 · +21.9%
- By 2050
- 253,068 · +35.0%
- By 2075
- 308,920 · +64.8%
- By 2100
- 336,510 · +79.6%
Race, ethnicity, and origin ACS 2023
- Neighborhood character
- Predominantly White (83%)
- Race & ethnicity
- White 83% Black 10% Two or more races 4% Hispanic / Latino 4%
- Common ancestry
- Slovak 3% Iranian 2% Romanian 2%
- Foreign-born
- 6% · Canada, China
- Languages at home
- 93% English-only · Spanish 2% French/Haitian/Cajun 1%
Political lean MEDSL · Hendricks
- 2024 margin
- Strong R (+21.5) · D 38.4% · R 59.9% · Other 1.7%
- 2008→2024 swing
- +1.9pp toward D · 2008: -23.4pp · 2024: -21.5pp
- All cycles
- 2024: R+21.5 2020: R+23.9 2016: R+34.2 2012: R+34.9 2008: R+23.4
Not yet ingested
- Civics
- —
Market trends
- HPI YoY
- ▼ -135.99%
- Current HPI
- 217.3787
- Rent YoY
- ▲ 6.31%
- Metro
- Indianapolis-Carmel-Anderson, IN
- State GDP YoY
- ▲ 2.90%
- F500 in state
- 18
Industry mix (Fortune 500 HQ in IN)
| Industry | F500 HQs | Revenue |
|---|---|---|
| Industrial Machinery | 2 | $37B |
|
||
| Healthcare | 1 | $177B |
|
||
| Pharmaceuticals | 1 | $45B |
|
||
| Metals / Steel | 1 | $18B |
|
||
| Agriculture | 1 | $17B |
|
||
| Packaging | 1 | $12B |
|
||
Price history
+93.8% since first listed8 events — show timeline
- 2026-06-18 Listed $309,900 MIBOR as Distributed by MLS Grid
- 2014-12-29 Sold (MLS) $144,000 MIBOR as Distributed by MLS Grid
- 2014-12-12 Contingent — MIBOR as Distributed by MLS Grid
- 2014-10-22 Listed $150,000 MIBOR as Distributed by MLS Grid
- 2005-10-04 Sold (MLS) $147,000 MIBOR as Distributed by MLS Grid
- 2005-05-20 Listed $155,000 MIBOR as Distributed by MLS Grid
- 2005-05-16 Listing Removed — MIBOR as Distributed by MLS Grid
- 2004-11-22 Listed $159,900 MIBOR as Distributed by MLS Grid
Property tax history
+6.9%/yrLatest (2025): $3,042 · +6.6% YoY. Source: county tax records.
Cash-flow waterfall
monthlySold comps — $/sqft
last 12 mo · ≤1 miLoading sold comps…