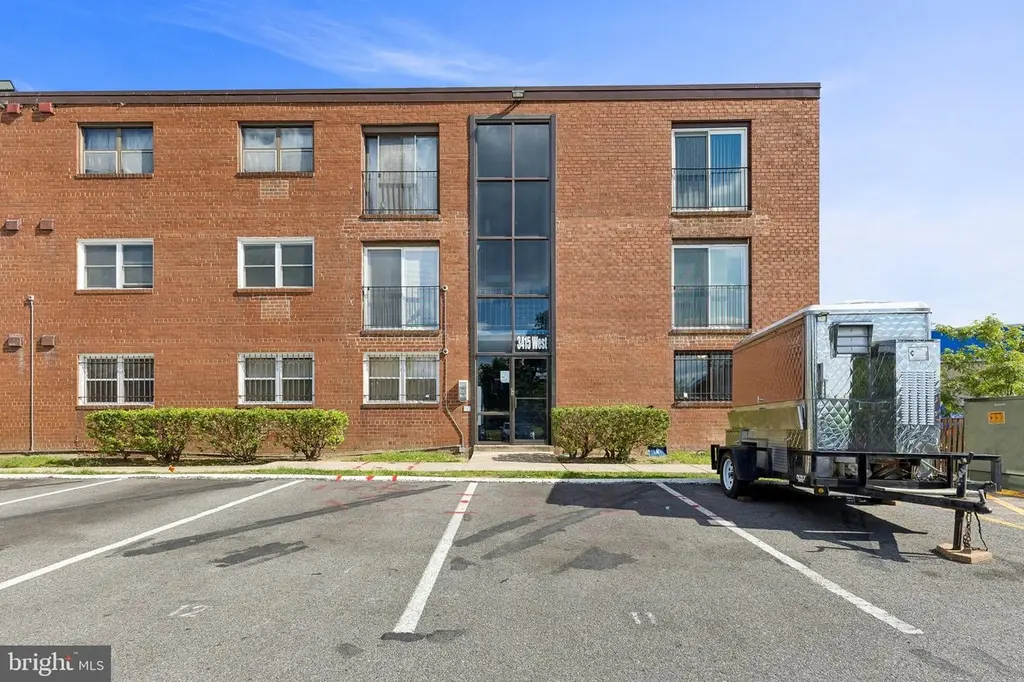
3415 5th St SE Unit 26 (WEST BLDG) · Washington, DC
Flood risk 1/10 · Minimal
- FEMA flood zone
- X (unshaded)
- Chance of flooding over 30 yrs
- 0.0%
- Est. flood insurance / yr
- $507 – $1,088
Fire risk 1/10 · Minimal
- Est. fire insurance / yr
- $631 – $1,173
Heat risk 8/10 · Major
- Hot days now (above 104°F)
- 7 days/yr
- Hot days in 30 yrs
- 16 days/yr
Wind risk 4/10 · Minor
- Chance of severe wind over 30 yrs
- 20.0%
Air-quality risk 3/10 · Minor
- Unhealthy air days now
- 2 days/yr
- Unhealthy air days in 30 yrs
- 3 days/yr
Risk factors via First Street. Map © Google.
Why this score? — see what drove the D grade
The composite is a weighted blend of 9 inputs, each scored 0–100. Each bar is that input's sub-score; the figure is the points it added to the 100-point composite (weight × sub-score).
- Cash flow +12.0/30.0
- ARV discount +7.5/15.0
- 1% rule +6.2/10.0
- Livability +3.7/5.0
- Schools +3.6/10.0
- DSCR +3.5/10.0
- Rent growth +3.5/5.0
- Condition / age +2.5/5.0
- Appreciation +0.0/10.0
$148,000
🖨 Deal sheet 📄 Offer letter ✓ Due diligence
Listing remarks
Welcome to this beautifully renovated 2-bedroom, 1-bath condominium located in the East Gate Condominiums community of Congress Heights. Situated in the West Building, Unit 26 at 3415 5th Street SE offers a fresh, modern feel with thoughtful updates throughout. Step inside to discover brand-new flooring, fresh paint, and a bright, inviting layout designed for comfortable living. The updated kitchen features new stove 4-burner element electric range, refreshed finishes and ample cabinet space, while the renovated bathroom offers clean, contemporary touches. Each bedroom is well-sized, providing flexibility for everyday living, guests, or a home office. Ideally positioned for convenience, thi
Key facts
- $323 HOA
- Parking
- Built 1964
Property features AI
Finance
- Other: Unit building type: Garden 1–4 floors; Finished above-grade area per assessor
- Financial info:
- HOA & community: Condo fee $323 monthly
Exterior
- Parking: Asphalt driveway; Off-street parking with 1 space (total 1 garage/parking space)
- Security:
- Utilities: Public water; Public sewer; Electric power
- Home design: Garden-style building (1–4 floors); Unit/flat in East Gate Condominiums; Entry floor number 2; Fee simple ownership; Effective year of major renovation: 2025
- Construction: Brick construction; Above-grade and below-grade structures
- Exterior features: Tidal water: No; Pets allowed with size/weight restrictions
Interior
- Kitchen:
- Bedrooms: 2 bedrooms on the main level
- Flooring:
- Bathrooms: 1 full bathroom on the main level
- Heating & cooling: Heat pump(s) heating; Central air conditioning; Electric heating and cooling; Electric hot water
- Interior features: No basement; Living area per assessor
- Laundry & utility: Washer/dryer hook up in unit
Neighborhood map
What this means for you Summary
Snapshot
- This is a 2-bed/1.0-bath condo listed at $148k.
Deal economics
- At list price, monthly cash flow is $-36 ($-429/yr) — negative.
- To cash-flow at today's rent, offer at most $143k (3.5% below list).
- Meets the 1% rule at list price ($2k rent vs $148k).
- Recommended offer: $143k (3.5% below list) — sets the bar for cash-flow.
- Cap rate 6.0% vs local median 2.5% in Washington — top-decile yield for the area; either an underpriced asset or a hidden risk that comps aren't pricing in. Stress-test before assuming the spread holds.
Location & tenants
- Location reads 73/100 on livability (#1 in DC) — a middle-class / working-renter tenant base. Strengths: amenities A+, commute A+, employment A+; Watch: crime F, cost of living F.
- District Of Columbia Public Schools (urban): math 33% / reading 40% proficiency, ranked #8 of 32 in DC (top 25%) — families likely to look elsewhere, expect single-tenant / working-renter base with shorter leases; 65% free/reduced lunch — lower-income household profile, screen leases tightly.
- Market conditions: Rents rising (+4.0%/yr); 145 active listings in the ZIP; 40 comparable units currently listed for rent nearby; rentals at typical pace (median 25d on market — plan ~3-4 weeks tenant-placement turnaround); 1,737 units permitted in District of Columbia in 2024 (1,506 in 5+ unit buildings).
- This rent runs 40% of the median local income ($49k/yr) — at the standard rent-burdened threshold; future hikes will face affordability resistance.
Forward outlook
- Local home prices are declining (-3.0%/yr); year-one equity from $1k of loan paydown is wiped out by about $4k of value loss. Plan a longer hold.
- District of Columbia County population projected at +50% by 2050 — long-run rental-demand tailwind backs the buy-and-hold thesis.
Negotiation context
- It's been on market 41 days — a 3% lower offer ($144k) is reasonable based on typical stale-listing flexibility.
- Current owner paid $40k; list at $148k implies a 270% gain — meaningful room to come down on a strong offer.
Risks & watch-outs
- Climate carrying-cost: extreme-heat days projected 7→16/yr by 2055 (HVAC capex compounding) — expect insurance premiums to compound above CPI over the hold.
Questions for the listing agent
- What do current leases actually rent for vs. the listed asking? Can we see a recent rent roll and the last 12 months of T-12 income?
- It's been on market 41 days. Have you received any prior offers? Is the seller open to a 3% concession, seller financing, or rate buy-down credit?
- Built in 1964 — when were the roof, HVAC, electrical panel, plumbing, and water heater last replaced?
- What does the HOA fee cover, when was the last increase, and are there any pending special assessments or reserve-fund shortfalls?
- Any open or pending special assessments — roof, HVAC, plumbing, elevator, façade? What's the per-unit balance and payoff schedule, and is the seller paying it off at close or rolling it to the buyer?
- Is there a deadline driving the sale (1031 exchange, divorce, estate, relocation)? That informs how much negotiation room exists.
- Crime grade is F in this area — have there been break-ins, vandalism, or insurance claims at this property in the last 3 years? What carrier currently insures it and at what premium?
- The area grade is low — what's the realistic commute time and amenity access for the typical tenant pool here? Any planned neighborhood developments (good or bad) we should know about?
- What's the average days-on-market for RENTAL listings here right now (not sales)? A rising rental-DOM trend means longer vacancies and softer asking-rent achievability than the comps imply.
- What's the recent tenant-quality profile in this submarket — average credit score on applications, eviction rate, late-payment / NSF rate, and stable-employment percentage? A property-management company in the area should have these aggregated.
- How much new apartment / multifamily construction is in the pipeline within 1–3 miles? Heavy new supply (>2% of stock underway) typically softens rents 12–24 months out; light construction supports rent growth.
Investment metrics
- 1% rule
- 1.12% ✓
- Cap rate
- 6.00%
- Cash-on-cash
- -1.03%
- DSCR
- 0.95
- GRM
- 7.4
CMA / ARV
No comps found within radius.
Projected returns pro-forma
-3.0% appreciation · 3.96% rent growth · sell at horizon
- IRR
- -16.4%
- Equity multiple
- 0.41×
- Total profit
- $-24,416
- Equity at exit
- $22,067
- IRR
- -5.8%
- Equity multiple
- 0.60×
- Total profit
- $-16,516
- Equity at exit
- $12,796
Cash invested: $41,440 (down + closing). Projections, not guarantees.
Landlord ↔ Tenant lean methodology
- Overall (CITY)
- 0 Strongly Tenant-Friendly
- State District of Columbia
- 12 Strongly Tenant-Friendly · D+43
- County
- — inherits STATE
- City Washington
- 0 Strongly Tenant-Friendly · D+43
ZIP-level market 20032
- Home prices YoY
- -15.6%
- Rents YoY
- 4.0%
- Active inventory
- 145
- Price-to-rent
- 7.4×
Monthly cashflow live
- Estimated rent
- $1,658 high interval (Pro) →
- Mortgage (P&I)
- −$776
- Tax est. 1.5%
- −$185 /mo · $2,220/yr
- Insurance
- −$62
- HOA
- −$323
- Vacancy / Maint / Mgmt
- −$348
- Net cashflow
- $-36
Break-even live
UW: 25.0% down · 7.5% · 30yr · 1.5% tax · 5.0% vac · 8.0% maint · 8.0% mgmt
Financing live
Cash to close
- Down payment
- $37,000
- Closing costs
- $4,440
- Reserves months
- —
- Total cash needed
- —
Loan-product check · same deal, 3 products live
Conventional
25% down · 7.5% · 30yr
- Down + closing
- —
- Monthly P&I
- —
- Monthly cashflow
- —
- DSCR
- —
- Eligible?
- —
Personal DTI + credit; lowest rate.
DSCR
20% down · 8.5% · 30yr
- Down + closing
- —
- Monthly P&I
- —
- Monthly cashflow
- —
- DSCR
- —
- Eligible?
- —
No personal income docs; deal must DSCR.
Hard money
10% down · 12.0% · 12mo
- Down + closing
- —
- Monthly P&I
- —
- Monthly cashflow
- —
- DSCR
- —
- Eligible?
- —
Short-term bridge; refi at stabilization.
Rent comps 40 comps
| Address | Beds | Baths | Sqft | Rent | $/sqft | DOM | Units | Dist |
|---|---|---|---|---|---|---|---|---|
| 3429 5th St SE #42 Washington, DC | 1.0 | 1.0 | 702 | $1,395 | $1.99 | 14d | 1 | 0.03mi |
| 3320 6th St SE Washington, DC | 2.0 | 1.0 | 690 | $1,398 | $2.03 | 3d | 25 | 0.16mi |
| 207 Mississippi Ave SE Washington, DC | 1.0–2.0 | 1.0–1.5 | 656 | $1,559 | $2.38 | 24d | 10 | 0.30mi |
| 3517 Brothers Pl SE Washington, DC | 2.0 | 1.0 | 900 | $1,595 | $1.77 | 24d | 1 | 0.33mi |
| 327 Parkland Pl SE Washington, DC | 1.0 | 1.0 | 650 | $1,199 | $1.84 | 24d | 1 | 0.38mi |
| 101 Wayne Pl SE Washington, DC | 2.0 | 1.0 | 919 | $1,695 | $1.84 | 22d | 1 | 0.39mi |
| 3210 8th St SE #1 Washington, DC | 2.0 | 2.0 | 1106 | $2,395 | $2.17 | 24d | 1 | 0.39mi |
| 3730 Martin Luther King Jr Ave SE Washington, DC | 2.0 | 1.0 | 475 | $1,295 | $2.73 | 1d | 2 | 0.41mi |
| 747 Alabama Ave SE Washington, DC | 1.0 | 1.0 | 800 | $1,599 | $2.00 | 24d | 1 | 0.43mi |
| 10 Halley Pl SE Washington, DC | 2.0–3.0 | 1.0 | 906 | $1,250 | $1.38 | 24d | 3 | 0.43mi |
| 562 Malcolm X Ave SE Unit 4 Washington, DC | 2.0 | 1.0 | 550 | $1,600 | $2.91 | 12d | 1 | 0.44mi |
| 615 Malcolm X Ave SE Unit F Washington, DC | 3.0 | 1.0 | 1100 | $2,508 | $2.28 | 3d | 1 | 0.44mi |
| 447 Orange St SE #3 Washington, DC | 2.0 | 1.0 | 700 | $1,500 | $2.14 | 4d | 1 | 0.49mi |
| 535 Mellon St SE Washington, DC | 1.0 | 1.0 | 700 | $1,350 | $1.93 | 24d | 1 | 0.50mi |
| 535 Mellon St SE Unit 5 Washington, DC | 1.0 | 1.0 | 700 | $1,350 | $1.93 | 20d | 1 | 0.50mi |
| 3929 4th St SE Unit 4 Washington, DC | 2.0 | 1.0 | 852 | $1,557 | $1.83 | 24d | 1 | 0.50mi |
| 3320 11th Pl SE Washington, DC | 1.0 | 1.0 | 750 | $1,198 | $1.60 | 24d | 1 | 0.52mi |
| 2913 8th St SE #3101 Washington, DC | 2.0 | 2.0 | 1100 | $2,400 | $2.18 | 14d | 1 | 0.53mi |
| 1120 Trenton Pl SE Washington, DC | 1.0–2.0 | 1.0 | 715 | $1,325 | $1.85 | 10d | 3 | 0.54mi |
| 310 Atlantic St SE Unit 102B Washington, DC | 2.0 | 1.0 | 859 | $1,875 | $2.18 | 5d | 1 | 0.54mi |
| 310 Atlantic St SE Washington, DC | 1.0–2.0 | 1.0 | 754 | $1,875 | $2.49 | 4d | 2 | 0.54mi |
| 306 Atlantic St SE Unit 7 Washington, DC | 2.0 | 1.0 | 800 | $1,700 | $2.12 | 24d | 1 | 0.54mi |
| 306 Atlantic St SE Unit 7 Washington, DC | 2.0 | 1.0 | 989 | $1,699 | $1.72 | 18d | 1 | 0.54mi |
| 3207 11th Pl SE #4 Washington, DC | 3.0 | 1.0 | 850 | $1,800 | $2.12 | 24d | 1 | 0.55mi |
| 3207 11th Pl SE #4 Washington, DC | 3.0 | 1.0 | 850 | $1,800 | $2.12 | 18d | 1 | 0.55mi |
| 39 Mississippi Ave SE Washington, DC | 2.0 | 1.0 | 800 | $1,300 | $1.62 | 24d | 1 | 0.56mi |
| 425 Oakwood St SE Unit 425 Washington, DC | 3.0 | 2.5 | 1008 | $3,500 | $3.47 | 24d | 1 | 0.56mi |
| 3865 Halley Ter SE Washington, DC | 1.0 | 1.0 | 650 | $1,210 | $1.86 | 24d | 1 | 0.58mi |
| 2942 2nd St SE Washington, DC | 1.0–2.0 | 1.0–2.0 | 762 | $1,539 | $2.02 | 3d | 9 | 0.60mi |
| 446 Mellon St SE #2 Washington, DC | 2.0 | 1.0 | 928 | $2,400 | $2.59 | 15d | 1 | 0.60mi |
| 3930 1st St SE Unit 301 Washington, DC | 3.0 | 1.0 | 900 | $2,200 | $2.44 | 24d | 1 | 0.60mi |
| 3868 9th St SE Washington, DC | 2.0 | 1.0 | 740 | $1,450 | $1.96 | 24d | 1 | 0.62mi |
| 3323 13th St SE Apt 11 Washington, DC | 2.0 | 1.0 | 755 | $1,750 | $2.32 | 24d | 1 | 0.63mi |
| 430 Mellon St SE Unit 2 Washington, DC | 1.0 | 1.0 | 650 | $1,200 | $1.85 | 24d | 1 | 0.63mi |
| 3321 13th St SE Unit 3 Washington, DC | 2.0 | 1.0 | 703 | $1,750 | $2.49 | 24d | 1 | 0.64mi |
| 3325 13th St SE Apt 12 Washington, DC | 3.0 | 1.0 | 901 | $2,500 | $2.77 | 24d | 1 | 0.64mi |
| 3325 13th St SE Unit 10 Washington, DC | 2.0 | 1.0 | 750 | $1,750 | $2.33 | 24d | 1 | 0.64mi |
| 3325 13th St SE Apt 1 Washington, DC | 3.0 | 1.0 | 902 | $2,500 | $2.77 | 2d | 1 | 0.64mi |
| 215 Oakwood St SE Unit 302 Washington, DC | 1.0 | 1.0 | 700 | $1,080 | $1.54 | 24d | 1 | 0.65mi |
| 852 Barnaby St SE Washington, DC | 2.0–3.0 | 1.0–1.5 | 761 | $1,400 | $1.84 | 15d | 10 | 0.66mi |
HOA detail condo
- Monthly dues
- $323 · $3,876/yr
- Likely covers
- electric
- Assessments
- None detected in remarks — confirm with the listing agent.
Listing history 16 events
-
2026-06-18days on market $148,000 Active 41 DOM
-
2026-06-17days on market $148,000 Active 40 DOM
-
2026-06-16days on market $148,000 Active 39 DOM
-
2026-06-15days on market $148,000 Active 38 DOM
-
2026-06-13days on market $148,000 Active 36 DOM
-
2026-06-09days on market $148,000 Active 32 DOM
-
2026-06-08days on market $148,000 Active 31 DOM
-
2026-06-07days on market $148,000 Active 30 DOM
-
2026-06-04days on market $148,000 Active 27 DOM
-
2026-06-03days on market $148,000 Active 26 DOM
-
2026-06-02days on market $148,000 Active 25 DOM
-
2026-06-01days on market $148,000 Active 24 DOM
-
2026-05-31days on market $148,000 Active 23 DOM
-
2026-05-09$148,000 Active
-
2026-04-25historical $148,000
-
1981-09-28soldstatus $39,990
ⓘ Source: listings_history table (triggers on properties + properties_extension) + one-shot
backfill from property_details.listing_events for pre-trigger history.
Climate risk First Street
- Flood 1/10 Low FEMA zone X (unshaded) · 0% chance over 30 yrs
- Wildfire 1/10 Low
- Heat 8/10 Severe 7 d/yr ≥104°F today · 16 d/yr by 30 yrs out
- Wind 4/10 Moderate 20% chance of damaging wind over 30 yrs
- Air quality 3/10 Moderate 2 unhealthy d/yr today · 3 by 30 yrs out
Nearby sold comps map
Loading sold comps map…
Walkable amenities ~0.75 mi
Loading nearby amenities…
Taxation est. · year 1
- Rental income
- $19,900
- − Mortgage interest
- −$8,290
- − Property taxes
- −$2,220
- − Insurance
- −$740
- − Repairs & maintenance
- −$1,592
- − Management
- −$1,592
- − HOA
- −$3,876
- − Depreciation
- −$4,305
- Taxable loss
- −$2,716
- Est. tax savings @ 24.0%
- +$652
- After-tax cash flow
- $223/yr
For passive investors: Depreciation is non-cash, so a rental often shows a tax loss while cash-flowing — sheltering income. Rental losses are passive: they offset passive income freely, and up to $25,000/yr can offset ordinary (W-2) income if you actively participate and your MAGI is under $100k (phasing out to $0 by $150k); unused losses carry forward. On sale, claimed depreciation is recaptured at up to 25%, and gains may owe capital-gains tax (a 1031 exchange can defer both). Figures are a year-1 estimate at your 24.0% rate — not tax advice; consult a CPA.
Schools (NCES district)
- District
- District Of Columbia Public Schools
- NCES district ID
- 1100030
- Math proficiency
- 33% ▲ 3.00%
- Reading proficiency
- 40% ▲ 5.00%
- Median HH income
- $67,671
- Composite
- 35.84/100
- National rank
- #9606
- State rank
- #8 of 32 in DC
Livability — Washington
- Score
- 73/100
- State rank
- #1
- US rank
- #5327
Category grades
Schools grade is shown separately in the Schools card above.
Census & demographics
- Census place
- Washington, DC
- County
- District of Columbia · 671,873 people
- City population
- 671,873
- Metro
- Washington-Arlington-Alexandria, DC-VA-MD-WV
- Population (ZIP)
- 40,920
- Household income
- $49,139
- Rent vs Own
- Severe rent burden
- 4530.0
Population outlook (District of Columbia County) Hauer SSP2
- Today (2025)
- 821,926 people
- By 2030
- 899,517 · +9.4%
- By 2040
- 1,061,162 · +29.1%
- By 2050
- 1,231,493 · +49.8%
- By 2075
- 1,603,312 · +95.1%
- By 2100
- 1,847,141 · +124.7%
Race, ethnicity, and origin ACS 2023
- Neighborhood character
- Predominantly Black (80%)
- Race & ethnicity
- Black 80% White 8% Two or more races 7% Hispanic / Latino 5%
- Foreign-born
- 4% · Canada
- Languages at home
- 95% English-only · Spanish 3%
Political lean MEDSL · District of Columbia
- 2024 margin
- Solid D (+86.1) · D 91.2% · R 5.1% · Other 3.8%
- 2008→2024 swing
- +0.1pp no change · 2008: 85.9pp · 2024: 86.1pp
- All cycles
- 2024: D+86.1 2020: D+86.8 2016: D+88.7 2012: D+84.2 2008: D+85.9
Not yet ingested
- Civics
- —
Market trends
- HPI YoY
- ▼ -60.34%
- Current HPI
- 326.4077
- Rent YoY
- ▲ 3.96%
- Metro
- Washington-Arlington-Alexandria, DC-VA-MD-WV
- State GDP YoY
- ▲ 1.33%
- F500 in state
- 6
Industry mix (Fortune 500 HQ in DC)
| Industry | F500 HQs | Revenue |
|---|---|---|
| Financial Services | 1 | $153B |
|
||
| Life Sciences / Industrials | 1 | $25B |
|
||
| Industrial Machinery | 1 | $8B |
|
||
Price history
+270.1% since first listed3 events — show timeline
- 2026-05-09 Listed $148,000 BRIGHT MLS
- 2026-04-25 Coming Soon $148,000 BRIGHT MLS
- 1981-09-28 Sold (Public Records) $39,990 Public Records
Property tax history
-9.0%/yrLatest (2025): $112 · -67.8% YoY. Source: county tax records.
Cash-flow waterfall
monthlySold comps — $/sqft
last 12 mo · ≤1 miLoading sold comps…