 🏗️ New Construction
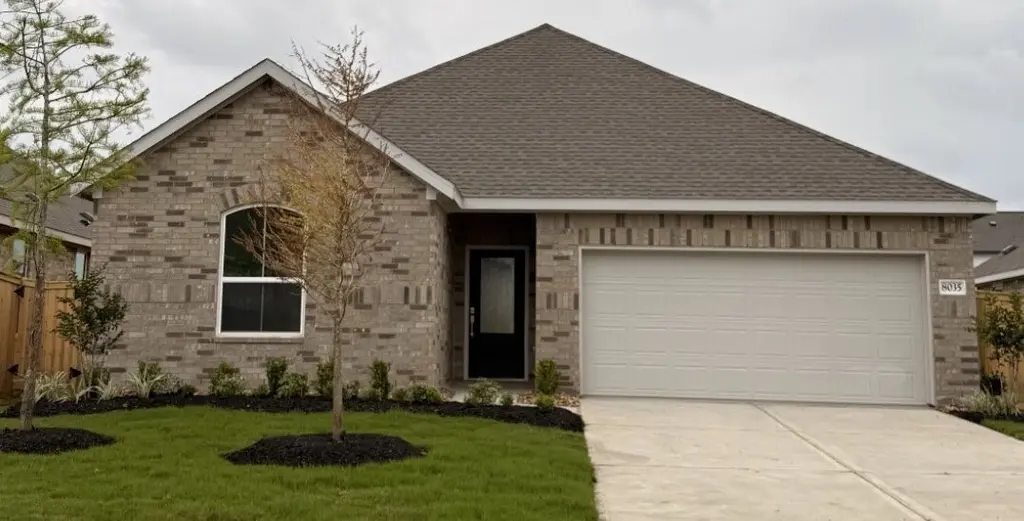
8035 Topaz Ridge Dr · Angleton, TX
Flood risk 4/10 · Minor
- FEMA flood zone
- X (shaded)
- Chance of flooding over 30 yrs
- 0.21%
- Est. flood insurance / yr
- $507 – $1,088
Fire risk 4/10 · Minor
- Est. fire insurance / yr
- $1,222 – $2,270
Heat risk 10/10 · Severe
- Hot days now (above 109°F)
- 7 days/yr
- Hot days in 30 yrs
- 25 days/yr
Wind risk 9/10 · Severe
- Chance of severe wind over 30 yrs
- 99.0%
Air-quality risk 2/10 · Minimal
- Unhealthy air days now
- 1 days/yr
- Unhealthy air days in 30 yrs
- 1 days/yr
Risk factors via First Street. Map © Google.
Why this score? — see what drove the F grade
The composite is a weighted blend of 9 inputs, each scored 0–100. Each bar is that input's sub-score; the figure is the points it added to the 100-point composite (weight × sub-score).
- ARV discount +7.5/15.0
- Cash flow +5.1/30.0
- Condition / age +4.0/5.0
- Livability +3.7/5.0
- Schools +3.5/10.0
- Rent growth +2.5/5.0
- 1% rule +1.2/10.0
- DSCR +0.0/10.0
- Appreciation +0.0/10.0
$212,990
🖨 Deal sheet (PDF) 📄 Offer letter ✓ Due diligence
Listing remarks
New Construction Lennar Houston Home - The Frey Floor Plan - This single-story home shares an open layout between the kitchen, nook and family room for easy entertaining, along with access to the covered patio for year-round outdoor lounging. A luxe owner's suite is in a rear of the home and comes complete with an en-suite bathroom and walk-in closet. There are two secondary bedrooms at the front of the home, ideal for household members and overnight guests. The completion date, prices and features may vary and are subject to change. Please verify with Lennar directly. Photos are for illustrative purposes only.
Key facts
- Walk-in closet
- Open layout
- Covered patio
Tags
Property features AI
Finance
- HOA & community: Community amenities include clubhouse, park, pool and trails; Association management: nframark, LLC/Myla Moon; Association fee of $1,000 annually
Exterior
- Parking: Attached 2-car garage
- Utilities: Public water; Public sewer
- Home design: Residential property; Under construction (new construction); Single-level entry (First floor living shown)
- Construction: Built in 2026; Brick construction; Composition roof; Slab foundation
- Exterior features: Subdivision lot; Association pool
Interior
- Kitchen: Dishwasher; Electric oven; Electric range; Gas oven; Gas range
- Bedrooms: Primary bedroom (First floor); Bedroom (First floor); Bedroom (First floor)
- Flooring: Carpet; Vinyl
- Bathrooms: 2 full bathrooms
- Heating & cooling: Central heating (electric and gas); Central air (electric and gas)
- Interior features: Breakfast bar; Double vanity; Kitchen open to family room; Tub with shower
- Laundry & utility: Washer hookup; Electric dryer hookup; Gas dryer hookup
Neighborhood map
What this means for you Summary
Snapshot
- This is a 3-bed/2.0-bath single-family listed at $213k. Condition is rated good.
Deal economics
- At list price, monthly cash flow is $-621 ($-7k/yr) — negative.
- To cash-flow at today's rent, offer at most $178k (16.2% below list).
- To meet the 1% rule (rent ≥ 1% of price), the offer needs to be $167k (21.8% below list).
- Recommended offer: $167k (21.8% below list) — sets the bar for 1% rule.
Location & tenants
- Location reads 74/100 on livability (#171 in TX, #4,520 nationally) — a middle-class / working-renter tenant base. Strengths: cost of living A+, housing A+, employment A-; Watch: amenities F, commute F.
- Angleton ISD (suburban): math 36% / reading 44% proficiency, ranked #375 of 826 in TX (top 45%) — families likely to look elsewhere, expect single-tenant / working-renter base with shorter leases.
- Zoned schools: Rancho Isabella El (math 42% / reading 47%, grade F, #1,155 of 4,322 statewide, top 29%, 418 students, 68% FRL); Angleton J H School (math 26% / reading 41%, grade F, #911 of 1,662 statewide, top 56%, 1,561 students, 68% FRL); Angleton H S (math 22% / reading 45%, grade F, #1,011 of 1,632 statewide, top 63%, 2,066 students, 67% FRL).
- Market conditions: 932 active listings in the ZIP; solid renter incomes; 3,960 units permitted in Brazoria County in 2024 (593 in 5+ unit buildings).
Forward outlook
- Local home prices are declining (-3.0%/yr); year-one equity from $2k of loan paydown is wiped out by about $8k of value loss. Plan a longer hold.
- Brazoria County population projected at +44% by 2050 — long-run rental-demand tailwind backs the buy-and-hold thesis.
Negotiation context
- It's been on market 44 days — a 3% lower offer ($207k) is reasonable based on typical stale-listing flexibility.
Risks & watch-outs
- Climate carrying-cost: severe wind risk, 99% chance of damaging wind over 30y; extreme-heat days projected 7→25/yr by 2055 (HVAC capex compounding) — expect insurance premiums to compound above CPI over the hold.
Questions for the listing agent
- What do current leases actually rent for vs. the listed asking? Can we see a recent rent roll and the last 12 months of T-12 income?
- It's been on market 44 days. Have you received any prior offers? Is the seller open to a 22% concession, seller financing, or rate buy-down credit?
- What does the HOA fee cover, when was the last increase, and are there any pending special assessments or reserve-fund shortfalls?
- Is there a deadline driving the sale (1031 exchange, divorce, estate, relocation)? That informs how much negotiation room exists.
- Schools are D-rated, which usually means shorter tenancies and higher turnover. Who's the typical renter profile here, and what's been the actual vacancy rate?
- The area grade is low — what's the realistic commute time and amenity access for the typical tenant pool here? Any planned neighborhood developments (good or bad) we should know about?
- What's the average days-on-market for RENTAL listings here right now (not sales)? A rising rental-DOM trend means longer vacancies and softer asking-rent achievability than the comps imply.
- What's the recent tenant-quality profile in this submarket — average credit score on applications, eviction rate, late-payment / NSF rate, and stable-employment percentage? A property-management company in the area should have these aggregated.
- How much new for-sale + rental construction is in the pipeline within 1–3 miles? Heavy new supply typically softens prices + rents 12–24 months out; constrained supply supports both.
Investment metrics
- 1% rule
- 0.62% ✗
- Cap rate
- 3.52%
- Cash-on-cash
- -9.91%
- DSCR
- 0.56
- GRM
- 13.4
CMA / ARV
- ARV (median comp)
- $268,265
- List price
- $212,990
- Delta
- -20.60%
- Verdict
- UNDERPRICED
- Comps
- 20 within 1.0 mi
Show comp detail 9 sales within ~0.75 mi
| Address | Dist | Beds/Ba | Sqft | Sold | Price | $/sf | Match |
|---|---|---|---|---|---|---|---|
| 7922 Jasper Meadows Way | 0.10mi | 4/2.0 (+1) | 1,751 (+8%) | 3mo | $324,390 | $185 | 76 |
| 7811 Jade Crest Dr | 0.62mi | 3/2.0 | 1,602 (-2%) | 2mo | $270,825 | $169 | 67 |
| 3130 Diamond View Ln | 0.67mi | 3/2.0 | 1,769 (+9%) | 0mo | $283,240 | $160 | 54 |
| 7815 Jade Crest Dr | 0.61mi | 4/2.0 (+1) | 1,749 (+7%) | 2mo | $270,325 | $155 | 53 |
| 3135 Diamond View Ln | 0.70mi | 3/2.0 | 1,429 (-12%) | 1mo | $266,540 | $187 | 46 |
| 3123 Diamond View Ln | 0.71mi | 3/2.0 | 1,429 (-12%) | 1mo | $265,990 | $186 | 45 |
| 3111 Diamond View Ln | 0.72mi | 3/2.0 | 1,429 (-12%) | 1mo | $264,990 | $185 | 45 |
| 3138 Diamond View Ln | 0.66mi | 4/2.0 (+1) | 1,827 (+12%) | 1mo | $294,540 | $161 | 43 |
| 3118 Diamond View Ln | 0.69mi | 4/2.0 (+1) | 1,827 (+12%) | 1mo | $293,990 | $161 | 42 |
Match score weights: distance 35% · size 25% · config 20% · recency 20%. Top-matched comps best support the ARV.
Projected returns pro-forma
-3.0% appreciation · 3.0% rent growth · sell at horizon
- IRR
- -34.1%
- Equity multiple
- -0.10×
- Total profit
- $-82,918
- Equity at exit
- $39,999
- IRR
- -42.7%
- Equity multiple
- -0.63×
- Total profit
- $-122,788
- Equity at exit
- $23,195
Cash invested: $75,114 (down + closing). Projections, not guarantees.
Landlord ↔ Tenant lean methodology
- Overall (STATE)
- 87 Strongly Landlord-Friendly
- State Texas
- 87 Strongly Landlord-Friendly · R+5
- County
- — inherits STATE
- City
- — inherits STATE
ZIP-level market 77515
- Home prices YoY
- -5.1%
- Active inventory
- 932
- Price-to-rent
- 10.7×
Monthly cashflow live
- Estimated rent
- $1,666 medium interval (Pro) →
- Mortgage (P&I)
- −$1,407
- Tax est. 1.5%
- −$335 /mo · $4,024/yr
- Insurance
- −$112
- HOA
- −$83
- Vacancy / Maint / Mgmt
- −$350
- Net cashflow
- $-621
Break-even live
Sensitivity live
| Price | -10% $-435 | -5% $-528 | +0% $-621 | +5% $-713 | +10% $-806 |
|---|---|---|---|---|---|
| Rent | -10% $-752 | -5% $-686 | +0% $-621 | +5% $-555 | +10% $-489 |
| Rate | -1.0pp $-485 | -0.5pp $-552 | base $-621 | +0.5pp $-690 | +1.0pp $-761 |
UW: 25.0% down · 7.5% · 30yr · 1.5% tax · 5.0% vac · 8.0% maint · 8.0% mgmt
Financing live
Cash to close
- Down payment
- $67,066
- Closing costs
- $8,048
- Reserves months
- —
- Total cash needed
- —
Loan-product check · same deal, 3 products live
Conventional
25% down · 7.5% · 30yr
- Down + closing
- —
- Monthly P&I
- —
- Monthly cashflow
- —
- DSCR
- —
- Eligible?
- —
Personal DTI + credit; lowest rate.
DSCR
20% down · 8.5% · 30yr
- Down + closing
- —
- Monthly P&I
- —
- Monthly cashflow
- —
- DSCR
- —
- Eligible?
- —
No personal income docs; deal must DSCR.
Hard money
10% down · 12.0% · 12mo
- Down + closing
- —
- Monthly P&I
- —
- Monthly cashflow
- —
- DSCR
- —
- Eligible?
- —
Short-term bridge; refi at stabilization.
HOA detail
- Monthly dues
- $83 · $996/yr
Listing history 18 events
-
2026-06-18status $212,990 Pending 44 DOM
-
2026-06-18days on market $212,990 Active 44 DOM
-
2026-06-17days on market $212,990 Active 43 DOM
-
2026-06-16days on market $212,990 Active 42 DOM
-
2026-06-15remarks 618-char remark
-
2026-06-15days on market $212,990 Active 41 DOM
-
2026-06-13pricedays on market $212,990 Active 39 DOM
-
2026-06-09days on market $226,390 Active 35 DOM
-
2026-06-08days on market $226,390 Active 34 DOM
-
2026-06-07days on market $226,390 Active 33 DOM
-
2026-06-04days on market $226,390 Active 30 DOM
-
2026-06-03days on market $226,390 Active 29 DOM
-
2026-06-02days on market $226,390 Active 28 DOM
-
2026-06-01days on market $226,390 Active 27 DOM
-
2026-05-31days on market $226,390 Active 26 DOM
-
2026-05-14price $226,390 582-char remark
-
2026-05-07price $235,290 582-char remark
-
2026-05-05$239,690 Active 582-char remark
ⓘ Source: listings_history table (triggers on properties + properties_extension) + one-shot
backfill from property_details.listing_events for pre-trigger history.
Climate risk First Street
- Flood 4/10 Moderate FEMA zone X (shaded) · 21% chance over 30 yrs
- Wildfire 4/10 Moderate
- Heat 10/10 Extreme 7 d/yr ≥109°F today · 25 d/yr by 30 yrs out
- Wind 9/10 Extreme 99% chance of damaging wind over 30 yrs
- Air quality 2/10 Low 1 unhealthy d/yr today · 1 by 30 yrs out
Nearby sold comps map
Loading sold comps map…
Walkable amenities ~0.75 mi
Loading nearby amenities…
Taxation est. · year 1
- Rental income
- $19,995
- − Mortgage interest
- −$15,027
- − Property taxes
- −$4,024
- − Insurance
- −$1,341
- − Repairs & maintenance
- −$1,600
- − Management
- −$1,600
- − HOA
- −$996
- − Depreciation
- −$7,804
- Taxable loss
- −$12,396
- Est. tax savings @ 24.0%
- +$2,975
- After-tax cash flow
- $-4,472/yr
For passive investors: Depreciation is non-cash, so a rental often shows a tax loss while cash-flowing — sheltering income. Rental losses are passive: they offset passive income freely, and up to $25,000/yr can offset ordinary (W-2) income if you actively participate and your MAGI is under $100k (phasing out to $0 by $150k); unused losses carry forward. On sale, claimed depreciation is recaptured at up to 25%, and gains may owe capital-gains tax (a 1031 exchange can defer both). Figures are a year-1 estimate at your 24.0% rate — not tax advice; consult a CPA.
Condition & rehab AI · 27 photos
This single-story home features a modern open layout with good condition and minimal repairs needed. It's move-in ready with a good curb appeal and potential for value enhancement through exterior painting and window cleaning.
Value-add opportunities
- Both Paint the exterior brick — Enhances curb appeal and value
- Both Replace the front door — Improves security and aesthetics
- Both Clean the windows — Enhances natural light and overall appearance
Renovation cost estimate screening
Value-add ROI direction
- Both Paint the exterior brick — Enhances curb appeal and value ↑
- Both Replace the front door — Improves security and aesthetics ↑
- Both Clean the windows — Enhances natural light and overall appearance ↑
ⓘ Cost ranges are severity-bucket heuristics (US national rule-of-thumb). Get contractor quotes + a written scope before underwriting a rehab budget.
Schools (NCES district)
- District
- Angleton ISD
- NCES district ID
- 4808310
- Math proficiency
- 36% ▼ -8.00%
- Reading proficiency
- 44% ▲ 1.00%
- Median HH income
- $55,670
- Composite
- 35.01/100
- National rank
- #5046
- State rank
- #375 of 826 in TX
Livability — Angleton
- Score
- 74/100
- State rank
- #171
- US rank
- #4520
Category grades
Schools grade is shown separately in the Schools card above.
Census & demographics
- County
- Brazoria County · 374,982 people
- City population
- 34,088
- Metro
- Houston-The Woodlands-Sugar Land, TX
- Population (ZIP)
- 34,088
- Household income
- $88,787
- Rent vs Own
- Severe rent burden
- 785.0
Population outlook (Brazoria County) Hauer SSP2
- Today (2025)
- 420,414 people
- By 2030
- 457,585 · +8.8%
- By 2040
- 532,232 · +26.6%
- By 2050
- 605,399 · +44.0%
- By 2075
- 779,358 · +85.4%
- By 2100
- 883,759 · +110.2%
Race, ethnicity, and origin ACS 2023
- Neighborhood character
- Diverse neighborhood (Simpson 0.58)
- Race & ethnicity
- White 55% Hispanic / Latino 33% Two or more races 18% Black 8% Asian 2%
- Hispanic origin (detail)
- Mexican 28%
- Common ancestry
- Lithuanian 3% Romanian 2% Slovak 1%
- Foreign-born
- 8% · Canada, Vietnam
- Languages at home
- 78% English-only · Spanish 20% Other Asian/Pacific 1%
Political lean MEDSL · Brazoria
- 2024 margin
- R (+19.7) · D 39.5% · R 59.2% · Other 1.3%
- 2008→2024 swing
- +9.9pp toward D · 2008: -29.6pp · 2024: -19.7pp
- All cycles
- 2024: R+19.7 2020: R+18.2 2016: R+24.6 2012: R+34.2 2008: R+29.6
Not yet ingested
- Civics
- —
Market trends
- HPI YoY
- ▼ -15.59%
- Current HPI
- 288.7286
- Rent YoY
- —
- Metro
- Houston-The Woodlands-Sugar Land, TX
- State GDP YoY
- ▲ 3.95%
- F500 in state
- 110
Industry mix (Fortune 500 HQ in TX)
| Industry | F500 HQs | Revenue |
|---|---|---|
| Energy | 16 | $1,198B |
|
||
| Technology | 5 | $198B |
|
||
| Engineering / Construction | 4 | $72B |
|
||
| Energy Services | 3 | $60B |
|
||
| Utilities | 3 | $41B |
|
||
| Healthcare | 2 | $330B |
|
||
Price history
-11.1% since first listed5 events — show timeline
- 2026-06-12 Price Changed $212,990 HARMLS
- 2026-06-11 Price Changed $213,990 HARMLS
- 2026-05-14 Price Changed $226,390 HARMLS
- 2026-05-07 Price Changed $235,290 HARMLS
- 2026-05-05 Listed $239,690 HARMLS
Cash-flow waterfall
monthlySold comps — $/sqft
last 12 mo · ≤1 miLoading sold comps…