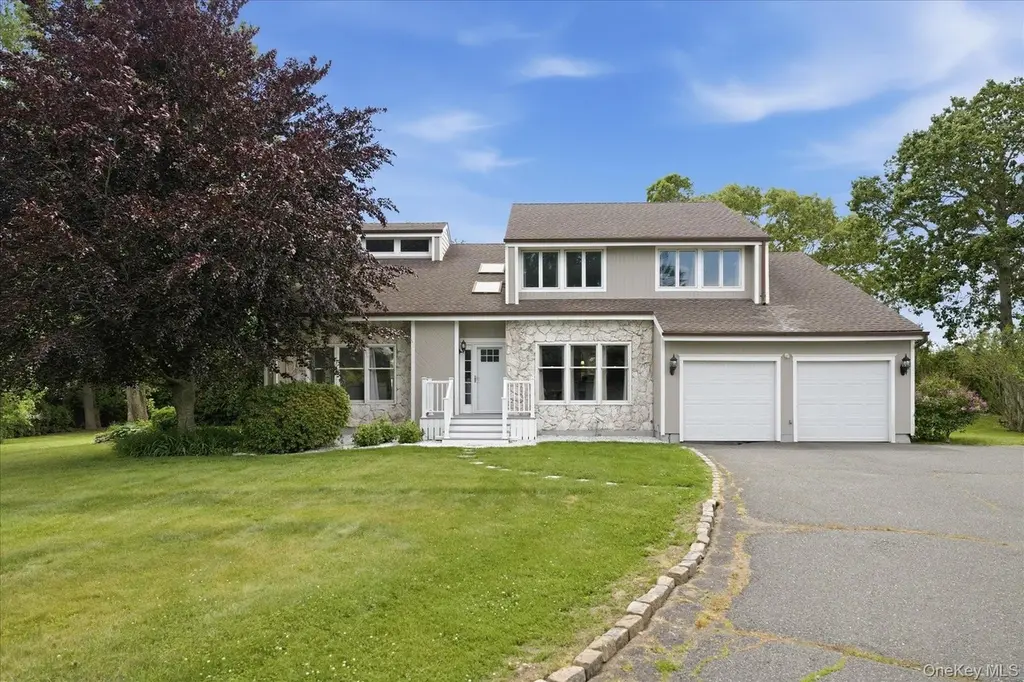
117 Southfield Rd · Baiting Hollow, NY
Flood risk 1/10 · Minimal
- FEMA flood zone
- X (unshaded)
- Chance of flooding over 30 yrs
- 0.0%
- Est. flood insurance / yr
- $473 – $860
Fire risk 3/10 · Minor
- Est. fire insurance / yr
- $691 – $1,283
Heat risk 5/10 · Moderate
- Hot days now (above 93°F)
- 7 days/yr
- Hot days in 30 yrs
- 19 days/yr
Wind risk 8/10 · Major
- Chance of severe wind over 30 yrs
- 80.0%
Air-quality risk 3/10 · Minor
- Unhealthy air days now
- 2 days/yr
- Unhealthy air days in 30 yrs
- 3 days/yr
Risk factors via First Street. Map © Google.
Why this score? — see what drove the C- grade
The composite is a weighted blend of 9 inputs, each scored 0–100. Each bar is that input's sub-score; the figure is the points it added to the 100-point composite (weight × sub-score).
- Cash flow +20.1/30.0
- Appreciation +6.6/10.0
- DSCR +6.4/10.0
- 1% rule +5.1/10.0
- Schools +3.6/10.0
- Livability +3.0/5.0
- Rent growth +2.5/5.0
- Condition / age +2.5/5.0
- ARV discount +2.1/15.0
$974,990
🖨 Deal sheet 📄 Offer letter ✓ Due diligence
Listing remarks MLS
Beautiful, Light & Bright Sits This 5Br, 2.55 Bath Contemporary In Desirable 'The Manors' On Very Private 1 Acre Flag Lot W/Vaulted Ceilings, 4 Skylights, New Wood Floors, Cac, New Roof, Nicely Landscaped With Decking, Igs, Oversized Shed; Close To Schools & Shopping; A Must See!, Additional information: Appearance:Mint,Separate Hotwater Heater:Yes
Key facts
- Private flag lot
- Formal dining room
- Brand new kitchen
Tags
Property features AI
Exterior
- Parking: Driveway and off-street parking for a total of 7 vehicles; Attached/has 2-car garage
- Security: Security features present
- Utilities: PSEG electric; Propane available; Water connected; Septic tank; Cable available; Phone available; Public trash collection
- Home design: Single family residence; Three or more levels; Property condition listed as actual; Cleared lot with views
- Construction: Frame, stone, and vinyl siding exterior; Full basement (partial unfinished attic)
- Exterior features: Patio; Porch; Fire pit; Exterior lighting; Mailbox; Rain gutters; Wood fencing; Shed(s)
Interior
- Kitchen: Dishwasher; Electric range; Microwave; Refrigerator; Stainless steel appliances; Water purifier (owned)
- Bedrooms: Bedrooms located across three or more levels
- Flooring: Hardwood floors
- Bathrooms: Three full bathrooms; One half bathroom; Primary bathroom includes soaking tub
- Heating & cooling: Baseboard heating; Central air conditioning with ductwork
- Interior features: Built-in features; Cathedral ceilings; Central vacuum; Eat-in kitchen; Entrance foyer; Formal dining; High ceilings; Open kitchen; Primary bathroom; Quartz/quartzite counters; Recessed lighting; Soaking tub; Walk-in closet(s); Washer/dryer hookup; Floor-to-ceiling windows; Skylight(s); Window screens; Window shutters; ENERGY STAR qualified windows; Casement windows; Double-pane insulated windows
- Laundry & utility: Washer; Dryer; Laundry room with inside hookup
Neighborhood map
What this means for you Summary
Snapshot
- This is a 4-bed/2.5-bath single-family listed at $975k.
Deal economics
- At list price, monthly cash flow is $1k ($15k/yr) — positive.
- The deal already cash-flows at list — no discount required.
- Meets the 1% rule at list price ($10k rent vs $975k).
- Cap rate 7.8% vs local median 5.5% in Baiting Hollow — top-decile yield for the area; either an underpriced asset or a hidden risk that comps aren't pricing in. Stress-test before assuming the spread holds.
Location & tenants
- Location reads 60/100 on livability (#953 in NY) — a middle-class / working-renter tenant base. Strengths: crime A+, employment A+, housing A+; Watch: amenities F, commute F, cost of living F.
- Riverhead Central School District (suburban): math 34% / reading 48% proficiency, ranked #489 of 590 in NY (top 83%) — families likely to look elsewhere, expect single-tenant / working-renter base with shorter leases.
- Zoned schools: Riley Avenue School (math 42% / reading 52%, grade D-, #1,195 of 2,108 statewide, top 60%, 461 students, 34% FRL); Riverhead Middle School (math 18% / reading 35%, grade F, #594 of 729 statewide, top 81%, 827 students, 57% FRL); Riverhead Senior High School (math 80% / reading 86%, grade A, #440 of 1,100 statewide, top 40%, 2,001 students, 52% FRL).
- Market conditions: 84 active listings in the ZIP; 2 comparable units currently listed for rent nearby; 1,366 units permitted in Suffolk County in 2024 (216 in 5+ unit buildings).
Forward outlook
- In year one you build about $39k of equity ($7k loan paydown + $32k appreciation (3.3% local appreciation)).
- Suffolk County population projected to shrink 5% by 2050 — rents likely to lag national; underwrite the cash flow, not the appreciation.
- At projected returns (3.3% appreciation + 3.0% rent growth), your $273k cash investment doubles in ~5 years — after that, you're playing with house money.
- By year 2, paydown + projected appreciation supports a ~$62k cash-out refi (75% LTV) — recoverable capital for the next deal without selling this one.
Negotiation context
- Only 10 days on market — expect competitive offers; lowballing is unlikely to land.
- 2 sale attempts since 14y ago with the ask held roughly flat each time — persistent listings suggest the price (not the market) is what's stuck; bring a comps-based counter.
- Current owner paid $335k; list at $975k implies a 191% gain — meaningful room to come down on a strong offer.
Risks & watch-outs
- Climate carrying-cost: severe wind risk, 80% chance of damaging wind over 30y; extreme-heat days projected 7→19/yr by 2055 (HVAC capex compounding) — expect insurance premiums to compound above CPI over the hold.
Questions for the listing agent
- Is there a deadline driving the sale (1031 exchange, divorce, estate, relocation)? That informs how much negotiation room exists.
- Schools are D-rated, which usually means shorter tenancies and higher turnover. Who's the typical renter profile here, and what's been the actual vacancy rate?
- What's the average days-on-market for RENTAL listings here right now (not sales)? A rising rental-DOM trend means longer vacancies and softer asking-rent achievability than the comps imply.
- What's the recent tenant-quality profile in this submarket — average credit score on applications, eviction rate, late-payment / NSF rate, and stable-employment percentage? A property-management company in the area should have these aggregated.
- How much new for-sale + rental construction is in the pipeline within 1–3 miles? Heavy new supply typically softens prices + rents 12–24 months out; constrained supply supports both.
Investment metrics
- 1% rule
- 1.01% ✓
- Cap rate
- 7.79%
- Cash-on-cash
- 5.36%
- DSCR
- 1.24
- GRM
- 8.3
CMA / ARV
- ARV (on-the-fly)
- $870,970
- Comps found
- 6
Show comp detail 6 sales within ~0.75 mi
| Address | Dist | Beds/Ba | Sqft | Sold | Price | $/sf | Match |
|---|---|---|---|---|---|---|---|
| 43 Southfield Rd | 0.20mi | 4/2.5 | 2,265 (-10%) | 3mo | $786,000 | $347 | 72 |
| 189 Southfield Rd | 0.18mi | 4/3.0 | 2,265 (-10%) | 4mo | $500,000 | $221 | 69 |
| 24 Pleasant Ct | 0.27mi | 4/2.5 | 2,265 (-10%) | 6mo | $810,000 | $358 | 66 |
| 60 May Dr | 0.63mi | 4/2.5 | 2,445 (-3%) | 7mo | $900,000 | $368 | 61 |
| 59 Mastro Rd | 0.60mi | 4/3.5 | 2,828 (+13%) | 4mo | $880,000 | $311 | 44 |
| 80 May Dr | 0.66mi | 4/3.0 | 2,600 (+4%) | 24mo | $796,000 | $306 | 41 |
Match score weights: distance 35% · size 25% · config 20% · recency 20%. Top-matched comps best support the ARV.
Projected returns pro-forma
3.26% appreciation · 3.0% rent growth · sell at horizon
- IRR
- 13.2%
- Equity multiple
- 1.76×
- Total profit
- $208,550
- Equity at exit
- $452,719
- IRR
- 14.9%
- Equity multiple
- 3.26×
- Total profit
- $617,341
- Equity at exit
- $709,038
Cash invested: $272,997 (down + closing). Projections, not guarantees.
Landlord ↔ Tenant lean methodology
- Overall (STATE)
- 15 Strongly Tenant-Friendly
- State New York
- 15 Strongly Tenant-Friendly · D+10
- County
- — inherits STATE
- City
- — inherits STATE
ZIP-level market 11933
- Home prices YoY
- 0.8%
- Active inventory
- 84
- Price-to-rent
- 8.3×
Monthly cashflow live
- Estimated rent
- $9,832 medium interval (Pro) →
- Mortgage (P&I)
- −$5,113
- Tax from tax record
- −$1,030 /mo · $12,358/yr
- Insurance
- −$406
- HOA
- −$0
- Vacancy / Maint / Mgmt
- −$2,065
- Net cashflow
- $1,218
Break-even live
UW: 25.0% down · 7.5% · 30yr · 1.5% tax · 5.0% vac · 8.0% maint · 8.0% mgmt
Financing live
Cash to close
- Down payment
- $243,748
- Closing costs
- $29,250
- Reserves months
- —
- Total cash needed
- —
Loan-product check · same deal, 3 products live
Conventional
25% down · 7.5% · 30yr
- Down + closing
- —
- Monthly P&I
- —
- Monthly cashflow
- —
- DSCR
- —
- Eligible?
- —
Personal DTI + credit; lowest rate.
DSCR
20% down · 8.5% · 30yr
- Down + closing
- —
- Monthly P&I
- —
- Monthly cashflow
- —
- DSCR
- —
- Eligible?
- —
No personal income docs; deal must DSCR.
Hard money
10% down · 12.0% · 12mo
- Down + closing
- —
- Monthly P&I
- —
- Monthly cashflow
- —
- DSCR
- —
- Eligible?
- —
Short-term bridge; refi at stabilization.
Rent comps 2 comps
| Address | Beds | Baths | Sqft | Rent | $/sqft | DOM | Units | Dist |
|---|---|---|---|---|---|---|---|---|
| 16 Mastro Ct Calverton, NY | 3.0 | 2.5 | 1822 | $7,500 | $4.12 | 1d | 1 | 0.98mi |
| 184 Twomey Ave Calverton, NY | 3.0 | 2.0 | 2718 | $12,000 | $4.42 | 1d | 1 | 1.16mi |
Listing history 7 events
-
2026-06-18days on market $974,990 Active 10 DOM
-
2026-06-17days on market $974,990 Active 9 DOM
-
2026-06-16days on market $974,990 Active 8 DOM
-
2026-06-15days on market $974,990 Active 7 DOM
-
2026-06-13days on market $974,990 Active 5 DOM
-
2026-06-09remarks 687-char remark
-
2026-06-09$974,990 Active 1 DOM
ⓘ Source: listings_history table (triggers on properties + properties_extension) + one-shot
backfill from property_details.listing_events for pre-trigger history.
Tax reassessment forecast NY · Partial reset (capped growth)
- Current annual tax
- $12,358 · $1,030/mo
- Projected year-2 tax
- $14,418 · $1,201/mo
- Expected delta
- +$2,060/yr (+$172/mo · 16.7%)
ⓘ Screening estimate from a state-policy table — verify with the county assessor before closing.
Climate risk First Street
- Flood 1/10 Low FEMA zone X (unshaded) · 0% chance over 30 yrs
- Wildfire 3/10 Moderate
- Heat 5/10 Major 7 d/yr ≥93°F today · 19 d/yr by 30 yrs out
- Wind 8/10 Severe 80% chance of damaging wind over 30 yrs
- Air quality 3/10 Moderate 2 unhealthy d/yr today · 3 by 30 yrs out
Nearby sold comps map
Loading sold comps map…
Walkable amenities ~0.75 mi
Loading nearby amenities…
Taxation est. · year 1
- Rental income
- $117,987
- − Mortgage interest
- −$54,615
- − Property taxes
- −$12,358
- − Insurance
- −$4,875
- − Repairs & maintenance
- −$9,439
- − Management
- −$9,439
- − Depreciation
- −$28,363
- Taxable loss
- −$1,102
- Est. tax savings @ 24.0%
- +$264
- After-tax cash flow
- $14,886/yr
For passive investors: Depreciation is non-cash, so a rental often shows a tax loss while cash-flowing — sheltering income. Rental losses are passive: they offset passive income freely, and up to $25,000/yr can offset ordinary (W-2) income if you actively participate and your MAGI is under $100k (phasing out to $0 by $150k); unused losses carry forward. On sale, claimed depreciation is recaptured at up to 25%, and gains may owe capital-gains tax (a 1031 exchange can defer both). Figures are a year-1 estimate at your 24.0% rate — not tax advice; consult a CPA.
Schools (NCES district)
- District
- Riverhead Central School District
- NCES district ID
- 3624690
- Math proficiency
- 34% ▼ -4.00%
- Reading proficiency
- 48% ▲ 13.00%
- Median HH income
- $61,607
- Composite
- 36.38/100
- National rank
- #4683
- State rank
- #489 of 590 in NY
Livability — Baiting Hollow
- Score
- 60/100
- State rank
- #953
- US rank
- #18639
Category grades
Schools grade is shown separately in the Schools card above.
Census & demographics
- Census place
- Baiting Hollow, NY
- Population (ZIP)
- 6,784
Population outlook (Suffolk County) Hauer SSP2
- Today (2025)
- 1,505,262 people
- By 2030
- 1,498,318 · -0.5%
- By 2040
- 1,471,101 · -2.3%
- By 2050
- 1,424,848 · -5.3%
- By 2075
- 1,337,157 · -11.2%
- By 2100
- 1,217,720 · -19.1%
Race, ethnicity, and origin ACS 2023
- Neighborhood character
- Predominantly White (79%)
- Race & ethnicity
- White 79% Hispanic / Latino 10% Black 8% Two or more races 2% Asian 1%
- Hispanic origin (detail)
- Puerto Rican 1% Dominican 4%
- Common ancestry
- Romanian 5% Lithuanian 3% Iranian 1%
- Foreign-born
- 11% · Canada, Jamaica, South Korea
- Languages at home
- 85% English-only · Spanish 10% Other Indo-European 3% German/W. Germanic 1%
Political lean MEDSL · Suffolk
- 2024 margin
- Lean R (+10.0) · D 45.0% · R 55.0%
- 2008→2024 swing
- -16.0pp toward R · 2008: 6.0pp · 2024: -10.0pp
- All cycles
- 2024: R+10.0 2020: R+0.0 2016: R+8.2 2012: D+2.9 2008: D+6.0
Not yet ingested
- Civics
- —
Market trends
- HPI YoY
- ▲ 3.26%
- Current HPI
- 397.7148
- Rent YoY
- —
- Metro
- —
- State GDP YoY
- ▲ 2.60%
- F500 in state
- 92
Industry mix (Fortune 500 HQ in NY)
| Industry | F500 HQs | Revenue |
|---|---|---|
| Financial Services | 10 | $950B |
|
||
| Consumer Goods | 9 | $162B |
|
||
| Insurance | 4 | $225B |
|
||
| Telecommunications | 2 | $144B |
|
||
| Pharmaceuticals | 2 | $112B |
|
||
| Media / Entertainment | 2 | $69B |
|
||
Price history
+322.1% since first listed9 events — show timeline
- 2026-06-08 Listed $974,990 OneKey® MLS as Distributed by MLS Grid
- 2013-07-08 Sold (Public Records) $335,000 Public Records
- 2013-06-03 Sold (MLS) $335,000 OneKey® MLS as Distributed by MLS Grid
- 2012-07-06 Listed $349,996 OneKey® MLS as Distributed by MLS Grid
- 2008-01-15 Sold (Public Records) $425,000 Public Records
- 1997-04-15 Sold (Public Records) $164,000 Public Records
- 1992-01-31 Sold (Public Records) $125,000 Public Records
- 1992-01-08 Sold (Public Records) $125,000 Public Records
- 1991-09-03 Sold (Public Records) $231,000 Public Records
Property tax history
+1.6%/yrLatest (2025): $12,358 · +0.0% YoY. Source: county tax records.
Cash-flow waterfall
monthlySold comps — $/sqft
last 12 mo · ≤1 miLoading sold comps…