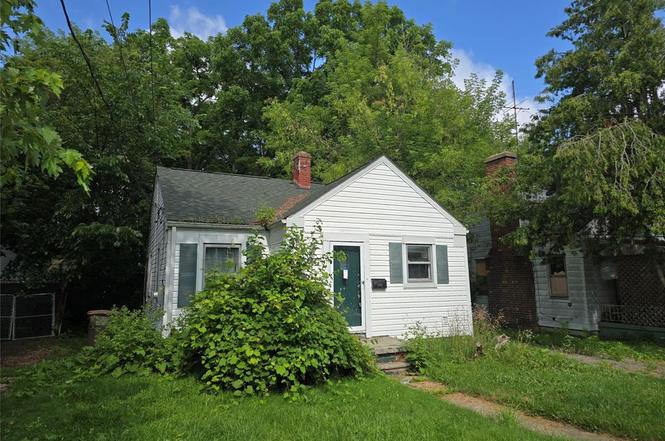
28 S Marshall St · Pontiac, MI
Flood risk 1/10 · Minimal
- FEMA flood zone
- X (unshaded)
- Chance of flooding over 30 yrs
- 0.0%
- Est. flood insurance / yr
- $473 – $860
Fire risk 1/10 · Minimal
- Est. fire insurance / yr
- $784 – $1,456
Heat risk 2/10 · Minimal
- Hot days now (above 96°F)
- 7 days/yr
- Hot days in 30 yrs
- 15 days/yr
Wind risk 2/10 · Minimal
- Chance of severe wind over 30 yrs
- —
Air-quality risk 3/10 · Minor
- Unhealthy air days now
- 2 days/yr
- Unhealthy air days in 30 yrs
- 4 days/yr
Risk factors via First Street. Map © Google.
Why this score? — see what drove the B- grade
The composite is a weighted blend of 9 inputs, each scored 0–100. Each bar is that input's sub-score; the figure is the points it added to the 100-point composite (weight × sub-score).
- Cash flow +30.0/30.0
- 1% rule +10.0/10.0
- DSCR +10.0/10.0
- ARV discount +7.5/15.0
- Livability +3.2/5.0
- Rent growth +2.5/5.0
- Condition / age +2.5/5.0
- Schools +1.0/10.0
- Appreciation +0.0/10.0
$50,000
🖨 Deal sheet 📄 Offer letter ✓ Due diligence
Listing remarks MLS
CASH OR REHAB LOAN ONLY. GREAT CHANCE FOR INVESTORS TO BRING THIS HOME BACK TO LIFE. 2 BEDROOM AND BASEMENT OPEN LIVING ROOM ROOM KITCHEN AREA MAKE THIS A GREAT HOUSE FOR A NEW FAMILY OR A RENTAL. LESS THAN 5 MIN TO FREEWAY. ALL OFFERS SUBJECT TO PROBATE COURT APPROVAL. MULTIPLE OFFER ARE NOW IN. * * * * * * * HIGHEST AND BEST BY 07/11 AT 1PM. * * * * * * *
Key facts
- 4,792 sq ft lot
- Built 1941
- Listed 2 days
Neighborhood map
What this means for you Summary
Snapshot
- This is a 2-bed/1.0-bath single-family listed at $50k.
Deal economics
- At list price, monthly cash flow is $678 ($8k/yr) — positive.
- The deal already cash-flows at list — no discount required.
- Meets the 1% rule at list price ($1k rent vs $50k).
- Cap rate 22.6% vs local median 6.7% in Pontiac — top-decile yield for the area; either an underpriced asset or a hidden risk that comps aren't pricing in. Stress-test before assuming the spread holds.
Location & tenants
- Location reads 64/100 on livability (#499 in MI) — a middle-class / working-renter tenant base. Strengths: commute A+, cost of living A+, housing A+; Watch: health & safety D, schools F, crime F.
- Pontiac City School District (urban): math 8% / reading 17% proficiency, ranked #514 of 540 in MI (top 95%) — low school quality limits family demand, transient renter base, plan for 1-2y turnover; 81% free/reduced lunch — lower-income household profile, screen leases tightly.
- Market conditions: 87 active listings in the ZIP; 11 comparable units currently listed for rent nearby; rentals at typical pace (median 24d on market — plan ~3-4 weeks tenant-placement turnaround); 2,614 units permitted in Oakland County in 2024 (721 in 5+ unit buildings).
Forward outlook
- Local home prices are declining (-3.0%/yr); year-one equity from $346 of loan paydown is wiped out by about $2k of value loss. Plan a longer hold.
- Oakland County population projected at +10% by 2050 — modest demand growth; plan on rents tracking national, not racing it.
- At projected returns (-3.0% appreciation + 3.0% rent growth), your $14k cash investment doubles in ~2 years — after that, you're playing with house money.
Negotiation context
- Only 2 days on market — expect competitive offers; lowballing is unlikely to land.
- 2 sale attempts with the ask held roughly flat each time — persistent listings suggest the price (not the market) is what's stuck; bring a comps-based counter.
Risks & watch-outs
- Watch-outs: property tax is 3.3% of price; built in 1941 — expect roof / HVAC / electrical / plumbing capex.
Questions for the listing agent
- Built in 1941 — when were the roof, HVAC, electrical panel, plumbing, and water heater last replaced?
- Property tax is high relative to price — has the assessment been appealed recently, and will the sale trigger a re-assessment?
- Is there a deadline driving the sale (1031 exchange, divorce, estate, relocation)? That informs how much negotiation room exists.
- Schools are F-rated, which usually means shorter tenancies and higher turnover. Who's the typical renter profile here, and what's been the actual vacancy rate?
- Crime grade is F in this area — have there been break-ins, vandalism, or insurance claims at this property in the last 3 years? What carrier currently insures it and at what premium?
- What's the average days-on-market for RENTAL listings here right now (not sales)? A rising rental-DOM trend means longer vacancies and softer asking-rent achievability than the comps imply.
- What's the recent tenant-quality profile in this submarket — average credit score on applications, eviction rate, late-payment / NSF rate, and stable-employment percentage? A property-management company in the area should have these aggregated.
- How much new for-sale + rental construction is in the pipeline within 1–3 miles? Heavy new supply typically softens prices + rents 12–24 months out; constrained supply supports both.
Investment metrics
- 1% rule
- 2.78% ✓
- Cap rate
- 22.55%
- Cash-on-cash
- 58.08%
- DSCR
- 3.58
- GRM
- 3.0
CMA / ARV
- ARV (on-the-fly)
- $145,794
- Comps found
- 10
Show comp detail 10 sales within ~0.75 mi
| Address | Dist | Beds/Ba | Sqft | Sold | Price | $/sf | Match |
|---|---|---|---|---|---|---|---|
| 32 S Marshall St | 0.01mi | 3/1.0 (+1) | 1,491 (-4%) | 11mo | $81,000 | $54 | 79 |
| 291 Michigan Ave | 0.27mi | 2/1.5 | 1,400 (-10%) | 5mo | $108,000 | $77 | 65 |
| 23 Martin Luther King JR Blvd N | 0.12mi | 3/1.5 (+1) | 1,412 (-9%) | 13mo | $205,000 | $145 | 62 |
| 116 Raymond St | 0.42mi | 3/1.5 (+1) | 1,511 (-3%) | 9mo | $225,000 | $149 | 62 |
| 228 S Marshall St | 0.38mi | 3/1.0 (+1) | 1,606 (+4%) | 16mo | $135,500 | $84 | 58 |
| 103 N Roselawn St | 0.50mi | 3/2.0 (+1) | 1,487 (-4%) | 10mo | $105,000 | $71 | 52 |
| 15 N Edith St NE | 0.14mi | 2/2.5 | 1,755 (+13%) | 24mo | $165,000 | $94 | 46 |
| 53 N Roselawn St | 0.46mi | 3/2.5 (+1) | 1,400 (-10%) | 8mo | $180,000 | $129 | 45 |
| 55 N Roselawn Street St | 0.46mi | 3/2.5 (+1) | 1,400 (-10%) | 8mo | $180,000 | $129 | 45 |
| 200 Whittemore St | 0.73mi | 3/1.0 (+1) | 1,650 (+6%) | 19mo | $135,000 | $82 | 34 |
Match score weights: distance 35% · size 25% · config 20% · recency 20%. Top-matched comps best support the ARV.
Projected returns pro-forma
-3.0% appreciation · 3.0% rent growth · sell at horizon
- IRR
- 56.7%
- Equity multiple
- 3.51×
- Total profit
- $35,118
- Equity at exit
- $7,455
- IRR
- 61.6%
- Equity multiple
- 7.17×
- Total profit
- $86,419
- Equity at exit
- $4,323
Cash invested: $14,000 (down + closing). Projections, not guarantees.
Landlord ↔ Tenant lean methodology
- Overall (STATE)
- 62 Landlord-Friendly
- State Michigan
- 62 Landlord-Friendly · EVEN
- County
- — inherits STATE
- City
- — inherits STATE
ZIP-level market 48342
- Home prices YoY
- -33.8%
- Active inventory
- 87
- Price-to-rent
- 3.0×
Monthly cashflow live
- Estimated rent
- $1,390 high interval (Pro) →
- Mortgage (P&I)
- −$262
- Tax from tax record
- −$138 /mo · $1,650/yr
- Insurance
- −$21
- HOA
- −$0
- Vacancy / Maint / Mgmt
- −$292
- Net cashflow
- $678
Break-even live
UW: 25.0% down · 7.5% · 30yr · 1.5% tax · 5.0% vac · 8.0% maint · 8.0% mgmt
Financing live
Cash to close
- Down payment
- $12,500
- Closing costs
- $1,500
- Reserves months
- —
- Total cash needed
- —
Loan-product check · same deal, 3 products live
Conventional
25% down · 7.5% · 30yr
- Down + closing
- —
- Monthly P&I
- —
- Monthly cashflow
- —
- DSCR
- —
- Eligible?
- —
Personal DTI + credit; lowest rate.
DSCR
20% down · 8.5% · 30yr
- Down + closing
- —
- Monthly P&I
- —
- Monthly cashflow
- —
- DSCR
- —
- Eligible?
- —
No personal income docs; deal must DSCR.
Hard money
10% down · 12.0% · 12mo
- Down + closing
- —
- Monthly P&I
- —
- Monthly cashflow
- —
- DSCR
- —
- Eligible?
- —
Short-term bridge; refi at stabilization.
Rent comps 11 comps
| Address | Beds | Baths | Sqft | Rent | $/sqft | DOM | Units | Dist |
|---|---|---|---|---|---|---|---|---|
| 128 S Edith St Pontiac, MI | 2.0–3.0 | 2.0 | 1155 | $1,384 | $1.20 | 17d | 1 | 0.22mi |
| 38 N Shirley St Pontiac, MI | 3.0 | 1.0 | 1174 | $1,425 | $1.21 | 43d | 1 | 0.40mi |
| 16 Victory Dr Unit 18 Pontiac, MI | 2.0 | 1.0 | 1118 | $1,150 | $1.03 | 43d | 1 | 0.73mi |
| 16 Victory Dr Unit 18 Pontiac, MI | 2.0 | 1.0 | 1114 | $1,150 | $1.03 | 24d | 1 | 0.73mi |
| 489 Central Ave Pontiac, MI | 2.0 | 1.0 | 1140 | $1,195 | $1.05 | 4d | 1 | 1.05mi |
| 188 Vernon Dr Pontiac, MI | 3.0 | 1.0 | 1100 | $1,500 | $1.36 | 24d | 1 | 1.06mi |
| 49 Oakhill St Pontiac, MI | 3.0 | 1.0 | 1200 | $1,575 | $1.31 | 24d | 1 | 1.07mi |
| 442 Central Ave Pontiac, MI | 2.0 | 1.0 | 1500 | $1,250 | $0.83 | 16d | 1 | 1.08mi |
| 442 Central Ave Unit 1 Pontiac, MI | 2.0 | 1.0 | 1500 | $1,500 | $1.00 | 4d | 1 | 1.08mi |
| 264 Nelson St Pontiac, MI | 3.0 | 1.0 | 1478 | $1,590 | $1.08 | 43d | 1 | 1.34mi |
| 90 Marquette St Pontiac, MI | 3.0 | 1.0 | 1886 | $1,800 | $0.95 | 43d | 1 | 1.42mi |
Listing history 7 events
-
2025-10-11status Pending
-
2025-10-10historical
-
2025-07-11status Pending 371-char remark
Show marketing remark (371 chars)
CASH OR REHAB LOAN ONLY. GREAT CHANCE FOR INVESTORS TO BRING THIS HOME BACK TO LIFE. 2 BEDROOM AND BASEMENT OPEN LIVING ROOM ROOM KITCHEN AREA MAKE THIS A GREAT HOUSE FOR A NEW FAMILY OR A RENTAL. LESS THAN 5 MIN TO FREEWAY. ALL OFFERS SUBJECT TO PROBATE COURT APPROVAL. MULTIPLE OFFER ARE NOW IN. * * * * * * * HIGHEST AND BEST BY 07/11 AT 1PM. * * * * * * *
-
2025-07-11status Pending
Show marketing remark (371 chars)
CASH OR REHAB LOAN ONLY. GREAT CHANCE FOR INVESTORS TO BRING THIS HOME BACK TO LIFE. 2 BEDROOM AND BASEMENT OPEN LIVING ROOM ROOM KITCHEN AREA MAKE THIS A GREAT HOUSE FOR A NEW FAMILY OR A RENTAL. LESS THAN 5 MIN TO FREEWAY. ALL OFFERS SUBJECT TO PROBATE COURT APPROVAL. MULTIPLE OFFER ARE NOW IN. * * * * * * * HIGHEST AND BEST BY 07/11 AT 1PM. * * * * * * *
-
2025-07-10$50,000 Active 371-char remark
Show marketing remark (371 chars)
CASH OR REHAB LOAN ONLY. GREAT CHANCE FOR INVESTORS TO BRING THIS HOME BACK TO LIFE. 2 BEDROOM AND BASEMENT OPEN LIVING ROOM ROOM KITCHEN AREA MAKE THIS A GREAT HOUSE FOR A NEW FAMILY OR A RENTAL. LESS THAN 5 MIN TO FREEWAY. ALL OFFERS SUBJECT TO PROBATE COURT APPROVAL. MULTIPLE OFFER ARE NOW IN. * * * * * * * HIGHEST AND BEST BY 07/11 AT 1PM. * * * * * * *
-
2025-07-10$50,000 Active
Show marketing remark (371 chars)
CASH OR REHAB LOAN ONLY. GREAT CHANCE FOR INVESTORS TO BRING THIS HOME BACK TO LIFE. 2 BEDROOM AND BASEMENT OPEN LIVING ROOM ROOM KITCHEN AREA MAKE THIS A GREAT HOUSE FOR A NEW FAMILY OR A RENTAL. LESS THAN 5 MIN TO FREEWAY. ALL OFFERS SUBJECT TO PROBATE COURT APPROVAL. MULTIPLE OFFER ARE NOW IN. * * * * * * * HIGHEST AND BEST BY 07/11 AT 1PM. * * * * * * *
-
2025-07-08historical $50,000 371-char remark
Show marketing remark (371 chars)
CASH OR REHAB LOAN ONLY. GREAT CHANCE FOR INVESTORS TO BRING THIS HOME BACK TO LIFE. 2 BEDROOM AND BASEMENT OPEN LIVING ROOM ROOM KITCHEN AREA MAKE THIS A GREAT HOUSE FOR A NEW FAMILY OR A RENTAL. LESS THAN 5 MIN TO FREEWAY. ALL OFFERS SUBJECT TO PROBATE COURT APPROVAL. MULTIPLE OFFER ARE NOW IN. * * * * * * * HIGHEST AND BEST BY 07/11 AT 1PM. * * * * * * *
ⓘ Source: listings_history table (triggers on properties + properties_extension) + one-shot
backfill from property_details.listing_events for pre-trigger history.
Tax reassessment forecast MI · Partial reset (capped growth)
- Current annual tax
- $1,650 · $138/mo
- Projected year-2 tax
- $1,650 · $138/mo
- Expected delta
- $0/yr ($0/mo · -0.0%)
ⓘ Screening estimate from a state-policy table — verify with the county assessor before closing.
Climate risk First Street
- Flood 1/10 Low FEMA zone X (unshaded) · 0% chance over 30 yrs
- Wildfire 1/10 Low
- Heat 2/10 Low 7 d/yr ≥96°F today · 15 d/yr by 30 yrs out
- Wind 2/10 Low
- Air quality 3/10 Moderate 2 unhealthy d/yr today · 4 by 30 yrs out
Nearby sold comps map
Loading sold comps map…
Walkable amenities ~0.75 mi
Loading nearby amenities…
Taxation est. · year 1
- Rental income
- $16,680
- − Mortgage interest
- −$2,801
- − Property taxes
- −$1,650
- − Insurance
- −$250
- − Repairs & maintenance
- −$1,334
- − Management
- −$1,334
- − Depreciation
- −$1,455
- Taxable income
- $7,856
- Est. tax owed @ 24.0%
- −$1,885
- After-tax cash flow
- $6,245/yr
For passive investors: Depreciation is non-cash, so a rental often shows a tax loss while cash-flowing — sheltering income. Rental losses are passive: they offset passive income freely, and up to $25,000/yr can offset ordinary (W-2) income if you actively participate and your MAGI is under $100k (phasing out to $0 by $150k); unused losses carry forward. On sale, claimed depreciation is recaptured at up to 25%, and gains may owe capital-gains tax (a 1031 exchange can defer both). Figures are a year-1 estimate at your 24.0% rate — not tax advice; consult a CPA.
Schools (NCES district)
- District
- Pontiac City School District
- NCES district ID
- 2628740
- Math proficiency
- 8% ▼ -5.00%
- Reading proficiency
- 17% ▼ -3.00%
- Median HH income
- $33,888
- Composite
- 10.12/100
- National rank
- #9802
- State rank
- #514 of 540 in MI
Livability — Pontiac
- Score
- 64/100
- State rank
- #499
- US rank
- #14703
Category grades
Schools grade is shown separately in the Schools card above.
Census & demographics
- Census place
- Pontiac, MI
- City population
- 44,593
- Population (ZIP)
- 17,227
Population outlook (Oakland County) Hauer SSP2
- Today (2025)
- 1,335,747 people
- By 2030
- 1,375,100 · +2.9%
- By 2040
- 1,435,385 · +7.5%
- By 2050
- 1,469,250 · +10.0%
- By 2075
- 1,531,946 · +14.7%
- By 2100
- 1,450,485 · +8.6%
Race, ethnicity, and origin ACS 2023
- Neighborhood character
- Diverse neighborhood (Simpson 0.62)
- Race & ethnicity
- Black 57% Hispanic / Latino 19% White 13% Two or more races 13% Asian 4%
- Hispanic origin (detail)
- Mexican 11% Puerto Rican 2%
- Common ancestry
- Romanian 1% Lithuanian 1% Italian 1%
- Foreign-born
- 10% · Canada, Vietnam
- Languages at home
- 79% English-only · Spanish 15% Other Asian/Pacific 4% Other Indo-European 1%
Political lean MEDSL · Oakland
- 2024 margin
- D (+10.6) · D 54.4% · R 43.8% · Other 1.9%
- 2008→2024 swing
- -3.9pp toward R · 2008: 14.5pp · 2024: 10.6pp
- All cycles
- 2024: D+10.6 2020: D+14.1 2016: D+8.1 2012: D+8.1 2008: D+14.5
Not yet ingested
- Civics
- —
Market trends
- HPI YoY
- ▼ -109.18%
- Current HPI
- 214.3258
- Rent YoY
- —
- Metro
- —
- State GDP YoY
- ▲ 1.37%
- F500 in state
- 28
Industry mix (Fortune 500 HQ in MI)
| Industry | F500 HQs | Revenue |
|---|---|---|
| Automotive Parts | 3 | $48B |
|
||
| Automotive | 2 | $372B |
|
||
| Chemicals | 1 | $45B |
|
||
| Automotive Retail | 1 | $29B |
|
||
| Healthcare / Medical Devices | 1 | $23B |
|
||
| Automotive Technology | 1 | $20B |
|
||
Price history
+0.0% since first listed7 events — show timeline
- 2025-10-11 Pending — REALCOMP
- 2025-10-10 Listing Removed — REALCOMP
- 2025-07-11 Pending — MiRealSource-MiMLS
- 2025-07-11 Pending — REALCOMP
- 2025-07-10 Listed $50,000 MiRealSource-MiMLS
- 2025-07-10 Listed $50,000 REALCOMP
- 2025-07-08 Coming Soon $50,000 MiRealSource-MiMLS
Property tax history
+2.4%/yrLatest (2025): $1,650 · +2.1% YoY. Source: county tax records.
Cash-flow waterfall
monthlySold comps — $/sqft
last 12 mo · ≤1 miLoading sold comps…