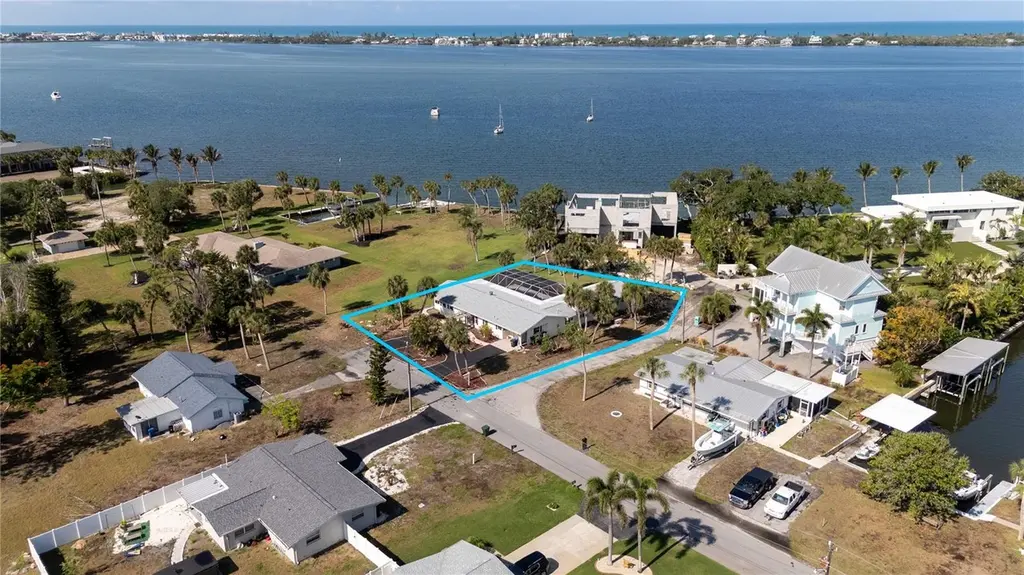
316 S Mango St · Englewood, FL
Flood risk 10/10 · Severe
- FEMA flood zone
- AE
- Chance of flooding over 30 yrs
- 0.99%
- Est. flood insurance / yr
- $1,737 – $8,500
Fire risk 1/10 · Minimal
- Est. fire insurance / yr
- $947 – $1,759
Heat risk 10/10 · Severe
- Hot days now (above 107°F)
- 7 days/yr
- Hot days in 30 yrs
- 28 days/yr
Wind risk 10/10 · Severe
- Chance of severe wind over 30 yrs
- 99.0%
Air-quality risk 3/10 · Minor
- Unhealthy air days now
- 2 days/yr
- Unhealthy air days in 30 yrs
- 2 days/yr
Risk factors via First Street. Map © Google.
Why this score? — see what drove the D grade
The composite is a weighted blend of 9 inputs, each scored 0–100. Each bar is that input's sub-score; the figure is the points it added to the 100-point composite (weight × sub-score).
- ARV discount +15.0/15.0
- Cash flow +8.5/30.0
- Schools +5.4/10.0
- Rent growth +4.8/5.0
- Livability +3.7/5.0
- Condition / age +2.5/5.0
- DSCR +2.3/10.0
- 1% rule +1.6/10.0
- Appreciation +0.0/10.0
$565,000
🖨 Deal sheet 📄 Offer letter ✓ Due diligence
Listing remarks
Wake up to sweeping Bay views from the primary suite and step out to a pool deck that takes full advantage of them. This sprawling single-story sits on a generous lot with direct sightlines to the water, palm-lined grounds, and a fully screened lanai built around a free-form pool and spa, the kind of backyard you plan your day around. Inside the main home you'll find an open layout with fresh flooring throughout, a renovated kitchen with granite counters and a center island, a spacious living room that opens to the pool through wall-to-wall sliders, and a primary bedroom positioned to soak in the Bay views the moment you open your eyes. The standout feature is the attached in-law suite, a t
Key facts
- Renovated kitchen
- Fully screened lanai
- Bay views
Tags
Property features AI
Finance
- Other: Zoned RSF2; Lot approximately 0.35 acres (1/4 to less than 1/2 acre); Bay/harbor full water view
- Financial info: Homestead exemption indicated
- HOA & community: No HOA/association
Exterior
- Parking: Attached 2-car garage (15 x 32)
- Utilities: Public water; Public sewer; Cable connected; Water and sewer connected
- Home design: Single-family residence; One-story; East-facing
- Construction: Block construction; Shingle roof; Slab foundation; Built as completed (existing property)
- Exterior features: Porch and rear porch; Outdoor shower; Sliding doors; In-ground private pool; Asphalt road access
Interior
- Kitchen: No appliances included
- Bedrooms: 3 bedrooms
- Flooring: Ceramic tile
- Bathrooms: 2 full bathrooms; 1 half bathroom
- Heating & cooling: Central heating (electric); Central air conditioning
- Interior features: Open floorplan; Wood-burning fireplace
- Laundry & utility: Laundry inside
Neighborhood map
What this means for you Summary
Snapshot
- This is a 3-bed/2.5-bath single-family listed at $565k.
Deal economics
- At list price, monthly cash flow is $-926 ($-11k/yr) — negative.
- To cash-flow at today's rent, offer at most $401k (28.9% below list).
- To meet the 1% rule (rent ≥ 1% of price), the offer needs to be $373k (33.9% below list).
- Recommended offer: $373k (33.9% below list) — sets the bar for 1% rule.
- Cap rate 5.2% vs local median 3.8% in Englewood — top-decile yield for the area; either an underpriced asset or a hidden risk that comps aren't pricing in. Stress-test before assuming the spread holds.
Location & tenants
- Location reads 73/100 on livability (#321 in FL) — a middle-class / working-renter tenant base. Strengths: housing A+, cost of living A, health & safety A; Watch: employment C-, amenities F, commute F.
- Sarasota (urban): math 63% / reading 63% proficiency, ranked #7 of 73 in FL (top 10%) — acceptable for families but not a draw, mixed tenant base, ~2y average lease.
- Market conditions: Rents rising fast (+9.0%/yr); 717 active listings in the ZIP; 4 comparable units currently listed for rent nearby; rentals at typical pace (median 21d on market — plan ~3-4 weeks tenant-placement turnaround); solid renter incomes; 7,466 units permitted in Sarasota County in 2024 (2,138 in 5+ unit buildings).
- At $3,733/mo this rent would consume 59% of the median local household income ($76k/yr) (locally 290% of renters already pay >50% of income on rent) — very limited rent-growth headroom before tenants either downsize or default.
Forward outlook
- Local home prices are declining (-3.0%/yr); year-one equity from $4k of loan paydown is wiped out by about $17k of value loss. Plan a longer hold.
- Sarasota County population projected at +20% by 2050 — long-run rental-demand tailwind backs the buy-and-hold thesis.
Negotiation context
- It's been on market 37 days — a 3% lower offer ($548k) is reasonable based on typical stale-listing flexibility.
- Current owner paid $20k; list at $565k implies a 2797% gain — meaningful room to come down on a strong offer.
Risks & watch-outs
- Watch-outs: flood insurance adds $427/mo; built in 1956 — expect roof / HVAC / electrical / plumbing capex.
- Climate carrying-cost: in FEMA flood zone AE (mandatory federal flood insurance); severe wind risk, 99% chance of damaging wind over 30y; extreme-heat days projected 7→28/yr by 2055 (HVAC capex compounding) — expect insurance premiums to compound above CPI over the hold.
Questions for the listing agent
- What do current leases actually rent for vs. the listed asking? Can we see a recent rent roll and the last 12 months of T-12 income?
- It's been on market 37 days. Have you received any prior offers? Is the seller open to a 34% concession, seller financing, or rate buy-down credit?
- Built in 1956 — when were the roof, HVAC, electrical panel, plumbing, and water heater last replaced?
- What's the actual annual flood-insurance premium (NFIP or private), and is the property in a SFHA with mandatory coverage?
- Is there a deadline driving the sale (1031 exchange, divorce, estate, relocation)? That informs how much negotiation room exists.
- Schools are A-rated — typically a magnet for longer-tenancy family renters. What's the average tenant stay here, and is there a school-zone premium baked into asking?
- The area grade is low — what's the realistic commute time and amenity access for the typical tenant pool here? Any planned neighborhood developments (good or bad) we should know about?
- What's the average days-on-market for RENTAL listings here right now (not sales)? A rising rental-DOM trend means longer vacancies and softer asking-rent achievability than the comps imply.
- What's the recent tenant-quality profile in this submarket — average credit score on applications, eviction rate, late-payment / NSF rate, and stable-employment percentage? A property-management company in the area should have these aggregated.
- How much new for-sale + rental construction is in the pipeline within 1–3 miles? Heavy new supply typically softens prices + rents 12–24 months out; constrained supply supports both.
Investment metrics
- 1% rule
- 0.66% ✗
- Cap rate
- 5.23%
- Cash-on-cash
- -3.79%
- DSCR
- 0.83
- GRM
- 12.6
CMA / ARV
- ARV (median comp)
- $937,914
- List price
- $565,000
- Delta
- -39.76%
- Verdict
- UNDERPRICED
- Comps
- 12 within 2.0 mi
Projected returns pro-forma
-3.0% appreciation · 8.0% rent growth · sell at horizon
- IRR
- -23.2%
- Equity multiple
- 0.17×
- Total profit
- $-130,757
- Equity at exit
- $84,243
- IRR
- -8.4%
- Equity multiple
- 0.37×
- Total profit
- $-99,842
- Equity at exit
- $48,851
Cash invested: $158,200 (down + closing). Projections, not guarantees.
Landlord ↔ Tenant lean methodology
- Overall (STATE)
- 87 Strongly Landlord-Friendly
- State Florida
- 87 Strongly Landlord-Friendly · R+3
- County
- — inherits STATE
- City
- — inherits STATE
ZIP-level market 34223
- Home prices YoY
- -34.2%
- Rents YoY
- 9.0%
- Active inventory
- 717
- Price-to-rent
- 12.6×
Monthly cashflow live
- Estimated rent
- $3,733 medium interval (Pro) →
- Mortgage (P&I)
- −$2,963
- Tax from tax record
- −$250 /mo · $3,003/yr
- Insurance
- −$235
- Flood insurance flood zone
- −$427 /mo · $5,118/yr
- HOA
- −$0
- Vacancy / Maint / Mgmt
- −$784
- Net cashflow
- $-926
Break-even live
UW: 25.0% down · 7.5% · 30yr · 1.5% tax · 5.0% vac · 8.0% maint · 8.0% mgmt
Financing live
Cash to close
- Down payment
- $141,250
- Closing costs
- $16,950
- Reserves months
- —
- Total cash needed
- —
Loan-product check · same deal, 3 products live
Conventional
25% down · 7.5% · 30yr
- Down + closing
- —
- Monthly P&I
- —
- Monthly cashflow
- —
- DSCR
- —
- Eligible?
- —
Personal DTI + credit; lowest rate.
DSCR
20% down · 8.5% · 30yr
- Down + closing
- —
- Monthly P&I
- —
- Monthly cashflow
- —
- DSCR
- —
- Eligible?
- —
No personal income docs; deal must DSCR.
Hard money
10% down · 12.0% · 12mo
- Down + closing
- —
- Monthly P&I
- —
- Monthly cashflow
- —
- DSCR
- —
- Eligible?
- —
Short-term bridge; refi at stabilization.
Rent comps 4 comps
| Address | Beds | Baths | Sqft | Rent | $/sqft | DOM | Units | Dist |
|---|---|---|---|---|---|---|---|---|
| 5039 N Beach Rd Englewood, FL | 4.0 | 3.0 | 1650 | $4,499 | $2.73 | 21d | 1 | 1.07mi |
| 1375 Beach Rd #311 Englewood, FL | 3.0 | 2.0 | 1686 | $4,950 | $2.94 | 21d | 1 | 1.47mi |
| 2825 N Beach Rd Englewood, FL | 3.0 | 2.0 | 1800 | $3,750 | $2.08 | 21d | 1 | 1.48mi |
| 1501 Helene Ave Englewood, FL | 3.0 | 2.0 | 1608 | $3,200 | $1.99 | 13d | 1 | 1.49mi |
Listing history 17 events
-
2026-06-18days on market $565,000 Active 37 DOM
-
2026-06-17days on market $565,000 Active 36 DOM
-
2026-06-16days on market $565,000 Active 35 DOM
-
2026-06-15days on market $565,000 Active 34 DOM
-
2026-06-13days on market $565,000 Active 32 DOM
-
2026-06-13days on market $565,000 Active 31 DOM
-
2026-06-10days on market $565,000 Active 29 DOM
-
2026-06-09days on market $565,000 Active 28 DOM
-
2026-06-08days on market $565,000 Active 27 DOM
-
2026-06-08days on market $565,000 Active 26 DOM
-
2026-06-05days on market $565,000 Active 23 DOM
-
2026-06-03days on market $565,000 Active 22 DOM
-
2026-06-02days on market $565,000 Active 21 DOM
-
2026-06-01days on market $565,000 Active 20 DOM
-
2026-05-31days on market $565,000 Active 19 DOM
-
2026-05-12$565,000 Active 1192-char remark
-
1973-04-01soldstatus $19,500
ⓘ Source: listings_history table (triggers on properties + properties_extension) + one-shot
backfill from property_details.listing_events for pre-trigger history.
Tax reassessment forecast FL · Resets to sale price
- Current annual tax
- $3,003 · $250/mo
- Projected year-2 tax
- $4,690 · $391/mo
- Expected delta
- +$1,686/yr (+$141/mo · 56.1%)
ⓘ Screening estimate from a state-policy table — verify with the county assessor before closing.
Climate risk First Street
- Flood 10/10 Extreme FEMA zone AE · 99% chance over 30 yrs
- Wildfire 1/10 Low
- Heat 10/10 Extreme 7 d/yr ≥107°F today · 28 d/yr by 30 yrs out
- Wind 10/10 Extreme 99% chance of damaging wind over 30 yrs
- Air quality 3/10 Moderate 2 unhealthy d/yr today · 2 by 30 yrs out
Nearby sold comps map
Loading sold comps map…
Walkable amenities ~0.75 mi
Loading nearby amenities…
Taxation est. · year 1
- Rental income
- $44,799
- − Mortgage interest
- −$31,649
- − Property taxes
- −$3,003
- − Insurance
- −$7,944
- − Repairs & maintenance
- −$3,584
- − Management
- −$3,584
- − Depreciation
- −$16,436
- Taxable loss
- −$21,401
- Est. tax savings @ 24.0%
- +$5,136
- After-tax cash flow
- $-5,974/yr
For passive investors: Depreciation is non-cash, so a rental often shows a tax loss while cash-flowing — sheltering income. Rental losses are passive: they offset passive income freely, and up to $25,000/yr can offset ordinary (W-2) income if you actively participate and your MAGI is under $100k (phasing out to $0 by $150k); unused losses carry forward. On sale, claimed depreciation is recaptured at up to 25%, and gains may owe capital-gains tax (a 1031 exchange can defer both). Figures are a year-1 estimate at your 24.0% rate — not tax advice; consult a CPA.
Schools (NCES district)
- District
- Sarasota
- NCES district ID
- 1201680
- Math proficiency
- 63% ▼ -8.00%
- Reading proficiency
- 63% ▼ -3.00%
- Median HH income
- $51,167
- Composite
- 53.68/100
- National rank
- #1428
- State rank
- #7 of 73 in FL
Livability — Englewood
- Score
- 73/100
- State rank
- #321
- US rank
- #5655
Category grades
Schools grade is shown separately in the Schools card above.
Census & demographics
- Census place
- Englewood, FL
- County
- Sarasota County · 448,376 people
- City population
- 35,420
- Metro
- North Port-Sarasota-Bradenton, FL
- Population (ZIP)
- 19,884
- Household income
- $76,016
- Rent vs Own
- Severe rent burden
- 290.0
Population outlook (Sarasota County) Hauer SSP2
- Today (2025)
- 452,380 people
- By 2030
- 474,175 · +4.8%
- By 2040
- 511,577 · +13.1%
- By 2050
- 541,467 · +19.7%
- By 2075
- 604,947 · +33.7%
- By 2100
- 621,965 · +37.5%
Race, ethnicity, and origin ACS 2023
- Neighborhood character
- Predominantly White (94%)
- Race & ethnicity
- White 94% Two or more races 3% Hispanic / Latino 3% Asian 1%
- Common ancestry
- Romanian 7% Lithuanian 4% Iranian 2%
- Foreign-born
- 9% · Canada
- Languages at home
- 94% English-only · German/W. Germanic 2% Spanish 1% Other Indo-European 1%
Political lean MEDSL · Sarasota
- 2024 margin
- R (+18.2) · D 40.5% · R 58.7%
- 2008→2024 swing
- -18.1pp toward R · 2008: -0.1pp · 2024: -18.2pp
- All cycles
- 2024: R+18.2 2020: R+10.4 2016: R+11.6 2012: R+7.4 2008: R+0.1
Not yet ingested
- Civics
- —
Market trends
- HPI YoY
- ▼ -146.26%
- Current HPI
- 281.0529
- Rent YoY
- ▲ 9.02%
- Metro
- North Port-Sarasota-Bradenton, FL
- State GDP YoY
- ▲ 3.28%
- F500 in state
- 36
Industry mix (Fortune 500 HQ in FL)
| Industry | F500 HQs | Revenue |
|---|---|---|
| Industrial Technology | 2 | $29B |
|
||
| Insurance | 2 | $17B |
|
||
| Retail | 1 | $60B |
|
||
| Technology Distribution | 1 | $58B |
|
||
| Homebuilding | 1 | $35B |
|
||
| Technology Manufacturing | 1 | $35B |
|
||
Price history
+2797.4% since first listed2 events — show timeline
- 2026-05-12 Listed $565,000 Stellar MLS as Distributed by MLS Grid
- 1973-04-01 Sold (Public Records) $19,500 Public Records
Property tax history
+3.7%/yrLatest (2025): $3,003 · +3.5% YoY. Source: county tax records.
Cash-flow waterfall
monthlySold comps — $/sqft
last 12 mo · ≤1 miLoading sold comps…