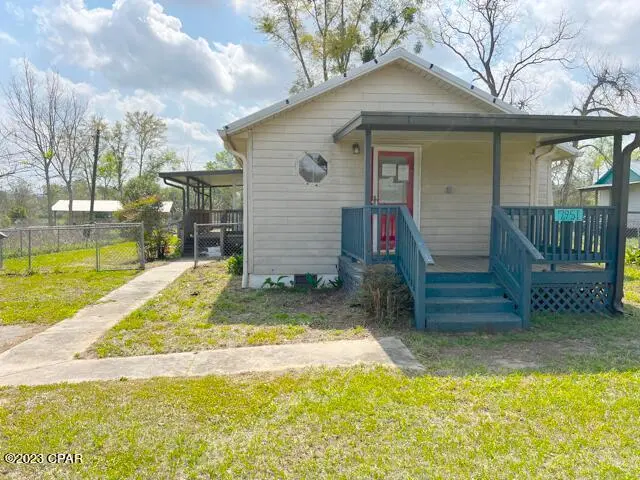
7951 Old Spanish · Sneads, FL
Flood risk 1/10 · Minimal
- FEMA flood zone
- X (unshaded)
- Chance of flooding over 30 yrs
- 0.0%
- Est. flood insurance / yr
- $507 – $1,088
Fire risk 4/10 · Minor
- Est. fire insurance / yr
- $947 – $1,759
Heat risk 8/10 · Major
- Hot days now (above 109°F)
- 7 days/yr
- Hot days in 30 yrs
- 19 days/yr
Wind risk 9/10 · Severe
- Chance of severe wind over 30 yrs
- 99.0%
Air-quality risk 4/10 · Minor
- Unhealthy air days now
- 4 days/yr
- Unhealthy air days in 30 yrs
- 6 days/yr
Risk factors via First Street. Map © Google.
Why this score? — see what drove the B grade
The composite is a weighted blend of 9 inputs, each scored 0–100. Each bar is that input's sub-score; the figure is the points it added to the 100-point composite (weight × sub-score).
- Cash flow +30.0/30.0
- 1% rule +10.0/10.0
- DSCR +10.0/10.0
- ARV discount +6.0/15.0
- Appreciation +5.1/10.0
- Schools +4.2/10.0
- Livability +3.2/5.0
- Rent growth +2.5/5.0
- Condition / age +2.5/5.0
$59,000
🖨 Deal sheet 📄 Offer letter ✓ Due diligence
Listing remarks
CREATIVE OPTIONS AVAILABLE! Very convenient location. Amazing opportunity for Investors. Flooring needs work. HVAC 2019. Fix and flip or buy and hold. Seller will be taking the stove and the fridge. Excellent return! Ready to sell now! This is an opportunity you won't want to miss!
Key facts
- Generous yard space
- Serene neighborhood
- 0.28 acre lot
Tags
Property features AI
Finance
- HOA & community: Short-term rentals allowed
Exterior
- Utilities: Electricity available
- Home design: Single-story property; Metal roof; Vinyl siding with wood frame construction
- Construction: Built with wood frame and vinyl siding; Metal roof
- Exterior features: Deck; Balcony; Covered and open porch
Interior
- Bedrooms: Two bedrooms on the first level; One additional room on the first level (other)
- Bathrooms: Two full bathrooms; One half bathroom
- Heating & cooling: Central heating (electric, forced air); Central air conditioning
- Interior features: Ceiling fans
Neighborhood map
What this means for you Summary
Snapshot
- This is a 3-bed/3.0-bath single-family listed at $59k.
Deal economics
- At list price, monthly cash flow is $533 ($6k/yr) — positive.
- The deal already cash-flows at list — no discount required.
- Meets the 1% rule at list price ($1k rent vs $59k).
- Recommended offer: $58k (1.5% below list) — sets the bar for market timing.
Location & tenants
- Location reads 64/100 on livability (#682 in FL) — a middle-class / working-renter tenant base. Strengths: crime A+, cost of living A+, housing A; Watch: amenities F, commute F, employment F.
- Jackson (rural): math 47% / reading 54% proficiency, ranked #39 of 73 in FL (top 53%) — acceptable for families but not a draw, mixed tenant base, ~2y average lease.
- Market conditions: 36 active listings in the ZIP; 1 comparable units currently listed for rent nearby; 153 units permitted in Jackson County in 2024 (40 in 5+ unit buildings).
Forward outlook
- In year one you build about $526 of equity ($408 loan paydown + $118 appreciation (0.2% local appreciation)).
- Jackson County population projected at -18% by 2050 — secular population decline; favor cash flow + early exit over multi-decade hold.
- At projected returns (0.2% appreciation + 3.0% rent growth), your $17k cash investment doubles in ~3 years — after that, you're playing with house money.
Negotiation context
- It's been on market 21 days — a 2% lower offer ($58k) is reasonable based on typical stale-listing flexibility.
- 12 sale attempts since 9y ago; this cycle's ask has dropped $30k (34%) from the opening price — seller is motivated, your offer sets the floor, not the list.
Risks & watch-outs
- Watch-outs: property tax is 4.0% of price.
- Climate carrying-cost: severe wind risk, 99% chance of damaging wind over 30y; extreme-heat days projected 7→19/yr by 2055 (HVAC capex compounding) — expect insurance premiums to compound above CPI over the hold.
Questions for the listing agent
- Property tax is high relative to price — has the assessment been appealed recently, and will the sale trigger a re-assessment?
- Is there a deadline driving the sale (1031 exchange, divorce, estate, relocation)? That informs how much negotiation room exists.
- Schools are B-rated — typically a magnet for longer-tenancy family renters. What's the average tenant stay here, and is there a school-zone premium baked into asking?
- What's the average days-on-market for RENTAL listings here right now (not sales)? A rising rental-DOM trend means longer vacancies and softer asking-rent achievability than the comps imply.
- What's the recent tenant-quality profile in this submarket — average credit score on applications, eviction rate, late-payment / NSF rate, and stable-employment percentage? A property-management company in the area should have these aggregated.
- How much new for-sale + rental construction is in the pipeline within 1–3 miles? Heavy new supply typically softens prices + rents 12–24 months out; constrained supply supports both.
Investment metrics
- 1% rule
- 2.28% ✓
- Cap rate
- 17.14%
- Cash-on-cash
- 38.75%
- DSCR
- 2.72
- GRM
- 3.7
CMA / ARV
- ARV (on-the-fly)
- $57,072
- Comps found
- 5
Show comp detail 5 sales within ~0.75 mi
| Address | Dist | Beds/Ba | Sqft | Sold | Price | $/sf | Match |
|---|---|---|---|---|---|---|---|
| 7951 Old Spanish Trl | 0.00mi | 3/2.5 | 1,392 (0%) | 18mo | $54,499 | $39 | 83 |
| 7972 Old Spanish Trl | 0.11mi | 2/2.0 (-1) | 1,256 (-10%) | 9mo | $51,500 | $41 | 63 |
| 8054 Highway 90 | 0.59mi | 3/1.0 | 1,391 (-0%) | 18mo | $103,000 | $74 | 49 |
| 7851 Jenkins St | 0.61mi | 2/2.0 (-1) | 1,328 (-5%) | 8mo | $172,000 | $130 | 48 |
| 2006 3rd Ave | 0.73mi | 3/1.0 | 1,418 (+2%) | 21mo | $58,000 | $41 | 37 |
Match score weights: distance 35% · size 25% · config 20% · recency 20%. Top-matched comps best support the ARV.
Projected returns pro-forma
0.2% appreciation · 3.0% rent growth · sell at horizon
- IRR
- 40.1%
- Equity multiple
- 2.99×
- Total profit
- $32,897
- Equity at exit
- $17,723
- IRR
- 43.0%
- Equity multiple
- 5.91×
- Total profit
- $81,150
- Equity at exit
- $21,782
Cash invested: $16,520 (down + closing). Projections, not guarantees.
Landlord ↔ Tenant lean methodology
- Overall (STATE)
- 87 Strongly Landlord-Friendly
- State Florida
- 87 Strongly Landlord-Friendly · R+3
- County
- — inherits STATE
- City
- — inherits STATE
ZIP-level market 32460
- Home prices YoY
- 0.1%
- Active inventory
- 36
- Price-to-rent
- 3.7×
Monthly cashflow live
- Estimated rent
- $1,345 medium interval (Pro) →
- Mortgage (P&I)
- −$309
- Tax from tax record
- −$195 /mo · $2,342/yr
- Insurance
- −$25
- HOA
- −$0
- Vacancy / Maint / Mgmt
- −$282
- Net cashflow
- $533
Break-even live
UW: 25.0% down · 7.5% · 30yr · 1.5% tax · 5.0% vac · 8.0% maint · 8.0% mgmt
Financing live
Cash to close
- Down payment
- $14,750
- Closing costs
- $1,770
- Reserves months
- —
- Total cash needed
- —
Loan-product check · same deal, 3 products live
Conventional
25% down · 7.5% · 30yr
- Down + closing
- —
- Monthly P&I
- —
- Monthly cashflow
- —
- DSCR
- —
- Eligible?
- —
Personal DTI + credit; lowest rate.
DSCR
20% down · 8.5% · 30yr
- Down + closing
- —
- Monthly P&I
- —
- Monthly cashflow
- —
- DSCR
- —
- Eligible?
- —
No personal income docs; deal must DSCR.
Hard money
10% down · 12.0% · 12mo
- Down + closing
- —
- Monthly P&I
- —
- Monthly cashflow
- —
- DSCR
- —
- Eligible?
- —
Short-term bridge; refi at stabilization.
Rent comps 1 comps
| Address | Beds | Baths | Sqft | Rent | $/sqft | DOM | Units | Dist |
|---|---|---|---|---|---|---|---|---|
| 2057 Gay Ave Sneads, FL | 3.0 | 2.0 | 1736 | $1,345 | $0.77 | 43d | 1 | 0.62mi |
Listing history 39 events
-
2026-05-13status Pending
-
2026-05-11price $59,000
-
2026-05-05price $64,000
-
2026-05-04price $69,000
-
2026-05-04price $79,000
-
2026-04-27price $87,000
-
2026-04-22$89,000 Active
-
2026-04-14historical
-
2026-04-14price $115,000
-
2026-03-25status Active
-
2026-03-17status Pending
-
2026-02-24$165,000 Active
-
2025-10-31$170,000 Active
-
2024-12-19soldstatus $54,500
-
2024-12-18soldstatus $54,499 Closed
-
2024-11-30status Pending
-
2024-09-30status Active
-
2024-09-27status Pending
-
2024-09-04price $66,100
-
2024-08-25price $56,100
-
2024-07-30price $66,100
-
2024-07-26status Active
-
2024-07-24status Pending
-
2024-07-17status Active
-
2024-07-03status Pending
-
2024-06-24status Active
-
2024-05-31status Pending
-
2024-05-08price $73,450
-
2024-03-19status Active
-
2024-03-06status Pending
-
2024-01-30price $81,600
-
2023-11-16price $102,000
-
2023-10-11status Active
-
2023-09-30historical
-
2023-03-30$120,000 Active
-
2018-06-04soldstatus $69,900
-
2018-06-04soldstatus $69,900
-
2017-10-16$69,900
-
2005-06-28soldstatus $78,000
ⓘ Source: listings_history table (triggers on properties + properties_extension) + one-shot
backfill from property_details.listing_events for pre-trigger history.
Tax reassessment forecast FL · Resets to sale price
- Current annual tax
- $2,342 · $195/mo
- Projected year-2 tax
- $2,342 · $195/mo
- Expected delta
- $0/yr ($0/mo · 0.0%)
ⓘ Screening estimate from a state-policy table — verify with the county assessor before closing.
Climate risk First Street
- Flood 1/10 Low FEMA zone X (unshaded) · 0% chance over 30 yrs
- Wildfire 4/10 Moderate
- Heat 8/10 Severe 7 d/yr ≥109°F today · 19 d/yr by 30 yrs out
- Wind 9/10 Extreme 99% chance of damaging wind over 30 yrs
- Air quality 4/10 Moderate 4 unhealthy d/yr today · 6 by 30 yrs out
Nearby sold comps map
Loading sold comps map…
Walkable amenities ~0.75 mi
Loading nearby amenities…
Taxation est. · year 1
- Rental income
- $16,140
- − Mortgage interest
- −$3,305
- − Property taxes
- −$2,342
- − Insurance
- −$295
- − Repairs & maintenance
- −$1,291
- − Management
- −$1,291
- − Depreciation
- −$1,716
- Taxable income
- $5,899
- Est. tax owed @ 24.0%
- −$1,416
- After-tax cash flow
- $4,985/yr
For passive investors: Depreciation is non-cash, so a rental often shows a tax loss while cash-flowing — sheltering income. Rental losses are passive: they offset passive income freely, and up to $25,000/yr can offset ordinary (W-2) income if you actively participate and your MAGI is under $100k (phasing out to $0 by $150k); unused losses carry forward. On sale, claimed depreciation is recaptured at up to 25%, and gains may owe capital-gains tax (a 1031 exchange can defer both). Figures are a year-1 estimate at your 24.0% rate — not tax advice; consult a CPA.
Schools (NCES district)
- District
- Jackson
- NCES district ID
- 1200960
- Math proficiency
- 47% ▼ -9.00%
- Reading proficiency
- 54% ▼ -3.00%
- Median HH income
- $36,824
- Composite
- 41.92/100
- National rank
- #3358
- State rank
- #39 of 73 in FL
Livability — Sneads
- Score
- 64/100
- State rank
- #682
- US rank
- #14148
Category grades
Schools grade is shown separately in the Schools card above.
Census & demographics
- Census place
- Sneads, FL
- Population (ZIP)
- 5,303
Population outlook (Jackson County) Hauer SSP2
- Today (2025)
- 46,095 people
- By 2030
- 44,432 · -3.6%
- By 2040
- 41,077 · -10.9%
- By 2050
- 37,587 · -18.5%
- By 2075
- 28,921 · -37.3%
- By 2100
- 19,332 · -58.1%
Race, ethnicity, and origin ACS 2023
- Neighborhood character
- Diverse neighborhood (Simpson 0.59)
- Race & ethnicity
- White 57% Black 28% Hispanic / Latino 7% Two or more races 6% Asian 2%
- Hispanic origin (detail)
- Mexican 2% Puerto Rican 2%
- Common ancestry
- Lithuanian 3% Italian 2% Hispanic 1%
- Foreign-born
- 4% · Canada
- Languages at home
- 88% English-only · Spanish 7% Other Indo-European 2% French/Haitian/Cajun 1%
Political lean MEDSL · Jackson
- 2024 margin
- Solid R (+46.1) · D 26.7% · R 72.7%
- 2008→2024 swing
- -18.0pp toward R · 2008: -28.0pp · 2024: -46.1pp
- All cycles
- 2024: R+46.1 2020: R+38.9 2016: R+37.4 2012: R+29.0 2008: R+28.0
Not yet ingested
- Civics
- —
Market trends
- HPI YoY
- ▲ 0.20%
- Current HPI
- 154.5563
- Rent YoY
- —
- Metro
- —
- State GDP YoY
- ▲ 3.28%
- F500 in state
- 36
Industry mix (Fortune 500 HQ in FL)
| Industry | F500 HQs | Revenue |
|---|---|---|
| Industrial Technology | 2 | $29B |
|
||
| Insurance | 2 | $17B |
|
||
| Retail | 1 | $60B |
|
||
| Technology Distribution | 1 | $58B |
|
||
| Homebuilding | 1 | $35B |
|
||
| Technology Manufacturing | 1 | $35B |
|
||
Price history
-24.4% since first listed39 events — show timeline
- 2026-05-13 Pending — CPARMLS
- 2026-05-11 Price Changed $59,000 CPARMLS
- 2026-05-05 Price Changed $64,000 CPARMLS
- 2026-05-04 Price Changed $69,000 CPARMLS
- 2026-05-04 Price Changed $79,000 CPARMLS
- 2026-04-27 Price Changed $87,000 CPARMLS
- 2026-04-22 Listed $89,000 CPARMLS
- 2026-04-14 Listing Removed — CPARMLS
- 2026-04-14 Price Changed $115,000 CPARMLS
- 2026-03-25 Relisted — CPARMLS
- 2026-03-17 Pending — CPARMLS
- 2026-02-24 Listed $165,000 CPARMLS
- 2025-10-31 Listed $170,000 CPARMLS
- 2024-12-19 Sold (Public Records) $54,500 Public Records
- 2024-12-18 Sold (MLS) $54,499 CPARMLS
- 2024-11-30 Pending — CPARMLS
- 2024-09-30 Relisted — CPARMLS
- 2024-09-27 Pending — CPARMLS
- 2024-09-04 Price Changed $66,100 CPARMLS
- 2024-08-25 Price Changed $56,100 CPARMLS
- 2024-07-30 Price Changed $66,100 CPARMLS
- 2024-07-26 Relisted — CPARMLS
- 2024-07-24 Pending — CPARMLS
- 2024-07-17 Relisted — CPARMLS
- 2024-07-03 Pending — CPARMLS
- 2024-06-24 Relisted — CPARMLS
- 2024-05-31 Pending — CPARMLS
- 2024-05-08 Price Changed $73,450 CPARMLS
- 2024-03-19 Relisted — CPARMLS
- 2024-03-06 Pending — CPARMLS
- 2024-01-30 Price Changed $81,600 CPARMLS
- 2023-11-16 Price Changed $102,000 CPARMLS
- 2023-10-11 Relisted — CPARMLS
- 2023-09-30 Listing Removed — CPARMLS
- 2023-03-30 Listed $120,000 CPARMLS
- 2018-06-04 Sold (Public Records) $69,900 Public Records
- 2018-06-04 Sold (MLS) $69,900 CPARMLS
- 2017-10-16 Listed $69,900 CPARMLS
- 2005-06-28 Sold (Public Records) $78,000 Public Records
Property tax history
+15.1%/yrLatest (2025): $2,342 · +0.2% YoY. Source: county tax records.
Cash-flow waterfall
monthlySold comps — $/sqft
last 12 mo · ≤1 miLoading sold comps…