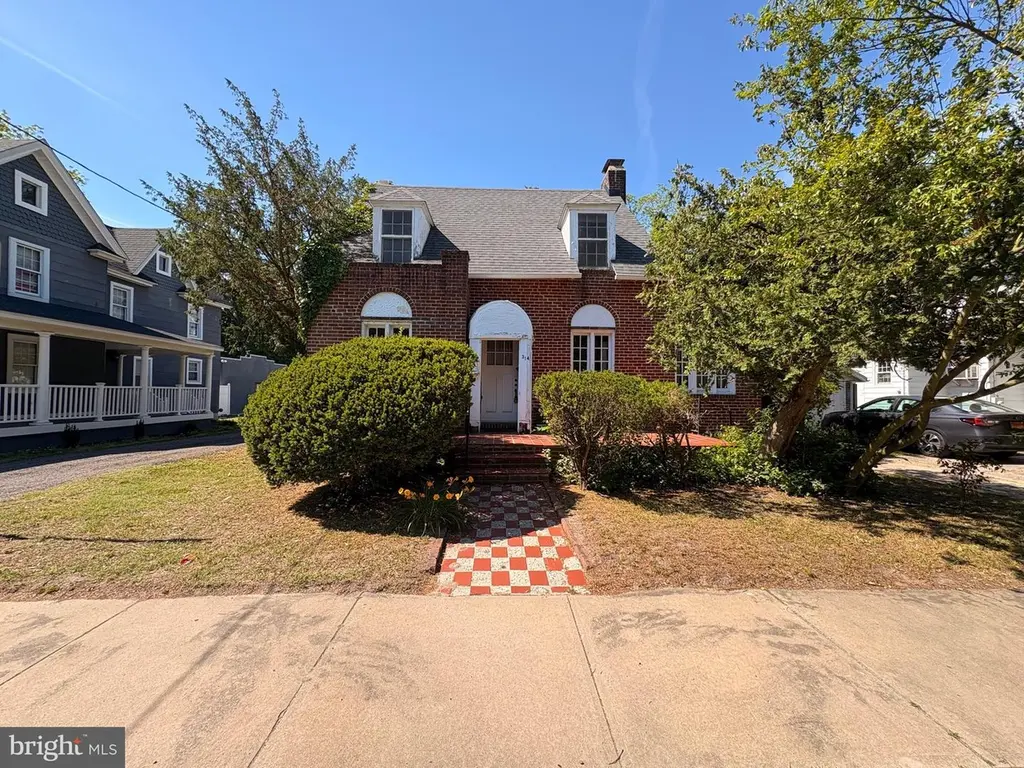
314 Hazel Ave · Salisbury, MD
Flood risk 5/10 · Moderate
- FEMA flood zone
- X (unshaded)
- Chance of flooding over 30 yrs
- 0.47%
- Est. flood insurance / yr
- $473 – $860
Fire risk 1/10 · Minimal
- Est. fire insurance / yr
- $755 – $1,403
Heat risk 8/10 · Major
- Hot days now (above 105°F)
- 7 days/yr
- Hot days in 30 yrs
- 16 days/yr
Wind risk 7/10 · Major
- Chance of severe wind over 30 yrs
- 78.0%
Air-quality risk 2/10 · Minimal
- Unhealthy air days now
- 1 days/yr
- Unhealthy air days in 30 yrs
- 2 days/yr
Risk factors via First Street. Map © Google.
Why this score? — see what drove the C grade
The composite is a weighted blend of 9 inputs, each scored 0–100. Each bar is that input's sub-score; the figure is the points it added to the 100-point composite (weight × sub-score).
- Cash flow +21.1/30.0
- ARV discount +13.0/15.0
- DSCR +6.7/10.0
- Rent growth +4.3/5.0
- 1% rule +4.2/10.0
- Livability +3.0/5.0
- Condition / age +2.5/5.0
- Schools +1.9/10.0
- Appreciation +0.0/10.0
$179,000
🖨 Deal sheet 📄 Offer letter ✓ Due diligence
Listing remarks
Step back in time with this enchanting 1935 brick Cape Cod situated in a sought-after neighborhood ideal for college rentals. This three bedroom, one bath home, retains all of its original charm with beautiful hardwood floors, detailed moldings, and elegant casement windows offering a classic, timeless character in every room. The spacious living room features a lovely brick wood-burning fireplace accented by matching sconces and a new Mitsubishi mini split ac unit for added modern comfort. An adjacent bonus room can be adapted as an office or additional bedroom, offering flexible options. The kitchen preserves its vintage charm featuring a classic sink, stove and dishwasher, along with
Key facts
- Detailed moldings
- Casement windows
- Brick cape cod
Tags
Property features AI
Exterior
- Parking: Detached garage with front and side entry and additional storage area; One garage space; Two driveway spaces; On-street parking; Concrete driveway; Shared driveway; Total of three parking spaces
- Utilities: Public water; Public sewer; Oil hot water; Municipal trash service; Electric for cooling
- Home design: Detached property; Architectural shingle roof; Brick construction; Casement and wood frame windows; Above- and below-grade structures including garage(s)
- Construction: Brick foundation (brick/mortar); Building not winterized
- Exterior features: Gutter system; Outbuilding(s); Sidewalks; Street lights; Landscaping; Not in a federal flood zone; Two or more access exits
Interior
- Kitchen: Dishwasher; Refrigerator; Stove
- Bedrooms: Three bedrooms on the upper level
- Flooring: Hardwood / solid hardwood; Tile/brick; Vinyl; Wood
- Bathrooms: One full bathroom
- Heating & cooling: Radiator heat (oil-fired); Ductless/mini-split cooling; Window unit cooling
- Interior features: Soaking tub; Breakfast area; Built-ins; Family room off kitchen; Traditional floor plan; Kitchen efficiency; Wood floors; Brick and plaster/ paneled walls and ceilings; One fireplace with brick surround and mantel
- Laundry & utility: Basement with connecting stairway and windows (unfinished)
Neighborhood map
What this means for you Summary
Snapshot
- This is a 3-bed/1.0-bath single-family listed at $179k.
Deal economics
- At list price, monthly cash flow is $254 ($3k/yr) — positive.
- The deal already cash-flows at list — no discount required.
- To meet the 1% rule (rent ≥ 1% of price), the offer needs to be $165k (7.6% below list).
- Recommended offer: $165k (7.6% below list) — sets the bar for 1% rule.
- Cap rate 8.0% vs local median 4.8% in Salisbury — top-decile yield for the area; either an underpriced asset or a hidden risk that comps aren't pricing in. Stress-test before assuming the spread holds.
Location & tenants
- Location reads 60/100 on livability (#351 in MD) — a middle-class / working-renter tenant base. Strengths: health & safety A+, cost of living A, housing A; Watch: crime F, amenities F, commute F.
- Wicomico County Public Schools (urban): math 16% / reading 26% proficiency, ranked #19 of 24 in MD (top 79%) — low school quality limits family demand, transient renter base, plan for 1-2y turnover.
- Zoned schools: Pinehurst Elementary (math 10% / reading 7%, grade F, #664 of 860 statewide, top 78%, 486 students, 60% FRL); Bennett Middle (math 13% / reading 29%, grade F, #134 of 225 statewide, top 62%, 906 students, 48% FRL); James M. Bennett High (math 55% / reading 66%, grade C+, #71 of 222 statewide, top 32%, 1,343 students, 44% FRL) — zoned schools at 50% FRL track the district average.
- Market conditions: Rents rising fast (+7.2%/yr); 190 active listings in the ZIP; 22 comparable units currently listed for rent nearby; rentals lingering (median 44d on market — plan ~5-8 weeks vacancy on turnover, expect pricing pressure); 59% of comp listings sitting > 30 days — soft ceiling on asking rent; 278 units permitted in Wicomico County in 2024 (44 in 5+ unit buildings).
Forward outlook
- Local home prices are declining (-3.0%/yr); year-one equity from $1k of loan paydown is wiped out by about $5k of value loss. Plan a longer hold.
- Wicomico County population projected at +14% by 2050 — modest demand growth; plan on rents tracking national, not racing it.
- At projected returns (-3.0% appreciation + 7.2% rent growth), your $50k cash investment doubles in ~10 years — after that, you're playing with house money.
Negotiation context
- Only 9 days on market — expect competitive offers; lowballing is unlikely to land.
Risks & watch-outs
- Watch-outs: built in 1935 — expect roof / HVAC / electrical / plumbing capex.
- Climate carrying-cost: moderate flood risk; major wind risk, 78% chance of damaging wind over 30y; extreme-heat days projected 7→16/yr by 2055 (HVAC capex compounding) — expect insurance premiums to compound above CPI over the hold.
Questions for the listing agent
- Built in 1935 — when were the roof, HVAC, electrical panel, plumbing, and water heater last replaced?
- Is there a deadline driving the sale (1031 exchange, divorce, estate, relocation)? That informs how much negotiation room exists.
- Schools are D-rated, which usually means shorter tenancies and higher turnover. Who's the typical renter profile here, and what's been the actual vacancy rate?
- Crime grade is F in this area — have there been break-ins, vandalism, or insurance claims at this property in the last 3 years? What carrier currently insures it and at what premium?
- What's the average days-on-market for RENTAL listings here right now (not sales)? A rising rental-DOM trend means longer vacancies and softer asking-rent achievability than the comps imply.
- What's the recent tenant-quality profile in this submarket — average credit score on applications, eviction rate, late-payment / NSF rate, and stable-employment percentage? A property-management company in the area should have these aggregated.
- How much new for-sale + rental construction is in the pipeline within 1–3 miles? Heavy new supply typically softens prices + rents 12–24 months out; constrained supply supports both.
Investment metrics
- 1% rule
- 0.92% ✗
- Cap rate
- 8.00%
- Cash-on-cash
- 6.09%
- DSCR
- 1.27
- GRM
- 9.0
CMA / ARV
- ARV (on-the-fly)
- $204,015
- Comps found
- 12
Show comp detail 12 sales within ~0.75 mi
| Address | Dist | Beds/Ba | Sqft | Sold | Price | $/sf | Match |
|---|---|---|---|---|---|---|---|
| 711 Vermont Ave | 0.13mi | 3/1.0 | 1,048 (+4%) | 1mo | $193,000 | $184 | 86 |
| 232 Ohio Ave | 0.14mi | 3/1.5 | 1,068 (+6%) | 6mo | $230,000 | $215 | 76 |
| 401 Newton Ter | 0.32mi | 3/1.0 | 1,035 (+3%) | 6mo | $140,000 | $135 | 75 |
| 428 Virginia Ave | 0.25mi | 3/1.0 | 1,126 (+12%) | 3mo | $184,500 | $164 | 66 |
| 614 Oak Hill Ave | 0.16mi | 3/2.0 | 1,108 (+10%) | 11mo | $245,000 | $221 | 63 |
| 104 Van Buren St | 0.59mi | 2/1.0 (-1) | 960 (-4%) | 4mo | $145,000 | $151 | 57 |
| 108 Van Buren St | 0.60mi | 3/2.0 | 1,044 (+4%) | 9mo | $217,450 | $208 | 54 |
| 305 Prince St | 0.71mi | 3/1.5 | 1,061 (+6%) | 6mo | $215,000 | $203 | 50 |
| 835 S Division St | 0.56mi | 2/1.0 (-1) | 936 (-7%) | 9mo | $129,000 | $138 | 50 |
| 710 Roger St | 0.75mi | 2/1.0 (-1) | 1,029 (+2%) | 8mo | $208,500 | $203 | 50 |
| 304 E Lincoln Ave | 0.66mi | 3/1.0 | 856 (-15%) | 9mo | $215,000 | $251 | 37 |
| 916 Vincent St | 0.65mi | 2/1.5 (-1) | 868 (-14%) | 9mo | $212,999 | $245 | 32 |
Match score weights: distance 35% · size 25% · config 20% · recency 20%. Top-matched comps best support the ARV.
Projected returns pro-forma
-3.0% appreciation · 7.21% rent growth · sell at horizon
- IRR
- -2.9%
- Equity multiple
- 0.89×
- Total profit
- $-5,595
- Equity at exit
- $26,689
- IRR
- 10.6%
- Equity multiple
- 1.96×
- Total profit
- $48,316
- Equity at exit
- $15,477
Cash invested: $50,120 (down + closing). Projections, not guarantees.
Landlord ↔ Tenant lean methodology
- Overall (STATE)
- 27 Tenant-Leaning
- State Maryland
- 27 Tenant-Leaning · D+14
- County
- — inherits STATE
- City
- — inherits STATE
ZIP-level market 21801
- Home prices YoY
- -30.6%
- Rents YoY
- 7.2%
- Active inventory
- 190
- Price-to-rent
- 9.0×
Monthly cashflow live
- Estimated rent
- $1,654 high interval (Pro) →
- Mortgage (P&I)
- −$939
- Tax from tax record
- −$39 /mo · $471/yr
- Insurance
- −$75
- HOA
- −$0
- Vacancy / Maint / Mgmt
- −$347
- Net cashflow
- $254
Break-even live
UW: 25.0% down · 7.5% · 30yr · 1.5% tax · 5.0% vac · 8.0% maint · 8.0% mgmt
Financing live
Cash to close
- Down payment
- $44,750
- Closing costs
- $5,370
- Reserves months
- —
- Total cash needed
- —
Loan-product check · same deal, 3 products live
Conventional
25% down · 7.5% · 30yr
- Down + closing
- —
- Monthly P&I
- —
- Monthly cashflow
- —
- DSCR
- —
- Eligible?
- —
Personal DTI + credit; lowest rate.
DSCR
20% down · 8.5% · 30yr
- Down + closing
- —
- Monthly P&I
- —
- Monthly cashflow
- —
- DSCR
- —
- Eligible?
- —
No personal income docs; deal must DSCR.
Hard money
10% down · 12.0% · 12mo
- Down + closing
- —
- Monthly P&I
- —
- Monthly cashflow
- —
- DSCR
- —
- Eligible?
- —
Short-term bridge; refi at stabilization.
Rent comps 22 comps
| Address | Beds | Baths | Sqft | Rent | $/sqft | DOM | Units | Dist |
|---|---|---|---|---|---|---|---|---|
| 231 Newton St Unit A Salisbury, MD | 3.0 | 1.0 | 1000 | $1,595 | $1.59 | 43d | 1 | 0.28mi |
| 231 Newton St Unit B Salisbury, MD | 2.0 | 1.0 | 736 | $1,400 | $1.90 | 43d | 1 | 0.28mi |
| 518 Alabama Ave Salisbury, MD | 1.0–3.0 | 1.0–2.5 | 1028 | $1,784 | $1.73 | 13d | 14 | 0.30mi |
| 550 Riverside Dr Salisbury, MD | 3.0 | 2.0 | 1250 | $1,975 | $1.58 | 43d | 1 | 0.35mi |
| 218 W Main St Unit 401 Salisbury, MD | 2.0 | 1.0 | 1060 | $1,695 | $1.60 | 43d | 1 | 0.58mi |
| 315 Princeton Ave Salisbury, MD | 4.0 | 1.0 | 1023 | $1,500 | $1.47 | 43d | 1 | 0.81mi |
| 306 Carrollton Ave Salisbury, MD | 4.0 | 1.0 | 1163 | $1,700 | $1.46 | 43d | 1 | 0.82mi |
| 1014 Cecil St Salisbury, MD | 3.0 | 1.0 | 1023 | $1,500 | $1.47 | 43d | 1 | 0.85mi |
| 308 N Division St #12 Salisbury, MD | 2.0 | 1.0 | 990 | $1,295 | $1.31 | 43d | 1 | 0.87mi |
| 504 Juniper St Salisbury, MD | 3.0 | 1.0 | 960 | $1,595 | $1.66 | 21d | 1 | 0.92mi |
| 1008 Adams Ave Unit 11D Salisbury, MD | 2.0 | 1.0 | 918 | $1,250 | $1.36 | 21d | 1 | 0.94mi |
| 1022 Adams Ave Unit 1D Salisbury, MD | 2.0 | 1.0 | 918 | $1,400 | $1.53 | 43d | 1 | 0.95mi |
| 719 Shiloh St Unit 1 Salisbury, MD | 3.0 | 1.0 | 1152 | $1,625 | $1.41 | 13d | 1 | 1.00mi |
| 101 Cedar Xing Salisbury, MD | 4.0 | 2.0–4.0 | 965 | $1,375 | $1.42 | 13d | 9 | 1.00mi |
| 1027 Adams Ave Ste A Salisbury, MD | 2.0 | 1.0–2.0 | 576 | $1,425 | $2.47 | 13d | 13 | 1.01mi |
| 529 E William St Salisbury, MD | 3.0 | 1.0 | 1057 | $1,495 | $1.41 | 21d | 1 | 1.06mi |
| 146 Onley Rd Salisbury, MD | 3.0 | 1.0 | 960 | $1,550 | $1.61 | 43d | 1 | 1.13mi |
| 1017 Tyler Ave Salisbury, MD | 2.0 | 1.0 | 1024 | $1,650 | $1.61 | 21d | 1 | 1.15mi |
| 304 Glen Ave Salisbury, MD | 1.0–2.0 | 1.0 | 675 | $1,300 | $1.93 | 43d | 4 | 1.37mi |
| 915 N Division St Unit A Salisbury, MD | 3.0 | 1.0 | 900 | $1,395 | $1.55 | 43d | 1 | 1.39mi |
| 255 Canal Park Dr Apt C Salisbury, MD | 4.0 | 2.0 | 1250 | $1,600 | $1.28 | 43d | 1 | 1.47mi |
| 205 W London Ave Salisbury, MD | 2.0 | 1.0 | 840 | $1,500 | $1.79 | 21d | 1 | 1.49mi |
Listing history 8 events
-
2026-06-18days on market $179,000 Active 9 DOM
-
2026-06-17days on market $179,000 Active 8 DOM
-
2026-06-16days on market $179,000 Active 7 DOM
-
2026-06-15days on market $179,000 Active 6 DOM
-
2026-06-14days on market $179,000 Active 4 DOM
-
2026-06-13days on market $179,000 Active 3 DOM
-
2026-06-10remarks 699-char remark
-
2026-06-10$179,000 Active 1 DOM
ⓘ Source: listings_history table (triggers on properties + properties_extension) + one-shot
backfill from property_details.listing_events for pre-trigger history.
Tax reassessment forecast MD · Partial reset (capped growth)
- Current annual tax
- $471 · $39/mo
- Projected year-2 tax
- $1,211 · $101/mo
- Expected delta
- +$740/yr (+$62/mo · 157.0%)
ⓘ Screening estimate from a state-policy table — verify with the county assessor before closing.
Climate risk First Street
- Flood 5/10 Major FEMA zone X (unshaded) · 47% chance over 30 yrs
- Wildfire 1/10 Low
- Heat 8/10 Severe 7 d/yr ≥105°F today · 16 d/yr by 30 yrs out
- Wind 7/10 Severe 78% chance of damaging wind over 30 yrs
- Air quality 2/10 Low 1 unhealthy d/yr today · 2 by 30 yrs out
Nearby sold comps map
Loading sold comps map…
Walkable amenities ~0.75 mi
Loading nearby amenities…
Taxation est. · year 1
- Rental income
- $19,851
- − Mortgage interest
- −$10,027
- − Property taxes
- −$471
- − Insurance
- −$895
- − Repairs & maintenance
- −$1,588
- − Management
- −$1,588
- − Depreciation
- −$5,207
- Taxable income
- $74
- Est. tax owed @ 24.0%
- −$18
- After-tax cash flow
- $3,034/yr
For passive investors: Depreciation is non-cash, so a rental often shows a tax loss while cash-flowing — sheltering income. Rental losses are passive: they offset passive income freely, and up to $25,000/yr can offset ordinary (W-2) income if you actively participate and your MAGI is under $100k (phasing out to $0 by $150k); unused losses carry forward. On sale, claimed depreciation is recaptured at up to 25%, and gains may owe capital-gains tax (a 1031 exchange can defer both). Figures are a year-1 estimate at your 24.0% rate — not tax advice; consult a CPA.
Schools (NCES district)
- District
- Wicomico County Public Schools
- NCES district ID
- 2400690
- Math proficiency
- 16% ▼ -18.00%
- Reading proficiency
- 26% ▼ -13.00%
- Median HH income
- $51,745
- Composite
- 18.87/100
- National rank
- #8860
- State rank
- #19 of 24 in MD
Livability — Salisbury
- Score
- 60/100
- State rank
- #351
- US rank
- #18948
Category grades
Schools grade is shown separately in the Schools card above.
Census & demographics
- Census place
- Salisbury, MD
- County
- Wicomico County · 75,969 people
- City population
- 70,518
- Metro
- Salisbury, MD-DE
- Population (ZIP)
- 30,088
- Household income
- $71,313
- Rent vs Own
- Severe rent burden
- 964.0
Population outlook (Wicomico County) Hauer SSP2
- Today (2025)
- 108,548 people
- By 2030
- 111,783 · +3.0%
- By 2040
- 118,139 · +8.8%
- By 2050
- 123,641 · +13.9%
- By 2075
- 139,784 · +28.8%
- By 2100
- 145,334 · +33.9%
Race, ethnicity, and origin ACS 2023
- Neighborhood character
- Diverse neighborhood (Simpson 0.60)
- Race & ethnicity
- White 54% Black 33% Two or more races 6% Hispanic / Latino 6% Asian 2%
- Hispanic origin (detail)
- Mexican 3%
- Common ancestry
- Hispanic 4% Romanian 2% Slovak 2%
- Foreign-born
- 8% · Canada, China
- Languages at home
- 89% English-only · Spanish 4% French/Haitian/Cajun 3% Other Indo-European 2%
Political lean MEDSL · Wicomico
- 2024 margin
- Lean R (+5.5) · D 46.1% · R 51.5% · Other 2.4%
- 2008→2024 swing
- +0.3pp no change · 2008: -5.8pp · 2024: -5.5pp
- All cycles
- 2024: R+5.5 2020: R+1.9 2016: R+11.6 2012: R+6.9 2008: R+5.8
Not yet ingested
- Civics
- —
Market trends
- HPI YoY
- ▼ -102.55%
- Current HPI
- 232.3103
- Rent YoY
- ▲ 7.21%
- Metro
- Salisbury, MD-DE
- State GDP YoY
- ▲ 2.97%
- F500 in state
- 12
Industry mix (Fortune 500 HQ in MD)
| Industry | F500 HQs | Revenue |
|---|---|---|
| Aerospace / Defense | 1 | $71B |
|
||
| Utilities | 1 | $25B |
|
||
| Hotels | 1 | $24B |
|
||
| Consumer Goods | 1 | $7B |
|
||
| Real Estate | 1 | $6B |
|
||
| Chemicals | 1 | $2B |
|
||
Price history
1 event — show timeline
- 2026-06-09 Listed $179,000 BRIGHT MLS
Property tax history
-3.7%/yrLatest (2025): $471 · +12.2% YoY. Source: county tax records.
Cash-flow waterfall
monthlySold comps — $/sqft
last 12 mo · ≤1 miLoading sold comps…