14352 Beach Blvd #126 · Westminster, CA
Flood risk 1/10 · Minimal
- FEMA flood zone
- X (shaded)
- Chance of flooding over 30 yrs
- 0.0%
- Est. flood insurance / yr
- $507 – $1,088
Fire risk 1/10 · Minimal
- Est. fire insurance / yr
- $659 – $1,223
Heat risk 5/10 · Moderate
- Hot days now (above 87°F)
- 7 days/yr
- Hot days in 30 yrs
- 23 days/yr
Wind risk 1/10 · Minimal
- Chance of severe wind over 30 yrs
- —
Air-quality risk 5/10 · Moderate
- Unhealthy air days now
- 7 days/yr
- Unhealthy air days in 30 yrs
- 8 days/yr
Risk factors via First Street. Map © Google.
Why this score? — see what drove the B- grade
The composite is a weighted blend of 9 inputs, each scored 0–100. Each bar is that input's sub-score; the figure is the points it added to the 100-point composite (weight × sub-score).
- Cash flow +30.0/30.0
- 1% rule +10.0/10.0
- DSCR +10.0/10.0
- Schools +6.5/10.0
- ARV discount +4.6/15.0
- Livability +3.1/5.0
- Rent growth +3.0/5.0
- Condition / age +2.5/5.0
- Appreciation +0.0/10.0
$165,000
🖨 Deal sheet 📄 Offer letter ✓ Due diligence
Listing remarks
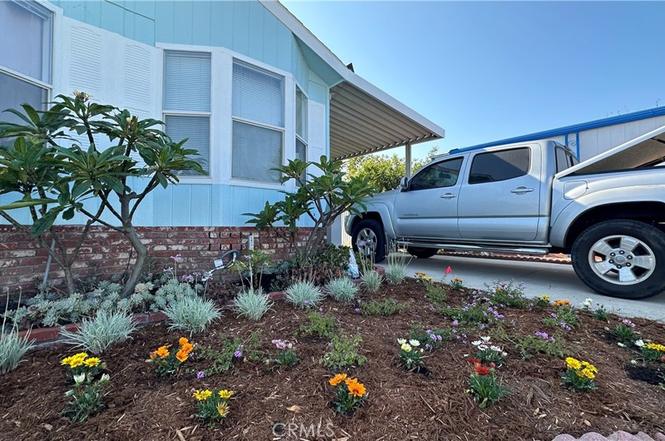
Discover the modern living with this stunning 946 sf mobile home built 2002, nestled within a welcoming family park in Westminster. This residence boasts three bedrooms and two bathrooms, providing ample space for comfortable living. Enjoy the convenience of two enclosed parking spaces and revel in year-round comfort with central air conditioning. New exterior paint and front garden landscape. New AC controller, new bathroom fixture, new ceiling light and fan. Don't miss this opportunity to make this beautiful home yours!
Key facts
- New bathroom fixture
- New ceiling light
- New exterior paint
Tags
Property features AI
Finance
- Other: Located in Beach Blvd Cottages park; Built by Fleetwood Homes CA Inc; Near public transit
- Financial info: Monthly land lease approximately $2,094 (park)
- HOA & community: Land lease community (park-managed); Rent includes trash and pool; Community is suburban; Manager approval required; Pets allowed with breed restrictions; Sewer assessments
Exterior
- Parking: Attached garage; Carport attached; 2 parking spaces (2 garage spaces)
- Utilities: Public sewer; District/public water; Natural gas connected; Electricity connected; Sewer connected
- Home design: Single-story mobile home (model 8483B); Entry at level 1; One total story
- Construction: Mobile home remains on site; Mobile dimensions approximately 9 ft wide by 48 ft long; Year built source: public records
- Exterior features: Enclosed patio; Community pool
Interior
- Kitchen: Open to family room; Gas cooktop; Electric oven; Microwave; Refrigerator; Water heater unit
- Bedrooms: All bedrooms on main level
- Flooring: Tile flooring; Laminate flooring
- Bathrooms: 2 full bathrooms; Bathtub; Shower in tub; Bidet; Dual/multiple shower heads; Vanity area
- Heating & cooling: Central cooling; Central furnace (natural gas)
- Interior features: Ceiling fan; Pantry; One-level home; Community spa
- Laundry & utility: Washer included; Dryer included; Washer hookup; Gas dryer hookup
Neighborhood map
What this means for you Summary
Snapshot
- This is a 3-bed/2.0-bath manufactured listed at $165k.
Deal economics
- At list price, monthly cash flow is $1k ($14k/yr) — positive.
- The deal already cash-flows at list — no discount required.
- Meets the 1% rule at list price ($3k rent vs $165k).
- Recommended offer: $155k (6.0% below list) — sets the bar for market timing.
- Cap rate 14.5% vs local median 2.0% in Westminster — top-decile yield for the area; either an underpriced asset or a hidden risk that comps aren't pricing in. Stress-test before assuming the spread holds.
Location & tenants
- Location reads 62/100 on livability (#509 in CA) — a middle-class / working-renter tenant base. Strengths: commute A+; Watch: crime D-, amenities F, cost of living F.
- Huntington Beach Union High (suburban): math 65% / reading 82% proficiency, ranked #39 of 517 in CA (top 8%) — strong family-tenant draw, lease renewals of 3-5y typical.
- Market conditions: Rents rising (+2.0%/yr); 87 active listings in the ZIP; 30 comparable units currently listed for rent nearby; rentals leasing fast (median 1d on market — plan ~1-2 weeks tenant-placement turnaround); solid renter incomes; 6,974 units permitted in Orange County in 2024 (3,839 in 5+ unit buildings).
- This rent runs 40% of the median local income ($86k/yr) — at the standard rent-burdened threshold; future hikes will face affordability resistance.
Forward outlook
- Local home prices are declining (-3.0%/yr); year-one equity from $1k of loan paydown is wiped out by about $5k of value loss. Plan a longer hold.
- Orange County population projected at +14% by 2050 — modest demand growth; plan on rents tracking national, not racing it.
- At projected returns (-3.0% appreciation + 2.0% rent growth), your $46k cash investment doubles in ~5 years — after that, you're playing with house money.
Negotiation context
- It's been on market 87 days — a 6% lower offer ($155k) is reasonable based on typical stale-listing flexibility.
- 4 sale attempts since 2y ago with the ask held roughly flat each time — persistent listings suggest the price (not the market) is what's stuck; bring a comps-based counter.
Risks & watch-outs
- Climate carrying-cost: extreme-heat days projected 7→23/yr by 2055 (HVAC capex compounding) — expect insurance premiums to compound above CPI over the hold.
Questions for the listing agent
- It's been on market 87 days. Have you received any prior offers? Is the seller open to a 6% concession, seller financing, or rate buy-down credit?
- Why hasn't it sold? Are there any deal-killer items the seller is aware of (foundation, flood, title, zoning, code violations)?
- Is there a deadline driving the sale (1031 exchange, divorce, estate, relocation)? That informs how much negotiation room exists.
- Crime grade is D in this area — have there been break-ins, vandalism, or insurance claims at this property in the last 3 years? What carrier currently insures it and at what premium?
- What's the average days-on-market for RENTAL listings here right now (not sales)? A rising rental-DOM trend means longer vacancies and softer asking-rent achievability than the comps imply.
- What's the recent tenant-quality profile in this submarket — average credit score on applications, eviction rate, late-payment / NSF rate, and stable-employment percentage? A property-management company in the area should have these aggregated.
- How much new for-sale + rental construction is in the pipeline within 1–3 miles? Heavy new supply typically softens prices + rents 12–24 months out; constrained supply supports both.
Investment metrics
- 1% rule
- 1.74% ✓
- Cap rate
- 14.53%
- Cash-on-cash
- 29.41%
- DSCR
- 2.31
- GRM
- 4.8
CMA / ARV
- ARV (on-the-fly)
- $155,144
- Comps found
- 12
Show comp detail 12 sales within ~0.75 mi
| Address | Dist | Beds/Ba | Sqft | Sold | Price | $/sf | Match |
|---|---|---|---|---|---|---|---|
| 14352 Beach Blvd #126 | 0.00mi | 3/2.0 | 946 (0%) | 0mo | $155,000 | $164 | 100 |
| 14352 Beach Blvd #18 | 0.02mi | 2/2.0 (-1) | 960 (+2%) | 11mo | $119,000 | $124 | 83 |
| 14352 Beach Blvd #96 | 0.02mi | 2/2.0 (-1) | 1,000 (+6%) | 17mo | $110,000 | $110 | 71 |
| 14352 Beach #66 | 0.10mi | 2/2.0 (-1) | 1,080 (+14%) | 1mo | $125,000 | $116 | 66 |
| 14272 Hoover St #101 | 0.47mi | 3/2.0 | 944 (-0%) | 14mo | $260,000 | $275 | 66 |
| 14272 Hoover St | 0.47mi | 3/2.0 | 1,000 (+6%) | 4mo | $210,000 | $210 | 66 |
| 14272 Hoover St #126 | 0.47mi | 3/2.0 | 940 (-1%) | 16mo | $250,000 | $266 | 63 |
| 14352 Beach Blvd #11 | 0.10mi | 2/1.0 (-1) | 1,000 (+6%) | 19mo | $85,000 | $85 | 61 |
| 14352 Beach Blvd #67 | 0.00mi | 2/2.0 (-1) | 1,038 (+10%) | 23mo | $166,000 | $160 | 60 |
| 14352 Beach Blvd #39 | 0.02mi | 2/2.0 (-1) | 1,040 (+10%) | 24mo | $76,000 | $73 | 58 |
| 14272 Hoover St #141 | 0.47mi | 3/2.0 | 1,000 (+6%) | 15mo | $220,000 | $220 | 56 |
| 14272 HOOVER St #93 | 0.47mi | 2/2.0 (-1) | 960 (+2%) | 24mo | $160,000 | $167 | 51 |
Match score weights: distance 35% · size 25% · config 20% · recency 20%. Top-matched comps best support the ARV.
Projected returns pro-forma
-3.0% appreciation · 2.01% rent growth · sell at horizon
- IRR
- 22.8%
- Equity multiple
- 1.92×
- Total profit
- $42,582
- Equity at exit
- $24,602
- IRR
- 30.1%
- Equity multiple
- 3.57×
- Total profit
- $118,701
- Equity at exit
- $14,266
Cash invested: $46,200 (down + closing). Projections, not guarantees.
Landlord ↔ Tenant lean methodology
- Overall (STATE)
- 18 Strongly Tenant-Friendly
- State California
- 18 Strongly Tenant-Friendly · D+13
- County
- — inherits STATE
- City
- — inherits STATE
ZIP-level market 92683
- Rents YoY
- 2.0%
- Active inventory
- 87
- Price-to-rent
- 4.8×
Monthly cashflow live
- Estimated rent
- $2,877 high interval (Pro) →
- Mortgage (P&I)
- −$865
- Tax est. 1.5%
- −$206 /mo · $2,475/yr
- Insurance
- −$69
- HOA
- −$0
- Vacancy / Maint / Mgmt
- −$604
- Net cashflow
- $1,132
Break-even live
UW: 25.0% down · 7.5% · 30yr · 1.5% tax · 5.0% vac · 8.0% maint · 8.0% mgmt
Financing live
Cash to close
- Down payment
- $41,250
- Closing costs
- $4,950
- Reserves months
- —
- Total cash needed
- —
Loan-product check · same deal, 3 products live
Conventional
25% down · 7.5% · 30yr
- Down + closing
- —
- Monthly P&I
- —
- Monthly cashflow
- —
- DSCR
- —
- Eligible?
- —
Personal DTI + credit; lowest rate.
DSCR
20% down · 8.5% · 30yr
- Down + closing
- —
- Monthly P&I
- —
- Monthly cashflow
- —
- DSCR
- —
- Eligible?
- —
No personal income docs; deal must DSCR.
Hard money
10% down · 12.0% · 12mo
- Down + closing
- —
- Monthly P&I
- —
- Monthly cashflow
- —
- DSCR
- —
- Eligible?
- —
Short-term bridge; refi at stabilization.
Rent comps 30 comps
| Address | Beds | Baths | Sqft | Rent | $/sqft | DOM | Units | Dist |
|---|---|---|---|---|---|---|---|---|
| 7861 14th St Unit C Westminster, CA | 2.0 | 2.0 | 925 | $2,800 | $3.03 | 1d | 1 | 0.24mi |
| 7861 14th St Westminster, CA | 2.0 | 2.0 | 1025 | $2,700 | $2.63 | 2d | 1 | 0.25mi |
| 14332 Joyce Ave Westminster, CA | 3.0 | 2.0 | 1100 | $3,890 | $3.54 | 1d | 1 | 0.38mi |
| 7643 14th St Westminster, CA | 2.0 | 2.0 | 1002 | $3,250 | $3.24 | 1d | 1 | 0.42mi |
| 7661 Baylor Dr Westminster, CA | 1.0–2.0 | 1.0 | 787 | $2,400 | $3.05 | 1d | 2 | 0.49mi |
| 13920 Hoover St Westminster, CA | 2.0 | 1.0–2.0 | 645 | $3,031 | $4.70 | 1d | 11 | 0.65mi |
| 8631 Westminster Ave Garden Grove, CA | 1.0–2.0 | 1.0 | 660 | $2,489 | $3.77 | 1d | 9 | 0.72mi |
| 8810 Hewitt Pl #22 Garden Grove, CA | 2.0 | 2.5 | 1025 | $3,200 | $3.12 | 1d | 1 | 0.93mi |
| 7731 Trask Ave Westminster, CA | 2.0 | 1.0 | 960 | $2,595 | $2.70 | 1d | 2 | 0.98mi |
| 14051 Locust St Unit 201 Westminster, CA | 2.0 | 2.5 | 1019 | $3,127 | $3.07 | 15d | 1 | 0.98mi |
| 7012 Main St Westminster, CA | 1.0–2.0 | 1.0 | 812 | $2,395 | $2.95 | 10d | 5 | 1.01mi |
| 13781 Cherry St Unit 2 Westminster, CA | 2.0 | 1.0 | 1000 | $2,300 | $2.30 | 16d | 1 | 1.02mi |
| 13781 Cherry St Westminster, CA | 2.0 | 1.0 | 1000 | $2,300 | $2.30 | 1d | 1 | 1.02mi |
| 7012 Main St Unit 7042-11 Westminster, CA | 2.0 | 1.0 | 900 | $2,395 | $2.66 | 1d | 1 | 1.02mi |
| 7012 Main St Unit 7022-16 Westminster, CA | 2.0 | 1.0 | 900 | $2,395 | $2.66 | 7d | 1 | 1.02mi |
| 7012 Main St Unit 7042-06 Westminster, CA | 2.0 | 1.0 | 900 | $2,395 | $2.66 | 16d | 1 | 1.02mi |
| 13751 Cherry St Unit 3 Westminster, CA | 2.0 | 1.0 | 800 | $2,325 | $2.91 | 1d | 1 | 1.03mi |
| 13751 Cherry St Unit 4 Westminster, CA | 2.0 | 1.0 | 700 | $2,395 | $3.42 | 1d | 1 | 1.03mi |
| 13751 Cherry St Unit 6 Westminster, CA | 2.0 | 1.0 | 700 | $2,495 | $3.56 | 1d | 1 | 1.03mi |
| 8520 Gloria Ave Garden Grove, CA | 1.0–2.0 | 1.0 | 762 | $2,450 | $3.21 | 1d | 4 | 1.03mi |
| 13782 Locust St Westminster, CA | 2.0 | 1.0 | 917 | $2,765 | $3.02 | 1d | 2 | 1.07mi |
| 13171 Monroe St Garden Grove, CA | 2.0 | 2.0 | 988 | $2,795 | $2.83 | 1d | 1 | 1.20mi |
| 7211 Trask Ave Unit 7211-A Westminster, CA | 2.0 | 1.5 | 1100 | $2,595 | $2.36 | 1d | 1 | 1.21mi |
| 8041 Worthy Dr Westminster, CA | 2.0 | 1.0 | 900 | $2,700 | $3.00 | 1d | 1 | 1.26mi |
| 13051 Monroe St Unit C Garden Grove, CA | 2.0 | 2.0 | 1100 | $2,700 | $2.45 | 1d | 1 | 1.32mi |
| 15200 Magnolia St Westminster, CA | 1.0–2.0 | 1.0 | 762 | $2,675 | $3.51 | 1d | 2 | 1.33mi |
| 14523 Ontario Dr Westminster, CA | 2.0 | 2.0 | 750 | $2,600 | $3.47 | 43d | 1 | 1.35mi |
| 13091 Yockey St Garden Grove, CA | 1.0–3.0 | 1.0–2.0 | 1035 | $3,295 | $3.18 | 1d | 3 | 1.45mi |
| 12901 Dale St Garden Grove, CA | 1.0–2.0 | 1.0 | 876 | $2,707 | $3.09 | 1d | 6 | 1.46mi |
| 15100 Moran St Westminster, CA | 1.0–2.0 | 1.0–2.0 | 1204 | $3,847 | $3.19 | 1d | 8 | 1.47mi |
Listing history 16 events
-
2026-06-09days on market $165,000 Active 87 DOM
-
2026-06-08days on market $165,000 Active 86 DOM
-
2026-06-07days on market $165,000 Active 85 DOM
-
2026-06-04days on market $165,000 Active 82 DOM
-
2026-06-03days on market $165,000 Active 81 DOM
-
2026-06-02days on market $165,000 Active 80 DOM
-
2026-06-01days on market $165,000 Active 79 DOM
-
2026-05-31days on market $165,000 Active 78 DOM
-
2026-04-19status Active
-
2026-03-09historical
-
2026-03-05price $165,000
-
2026-02-01$171,000 Active
-
2024-05-07status Active
-
2024-05-07historical
-
2024-04-20price $159,000
-
2024-03-23$169,000 Active
ⓘ Source: listings_history table (triggers on properties + properties_extension) + one-shot
backfill from property_details.listing_events for pre-trigger history.
Climate risk First Street
- Flood 1/10 Low FEMA zone X (shaded) · 0% chance over 30 yrs
- Wildfire 1/10 Low
- Heat 5/10 Major 7 d/yr ≥87°F today · 23 d/yr by 30 yrs out
- Wind 1/10 Low
- Air quality 5/10 Major 7 unhealthy d/yr today · 8 by 30 yrs out
Nearby sold comps map
Loading sold comps map…
Walkable amenities ~0.75 mi
Loading nearby amenities…
Taxation est. · year 1
- Rental income
- $34,519
- − Mortgage interest
- −$9,243
- − Property taxes
- −$2,475
- − Insurance
- −$825
- − Repairs & maintenance
- −$2,762
- − Management
- −$2,762
- − Depreciation
- −$4,800
- Taxable income
- $11,654
- Est. tax owed @ 24.0%
- −$2,797
- After-tax cash flow
- $10,790/yr
For passive investors: Depreciation is non-cash, so a rental often shows a tax loss while cash-flowing — sheltering income. Rental losses are passive: they offset passive income freely, and up to $25,000/yr can offset ordinary (W-2) income if you actively participate and your MAGI is under $100k (phasing out to $0 by $150k); unused losses carry forward. On sale, claimed depreciation is recaptured at up to 25%, and gains may owe capital-gains tax (a 1031 exchange can defer both). Figures are a year-1 estimate at your 24.0% rate — not tax advice; consult a CPA.
Schools (NCES district)
- District
- Huntington Beach Union High
- NCES district ID
- 0618060
- Math proficiency
- 65% ▲ 17.00%
- Reading proficiency
- 82% ▲ 8.00%
- Median HH income
- $78,159
- Composite
- 64.9/100
- National rank
- #511
- State rank
- #39 of 517 in CA
Livability — Westminster
- Score
- 62/100
- State rank
- #509
- US rank
- #17242
Category grades
Schools grade is shown separately in the Schools card above.
Census & demographics
- Census place
- Westminster, CA
- County
- Orange County · 3,096,323 people
- City population
- 89,833
- Metro
- Los Angeles-Long Beach-Anaheim, CA
- Population (ZIP)
- 89,833
- Household income
- $85,585
- Rent vs Own
- Severe rent burden
- 4639.0
Population outlook (Orange County) Hauer SSP2
- Today (2025)
- 3,477,456 people
- By 2030
- 3,613,117 · +3.9%
- By 2040
- 3,835,945 · +10.3%
- By 2050
- 3,968,736 · +14.1%
- By 2075
- 4,097,053 · +17.8%
- By 2100
- 3,903,633 · +12.3%
Race, ethnicity, and origin ACS 2023
- Neighborhood character
- Diverse neighborhood (Simpson 0.64)
- Race & ethnicity
- Asian 51% Hispanic / Latino 24% White 20% Two or more races 9%
- Hispanic origin (detail)
- Mexican 20%
- Common ancestry
- Slovak 1% Portuguese 1% Lithuanian 1%
- Foreign-born
- 46% · Vietnam, Canada, China
- Languages at home
- 35% English-only · Vietnamese 40% Spanish 18% Chinese 2%
Political lean MEDSL · Orange
- 2024 margin
- Toss-up / Even · D 49.7% · R 47.1% · Other 3.2%
- 2008→2024 swing
- +5.2pp toward D · 2008: -2.6pp · 2024: 2.6pp
- All cycles
- 2024: D+2.6 2020: D+9.0 2016: D+7.7 2012: R+8.3 2008: R+2.6
Not yet ingested
- Civics
- —
Market trends
- HPI YoY
- ▼ -917.95%
- Current HPI
- 410.3463
- Rent YoY
- ▲ 2.01%
- Metro
- Los Angeles-Long Beach-Anaheim, CA
- State GDP YoY
- ▲ 3.21%
- F500 in state
- 116
Industry mix (Fortune 500 HQ in CA)
| Industry | F500 HQs | Revenue |
|---|---|---|
| Technology | 27 | $1,492B |
|
||
| Financial Services | 3 | $174B |
|
||
| Retail | 3 | $44B |
|
||
| Insurance | 3 | $26B |
|
||
| Media / Entertainment | 2 | $115B |
|
||
| Pharmaceuticals / Biotech | 2 | $62B |
|
||
Price history
-2.4% since first listed8 events — show timeline
- 2026-04-19 Relisted — CRMLS
- 2026-03-09 Listing Removed — CRMLS
- 2026-03-05 Price Changed $165,000 CRMLS
- 2026-02-01 Listed $171,000 CRMLS
- 2024-05-07 Relisted — CRMLS
- 2024-05-07 Listing Removed — CRMLS
- 2024-04-20 Price Changed $159,000 CRMLS
- 2024-03-23 Listed $169,000 CRMLS
Property tax history
-2.6%/yrLatest (2025): $223 · +51.2% YoY. Source: county tax records.
Cash-flow waterfall
monthlySold comps — $/sqft
last 12 mo · ≤1 miLoading sold comps…